Image Clustering Method Based on Self Organization
Mapping: SOM Derived Density Maps and Its
Application for Landsat Thematic Mapper Image
Clustering
Kohei Arai 1
Graduate School of Science and Engineering Saga University
Saga City, Japan
Abstract—A new method for image clustering with density maps derived from Self-Organizing Maps (SOM) is proposed together with a clarification of learning processes during a construction of clusters. Simulation studies and the experiments with remote sensing satellite derived imagery data are conducted. It is found that the proposed SOM based image clustering method shows much better clustered result for both simulation and real satellite imagery data. It is also found that the separability among clusters of the proposed method is 16% longer than the existing k-mean clustering. It is also found that the separability among clusters of the proposed method is 16% longer than the existing k-mean clustering. In accordance with the experimental results with Landsat-5 TM image, it takes more than 20000 of iteration for convergence of the SOM learning processes.
Keywords—SOM clustering; Density map; Boundary image; Labeling algorithm
I. INTRODUCTION
Clustering method is widely used for data analysis and pattern recognition [1]-[4]. Meanwhile, Self Organizing Map: SOM proposed by T. Kohonen is a neural network with two layers which allows use as un-supervised classification, or learning method [5] based on a similarity between separable data groups to be classified [6]. In other word, SOM is a visualization tool for multi-dimensional data rearranging the data in accordance with a similarity based on a learning process with the statistical characteristics of the data. It is used to be used for pattern recognition in combination with Learning Vector Quantization (LVQ1). SOM is consists of m-dimensional input layer which represent as a vector and two dimensional output layer which is also represented as a vector connected each other nodes between input and output layers with weighting coefficients. In a learning process, winning unit is chosen based on the difference between input vector and weighting coefficients vector then the selected unit and surrounding units get closer to the input vector.
1 http://en.wikipedia.org/wiki/Learning_Vector_Quantization
SOM is utilized for clustering [7]. After a learning process, a density map2 is created in accordance with code vector density. Based on the density map, a pixel labeling3 can be done. This is the basic idea on the proposed image clustering method with SOM learning. Other than this, clustering methods with learning processes, reinforcement learning is also proposed for image retrievals [8] and rescue simulations [9]. Also probability density model for SOM is proposed.
The image clustering method with SOM learning based on density map is proposed in the following section followed by simulation study results and the experimental results with satellite remote sensing imagery data. Then finally, conclusions and some discussions are described.
II. PROPOSED CLUSTERING METHOD BASED ON DENSITY
MAP DERIVED FROM LEARNING PROCESS OF SOM
A. SOM Learning Process
Firstly imagery data are mapped to a feature space. In parallel, SOM learning process creates a density map in accordance with a similarity between the mapped data in the feature space and density map or between input data in the feature space and two dimensional density maps. As a result of SOM learning process, code vector is obtained [10]. It is easy to recognize the density of the code vector visually. Although code vector density map represent cluster boundaries, it is not easy that neither to determine a boundary nor to put a label to the pixel in concern by using the density map. The method proposed here is to use density map for finding boundaries among sub-clusters then some of sub-clusters which have a high similarity are to be merged in the following procedure,
1) Create density map based on SOM learning
2) Binary image is generated from the density map
3) Define sub-clusters in accordance with the separated
areas of the binary image
4) Calculate similarities of the sub-clusters
5) Merge the sub-clusters which show the highest
similarity
6) Process (4) and (5) until the number of clusters reaches the desired number of clusters
Representing input vector, x(t) and reference (or output) vector, m(t), neural network proposed by T. Kohonen is expressed as follows,
m(t+1)=m(t)+hi(t)[x(t)-m(t)] (1)
Where h(t) denotes neighboring function or weighting function including learning coefficients.
hi(t)=a(t), when i N(t)
=0, when i N(t) (2)
Where N(t) denotes the number or size of neighboring units. a(t) is called learning coefficient and ranges from 0 to 1 as is expressed as follows,
a(t)=a0(1-t/T) (3)
Where a0 is an initial value and T denotes the number of
total learning number or the number of update. In the equation (1), [x(t)-m(t)] implies cost function4 which should be minimized, and if
c=argmin.||x-mi|| (4)
i
is obtained then such mi unit is called winning unit. The
neighboring unit is defined around mi unit. The size of the
neighboring unit, N(t) is a variable which starts with a relatively large then is getting small reaching to the wining unit only after the SOM learning process.
N(t)=N(0)(1-t /T) (5)
The SOM learning process is illustrated in Figure 1.
B. Conventional Clustering Method
The existing clustering algorithm such as k-means clustering algorithm5 is similar to the SOM learning process. If mi is redefined as mean vector of cluster i, then the cost
function defined in the k-means clustering is expressed as follows,
J= ∑ ||x(t) –mi(x(t))||2 (6)
Therefore, the mean vector of each cluster is determined to minimize the equation (6) of cost function. Let I(x(t)) be a binary function and is equal to 1 if the x(t) belongs to the cluster i and is 0 if the x(t) does not belong to the cluster i, then the cost function can be rewritten as follows,
J’= ∑∑ I(x(t)) ||x(t) – mi(x(t))||2 (7)
Fig.1. Illustrative view of the SOM learning process
Meanwhile mi(x(t)) is updated as follows,
mi(x(t+1))= mi(x(t)) + λI(x(t)) ||x(t) –mi(x(t))|| (8)
It is because of the following equation.
∂J/∂mi(x(t)) = -2∑I(x(t)) ||x(t) –mi(x(t))| (9)
The k-means clustering algorithm can be rewritten as follows,
(1) Set initial status of mean vectors of k clusters, mi(x(0)),
i=1,2,….,k, then
(2)Iteration of the following two steps for t=k+1, k+2,…,N,
Ii(x(t))=1, when ||x(t) –mi(x(t))||≤ ||x(t) –mj(x(t))||∀j
=0, elsewhere (10)
t
mi(x(t+1))= mi(x(t))+ I(x(t)) ||x(t) –mi(x(t))| / ∑ I(x(t’)) (11)
t’=1
The equation (11) is identical to the equation (8) if λ is replaced to 1/∑I(x(t’)).
C. Density Map
Meanwhile, if the similar input data are separated in their location each other, it becomes neighboring units in the output layer unit. Density map f(j,k) is defined as follows,
f(j,k)= ∑ (mj,k - mj-l,k-n)T(mj,k - mj-l,k-n) / D (12)
(l,n) D
Where D is neighboring unit, 8 neighbor unit centered the unit in concern in this paper. This density map has the relation among the input imagery data, feature space and SOM learning process as is illustrated in the Figure 2.
Fig.2. Relations among the input imagery data, feature space and density map generated through SOM learning.
D. Example of Density Map
This is an inverse function of the similar data concentration so that the density map obtained by a SOM learning process is quite similar to the distribution in the feature space mapped from the input data. An example of density map is illustrated in the Figure 3. In the figure, dark portion means dense of code vector meanwhile light portion is sparse of code vector and becomes boundary between the different clusters.
Figure 4 shows a preliminary result of density map, binarized density map and clustering result with increasing of the iteration number. In this case, initial variances of the two clusters are set at 0.03. In accordance with the number of iteration, density map becomes clear together with binalized density map. Furthermore, cluster result becomes ideal goal.
Fig.3. Example of density map as a result of SOM learning process.
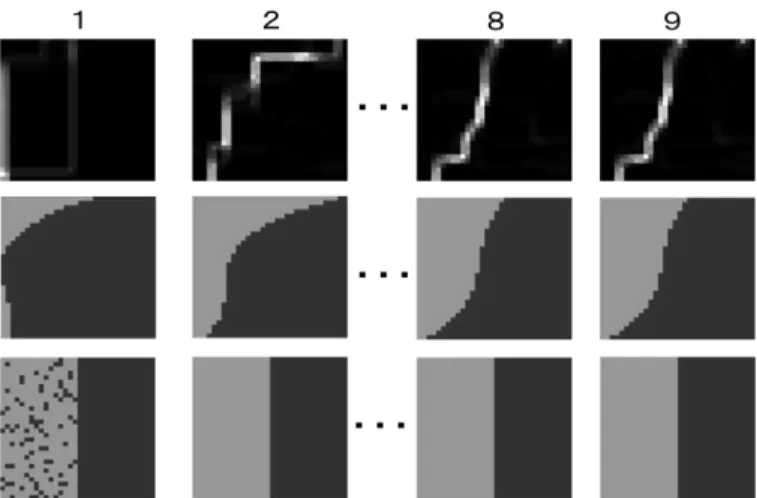
Fig.4. Example of preliminary result of density map, binarized density map and clustering result with increasing of the iteration number (multiplied by 512).
III. SIMULATION STUDIES AND THE EXPERIMENTS WITH
REMOTE SENSING SATELLITE IMAGERY DATA
Simulation studies and experiments with real remote sensing satellite imagery data are conducted. In the simulation study, binarized density map is used for determination o9f boundary between two clusters while clusters are identified from the density map including candidate sub-clusters as shown in Figure 5.
A. Simulation Studies
Two clusters and two bands of imagery data are assumed. 32 by 32 pixels of 1024 of imagery data is created with random number generator of Messene Twister. 30 of image patterns are generated for simulation studies. 10 trials are conducted for 30 of image patterns. The maximum iteration number is set at 150,000.
Three different types of image pattern of datasets are prepared depending on separability as shown in Table 1. First dataset is very easy to separate while second dataset is a little bit difficult to separate. The third dataset is totally difficult to separate.
TABLE I. PARAMETERS FOR SIMULATION DATA
Variance, σ Distance between clusters
0.03 8σ
0.04 4σ
0.05 3σ
Two dimensional probability density function for No.1 dataset is shown in Figure 6 (a) while that for No.2 is shown in Figure 6 (b). Meanwhile, two dimensional probability density function for No.3 dataset is shown in Figure 6 (c).
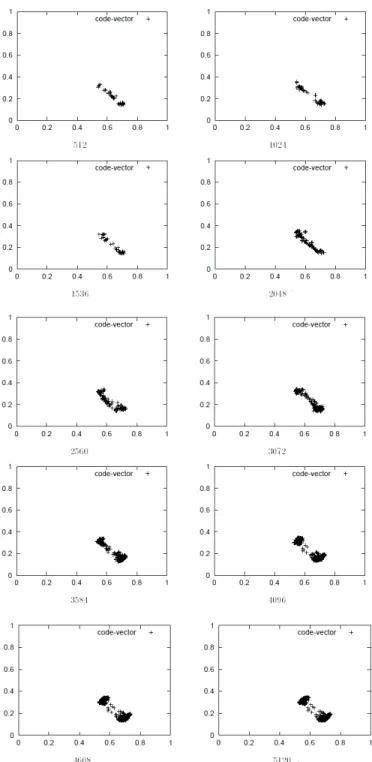
Code vector distributions at the certain iteration numbers are shown in Figure 7 while density maps, boundary images and labeling result images for the certain iteration numbers are shown in Figure 8. These two figures are for No.1 of image dataset.
(a)No.1 dataset
(b)No.2 dataset
(c)No.3 dataset
Fig.6. Two dimensional probability density function for No.1, 2, 3 dataset
Fig.9. Code vector distributions at the certain iteration numbers for the dataset No.2
Meanwhile, these for No.2 dataset are shown in Figure 9 and 10 while these for No.3 are shown in Figure 11 and 12, respectively.
Fig.10. Density maps, boundary images and labeling result images for the certain iteration numbers for dataset No.2.
Fig.11. Code vector distributions at the certain iteration numbers for the dataset No.3
Difficulty of the convergence (converged iteration numbers) depends on within cluster variance and between cluster variance obviously. For instance, it is converged so quickly for image dataset No.1 while convergence speed is not fast for the image dataset No.2.
Fig.13. Correct clustering ratios as function of iteration number.
B. Experimental Studies with Remote Sensing Satellite Imagery Data
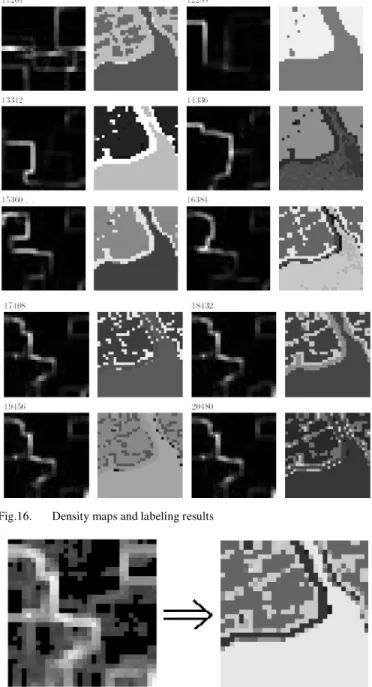
Landsat-5 TM data of Saga, Japan acquired on 15 May 1987 which is shown in Figure 14 is used. The meta data is as follows, Entity ID: LT51130371987135HAJ00, Acquisition Date: 15-MAY-87, Path: 113, Row: 37. A portion of band 1-5 and 7 of Landsat-5 TM image is shown in Figure 14 together with the topographic map of the corresponding area.
Fig.14. Landsat-5 TM data of Saga, Japan acquired on 15 May 1987 and topographic map of the corresponding area
Confusion matrix of the proposed SOM based clustering is compared to that of Maximum Likelihood: MLH classification as shown in Table 2.
In particular, bare soil tends to be clustered to water body. This fact can be confirmed in Figure 18.
Fig.15. Relation between separability and iteration number
Fig.16. Density maps and labeling results
Fig.17. The density map and the labeling result image after the SOM learning process is converged.
TABLE II. COMPARISON OF CLUSTERED RESULT BY THE PROPOSED SOM BASED METHOD AND CLASSIFICATION RESULTS BY THE CONVENTIONAL MLH
Fig.18. Clustered result by the proposed SOM based clustering and classified result by the conventional MLH method
IV. CONCLUSION
A new method for image clustering with density maps derived from Self-Organizing Maps (SOM) is proposed together with a clarification of learning processes during a construction of clusters. Simulation studies and the experiments with remote sensing satellite derived imagery data are conducted. It is found that the proposed SOM based image clustering method shows much better clustered result for both simulation and real satellite imagery data. It is also found that the separability among clusters of the proposed method is 16% longer than the existing k-mean clustering. It is also found that the separability among clusters of the proposed method is 16% longer than the existing k-mean clustering. In accordance with the experimental results with Landsat-5 TM image, it takes more than 20000 of iteration for convergence of the SOM learning processes
ACKNOWLEDGMENT
The author would like to thank Mr. Koichi Tateno for his effort to conduct simulation studies and the experiments with Landsat-5 TM data.
REFERENCES
[1] Mikio Takagi and Haruhisa Shimoda Edt. Kohei Arai et al., Image Analysis Handbook, The University of Tokyo Publishing Co. Ltd., 1991.,
[2] Kohei Arai, Fundamental Theory for Image Processing Algorithms, Gakujutu-Tosho-Publishing Co. Ltd., 1999.
[3] Kohei Arai, Fundamental Theory for Pattern Recognitions, Gakujutu-Tosho-Publishing Co. Ltd., 1999.
[4] Kohei Arai, Remote Sensing Satellite Image Processing and Analysis, Morikita Publishing Inc., 2001.
[5] T.Kohonen, Self-Organizing Maps, Springer Series in Information Sciences, Vol.30, 1995; Second edition, 1997; Third, extended edition, 2001.
[6] T.Kohonen, G.Barna and R.Chrisley, Statistical pattern recognition with neural networks: benchmarking studies, Proc. ICNN Vol.I, 61-68, 1988. [7] Kohei Arai, Learning processes of image clustering method with density
maps derived from Self-Organizing Mapping(SOM), Journal of Japan Photogrammetry and Remote Sensing, 43, 5, 62-67, 2004.
[8] Kohei Arai, XiangQiang Bu, Pursuit Rainforcement Learning based on-line clustering for image retrievals, Journal of Image Electronics and Engineering Society of Japan, 39,3,301-309,2010
[9] Kohei Arai, XiangQiang Bu, Pursuit Rainforcement Learning based on-line clustering with learning automaton for rescue simulations and its accerelation of convergence of learning processes, Journal of Image Electronics and Engineering Society of Japan, 40, 2, 361-168, 2011. [10] Jouko Lampinen and Timo Kostiainen, Generative probability density
model in the Self-Organizing Map. In U. Seiffert and L. Jain, editors,
Self-organizing neural networks: Recent advances and applications.
pages 75-94. Physica Verlag, 2002..
AUTHORS PROFILE