On the Misapplication of Cybernetics to Sensory
Neurons: Norwich’s Informational Entropy
Theory of Perception Has Not Derived
Stevens’ Law for Taste
Lance Nizami
, Member, IAENGAbstract—Norwich’s Entropy Theory of Perception reveals a startling conclusion: that Stevens’ Law with an Index of 1, a power function stating direct proportionality between perceived taste intensity and stimulus concentration, arises purely from theory. Norwich’s theorizing starts with extraordinary hypotheses. First, “multiple, parallel receptor-neuron units” without collaterals “carry essentially the same message to the brain”, i.e. the rate-level curves are identical. Second, sensation is proportional to firing rate. Third, firing rate is proportional to the taste receptor’s “resolvable uncertainty”. Fourth, the “resolvable uncertainty” is obtained from Shannon’s Information Theory. Finally, “resolvable uncertainty” also depends upon the microscopic thermodynamic density fluctuation of the tasted solute. Norwich proves that density fluctuation is density variance, which is proportional to solute concentration, all based on the theory of fluctuations in fluid composition in Tolman’s “The Principles of Statistical Mechanics”. Altogether, perceived taste intensity is theoretically proportional to solute concentration. Now, a universal rule for taste, one independent of solute identity, physiological differences, and psychophysical task, is well-deserving of scrutiny. Norwich’s crucial step, the derivation of density variance, was meticulously reconstructed. It transpires that the appropriate fluctuation is Tolman’s mean-square fractional density fluctuation, not the density variance, altogether giving a “Stevens Index” of -1 rather than 1. Thus, Norwich’s Entropy Theory of Perception has not derived Stevens’ Law for taste. Norwich’s mistake reveals the dangers of implying psychophysical laws from information theory and stimulus physics without accounting for sensory transduction.
Index Terms—fluctuation, information theory, statistical mechanics, Stevens’ Law, taste.
I. INTRODUCTION: THE ENTROPY THEORY OF PERCEPTION
The Entropy Theory of Perception of Professor K.H. Norwich derives from 1958 (see [1]) but was not published until 1975, as a proceeding [2]. Norwich and co-authors subsequently devoted several proceedings, a book, and many peer-reviewed publications to their theory. Two papers dealt
exclusively with taste [3], [4]; the first, its details heavily used in the second, was recently synopsized in Chemical
Senses [5, p. 1019] as follows: “It was shown (Norwich,
1984) that if the magnitude of taste were equated to a general ‘entropy’ or uncertainty, governed by an unspecified probability density function, one could then derive from this single definition many of the empirically discovered sensory laws governing taste: both laws of sensation (Fechner’s and Stevens’s), the general function for Weber fraction [sic], the adaptation function for taste, etc.”.
Manuscript received March 3, 2009. Work supported by the author. L. Nizami is presently an Independent Research Scholar in Decatur, GA (404-299-5530; e-mail: [email protected]). Research commenced at Dept. of Psychology, University of Toronto in Mississauga, 3359 Mississauga Rd. N., Mississauga, ON, Canada, and continued at Center for Hearing Research, Boys Town National Research Hospital, Omaha, NE 68131, USA.
The Entropy Theory depends upon several broad hypotheses. One is that sensation is directly proportional to primary afferent firing rate, such that both obey an equation of the same algebraic form, the Entropy Equation [1], [4], [6], [7], [8], [9], [10]:
.
1
m
where
,
m
1
n
k
F
2 R 2 S
≥
⎟
⎟
⎠
⎞
⎜
⎜
⎝
⎛
+
=
σ
σ
l
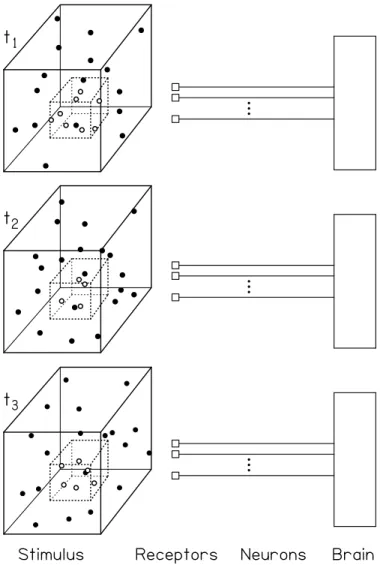
(1)k is a constant, m is the number of samples taken of the stimulus by the receptor, is the “signal” (stimulus) variance and is the variance of a hypothesized reference noise. k, m, and are all unknown. Another crucial hypothesis was that “multiple, parallel receptor-neuron units” without collaterals [11] “carry essentially the same message to the brain” [12, p. 414], [3], [4], [11], [13]. A third crucial hypothesis was expressed thus for taste: primary afferent neurons respond when the sensory receptor samples “fluctuations in the local density of solute” [3, p. 273] for “a dilute solution held without flow in contact with the tongue” [3, p273]. Microscopically the solute molecules move randomly, causing moment-by-moment changes in solute “concentration” [14]. Similarly, the olfactory receptor samples a gas’s density; the samples reflect the fluctuations of molecule density [15], [16]. Fig. 1 illustrates these concepts.
2 S
σ
2R
σ
2 R
σ
Regarding the fluctuating stimulus, the “signal”, Norwich et al. hypothesized that “signal variance” σ2
was related to “signal mean” through constants and n as
0
n
,
unknowns
where
n
2
=
λ
μ
λ
>
Fig. 1. The Entropy Theory concept of the physiological response to a stimulus. This figure combines elements of Fig. 3 of [12] and Fig. 2 of [20]. The stimulus is macroscopically constant, here represented by always having the same number of particles (25) within the larger box. The larger box encloses the smaller box, within which the number of particles fluctuates in thermodynamic equilibrium with the surrounding “reservoir” of particles. Here, the number of particles within the smaller box varies, from 8 at time t1, to 4 at the later time t2, to 6 at the yet later time t3. At each of
these instants, parallel, identical receptor-neuron units sample, without error, the contents of the smaller box. Each neuron thus conveys the same smaller-box particle count to the brain.
(e.g. [3], [4], [6], [12], [13], [17], [18], [19], [20]). Norwich [3, p273] called n “the exponent in Stevens’s [sic] power law”. This purported equivalence was claimed for all sensory modalities and is ubiquitous across the Entropy Theory papers [1], [3], [4], [7], [11], [12], [13], [18], [19], [20], [21], [22], [23], [24], [25], [26], [27]. For example, Norwich et al. [11, p. 353], speaking of all sensory modalities, stated that “It transpires that the exponent, n, is precisely the Stevens exponent that appears in the law of sensation [Stevens’ law]”. That is, again for all sensory modalities, “The parameter, n, has been shown in previous work to be equivalent to the power function exponent thoroughly examined experimentally by Stevens and others” [6, p169]. Usually, n could only be obtained by fitting the Entropy Equation to sensations, or to firing rates, as a function of stimulus intensity. But Norwich [3] demonstrated a remarkable breakthrough: a value for n for gustation that was derived from pure theory. That is, using statistical mechanics, Norwich showed that for a solute, the physical fluctuations in
local density (the stimulus “intensity variance” σ2
) is related to the stimulus intensity as [3, p. 270]. Norwich concluded that “to a first approximation, the Stevens index for the sense of taste is 1.0” [3, p. 273].
μ
∝
σ
2II. THE STIMULUS VARIANCE FOR TASTE
Derivation of a Stevens’ index purely from theory represents an unprecedented breakthrough that deserves scrutiny in its own right. Towards that end, Norwich’s algebra (from p273 of [3] unless stated otherwise) is first introduced. A Supplementary Appendix was prepared (available on demand from the author) in order to provide some proofs in a linear progression not used by Norwich, and to provide several steps that he omitted.
density variance. Norwich used R for the gas constant, T for the absolute temperature,
μ
for the chemical potential, and N for the number of moles of a substance within an assumed volume V. “The mean number of molecules present in some volume of solvent” was calledν
. Using these particular symbols, Norwich [3, Eq. (16)] rewrote an equation of Tolman [28, Eq. (141.43)] for the fluctuation in the amount of a component i in an open multicomponent fluid system at equilibrium. Norwich’s version was.
N
N
T
R
2⎟⎟
⎠
⎞
⎜⎜
⎝
⎛
∂
∂
=
μ
ν
σ
ν (3)Norwich called this the relation between “the mean solute density or concentration” and the density variance. Norwich then showed that theoretically
.
T
R
N
N
p , V , T=
⎟⎟
⎠
⎞
⎜⎜
⎝
⎛
∂
∂
μ
(4)Substituting this into (3) gives
σ
2=
ν
. For in (2) Norwich substituted the letter “c”. Norwich then relatedν
to c asν
∝
c
. Altogether, . Norwich then concluded that “making use of the relationship(Norwich, 1977), we can now set n = 1”. This was substituted into the Entropy Equation, yielding the Weber-Fechner Law and equations of the Weber fraction and the adaptation curve.
c
2∝
σ
n 2μ
σ
∝
III. NORWICH’S MISTAKE (THOUGHT EXERCISE) Norwich’s conclusion hinges on the notion that density variance is the correct measure of the fluctuation in the density of a solute in a solvent. But is it? Consider a small volume v of solvent. Imagine no solute molecules in v, only solvent molecules. Now place a single solute molecule in v. What happens if we add one other solute molecule? A receptor measuring the number of solute molecules in v sees a doubling of their number, and a doubling of their density (molecules per volume). Now empty the solvent of all solute molecules, and start afresh. Introduce 1,000 solute molecules into v. Now add one more new solute molecule. The change
in the number of solute molecules is 1 as above, but the
change in their density drops to just 0.1%. That is, a receptor
now sees a negligible change in solute density.
Thus, the proper measure of density fluctuation is the fractional (“percentage”) density change. Tolman [28] recognized this, preferring to express the fractional density change as the mean-square fractional fluctuation in density. Ironically, Norwich’s proof of n = 1 depended on Tolman’s algebra. Thus by reviewing that algebra we may discover Norwich’s line of thinking. We start with equations from Tolman [28]. Tolman’s notation was used, to maintain tradition and to illustrate what Norwich himself dealt with.
IV. THE MEAN-SQUARE FRACTIONAL (“PERCENTAGE”)
FLUCTUATION IN THE DENSITY OF A SINGLE PURE FLUID
Double overhead bars represent mean values; the subscript i represents the ith component of a mixture. The number of molecules in the given volume of the ith component of the mixture was ni (rather than Norwich’s ). For the chemical
potential, Tolman uses rather than Norwich’s
μ
. Tolman [28] treated a mixture of liquids as a mixture of perfect gases, and thus obtained the mean-square fractional particle-number fluctuation: i 2 i 2 i in
1
n
n
n
=
⎟
⎠
⎞
⎜
⎝
⎛
−
(5)[28, Eq. (141.45)]. Tolman [28, p645] subsequently dealt with fluctuations in the density of a single pure fluid, which also applies to a dilute solute in a solvent. Tolman treated the fluid as a “multi-component” system having just one component. That is, Tolman imagined the dilute solute as a “gas”. Equation (5) was derived using the statistical-mechanical notion of the grand canonical ensemble, and he invoked that concept again: “For this purpose let us consider a small portion of the fluid, located in some specified volume v, and containing in the mean
n
molecules, and let us treat this as being an ‘open’ thermodynamic system which is in equilibrium with the rest of the fluid which serves as a large reservoir for accommodating fluctuations in the amount of fluid in the specified volume” [28, p. 645]. Hence omitting the subscript from (5) yields the equation for the mean-square fractional fluctuation in the number of solute molecules in the solvent.Tolman then related molecule-number fluctuation to density fluctuation as follows. Here, Tolman broke from his own notational habits; instead of using ρ for the density within v and
ρ
for its mean value, he used ρ for the mean and Δρ for deviations from it. Here we will use ρ andρ
for consistency with n andn
. Now ρ can change due to the free movement of molecules in and out of v, as allowed in the grand canonical ensemble. The mean-square fractional (or “percentage”) density fluctuation within v is.
2 2 2 2 2ρ
σ
ρ
ρ
ρ
ρ
ρ
ρ
ρ=
⎟
⎠
⎞
⎜
⎝
⎛ −
=
⎟
⎟
⎠
⎞
⎜
⎜
⎝
⎛ −
(6)Now, with NA as Avogadro’s number of molecules per mole,
.
volume
unit
/
moles
v
N
n
volume
unit
/
molecules
v
n
A=
=
ρ
(7b)Substituting terms having the same units into (6) yields the unitless relation
.
n
n
n
2 2 2 2⎟
⎠
⎞
⎜
⎝
⎛ −
=
⎟
⎠
⎞
⎜
⎝
⎛ −
ρ
ρ
ρ
(8)The right-hand side of (8) is the left-hand side of (5) with the subscript “i” omitted. Thus altogether
n
1
2 2=
⎟
⎠
⎞
⎜
⎝
⎛ −
ρ
ρ
ρ
(9)(in [28] as Eq. (141.60)). That is, the mean-square fractional (“percentage”) fluctuation in the solute density within a small volume v of a fluid equals the inverse of the mean number of molecules
n
in v. In contrast, for the density fluctuation alone, (6), (7a), and (9) lead to,
v
n
,
n
2 2 22
=
∴
=
ρ
ρ
σ
ρ
σ
(10)that is, density fluctuation alone is proportional to the mean number of molecules
n
in v.V. NORWICH’S MISTAKE (SUMMARY)
Equation (10) resembles Norwich’s [3] equation
ν
σ
2=
. To get the latter, Norwich had started with Tolman’s theoretical particle-number variance [28, Eq. (141.43)], which is
,
N
N
T
R
n
n
n
p , V , T i i i i 2 i i 2 ni⎟⎟
⎠
⎞
⎜⎜
⎝
⎛
∂
∂
=
⎟
⎠
⎞
⎜
⎝
⎛
−
=
μ
σ
(11)and then replaced
n
i by its Norwich equivalent,ν
. He also abandonedρ
in favour of its equivalent, c, the solute concentration (7b). Norwich described (11) as the relation between “the mean solute density or concentration” and the magnitude of the fluctuations in the local density of solute.Thus, Norwich assumed that variance is the fluctuation measure for density. But, as Tolman noted, the appropriate fluctuation measure is the mean-square fractional fluctuation. Norwich then assumed that
ν
∝
c
. That step is correct; for a small volume v, we havec
=
ν
/
N
Av
moles/unit-volume,a density. But Norwich thenequated variance in the number
of solute molecules present in some volume of solvent (11) to the variance in the density of the solution. However, as demonstrated above, number variance and density variance are not equal; number variance is independent of volume, whereas density variance is not, because density itself is number per volume. Norwich’s equating of number variance to density variance, along with his failure to use mean-square fractional fluctuation as the proper fluctuation measure for density, actually adds up to two fatal errors - each of which separately renders Norwich’s proof invalid. Norwich even made a third, conceptual, error: he equated variance in molecule number to variance in concentration, a quantity that is actually unvarying thanks to its definition as the [ensemble] mean of the density of the solution, a definition that Norwich himself had noted!
VI
.
CONCLUSIONSIn what Norwich et al. called the “informational theory of neural coding” [11, p. 348], “multiple, parallel receptor-neuron units” without collaterals “carry essentially the same message to the brain” [4], [12] and sensation is proportional to primary afferent firing rate. Norwich’s primary evidence for his theory was his derivation of an exponent of 1.0 for Stevens’ Law for taste from the statistical mechanics of gases and fluids [3]. Unfortunately, Norwich’s derivation was demonstrably wrong; he used density variance for density fluctuation, instead of the correct expression, mean-square fractional density fluctuation. Using the correct expression makes Norwich’s alleged “Stevens’ exponent” equal to -1. Thus there is serious doubt about whether Norwich’s so-called “Stevens’ exponent” has any relation to the empirical one. These errors reveal the pitfalls of trying to relate psychophysical laws of sensory response to statistical properties of the stimuli through cybernetics arguments without accounting for neuronal transduction.
.
REFERENCES
[1] K.H. Norwich, Information, Sensation, and Perception. Toronto: Academic Press, 1993.
[2] K.H. Norwich, “Information, memory, and perception,” Inst. Biomed. Eng. U. Toronto 17, 1975.
[3] K.H. Norwich, “The psychophysics of taste from the entropy of the stimulus,” Percept. Psychophys. 35, 1984, pp. 269-278.
[4] K.H. Norwich, “Toward the unification of the laws of sensation: some food for thought,” in Sensory Science Theory and Applications in Foods, H.T. Lawless and B.P. Klein, Eds. New York: Marcel Dekker Inc., 1991, pp. 151-183.
[5] K.H. Norwich, “Determination of saltiness from the laws of thermodynamics - estimating the gas constant from psychophysical experiments,” Chem. Senses 26, 2001, pp. 1015-1022.
[6] K.M.V. McConville, K.H. Norwich, and S.M. Abel, “Application of the entropy theory of perception to auditory intensity discrimination,”
[7] K.H. Norwich, “The Fechner-Stevens law is the law of transmission of information,” Behav. Brain Sci. 12, 1989, p. 285.
[8] K.H. Norwich, “On the fundamental nature of perception,” Acta Biotheo. 39, 1991, pp. 81-90.
[9] K.H. Norwich, “The psychophysical response is equal to the potential stimulus information,” Proc. 7th Ann. Meet. Int. Soc. Psychophys.
Durham, North Carolina, 1991, pp. 15-19.
[10] K.H. Norwich, “ Physical entropy and the senses,” Acta Biotheo. 53, 2005, pp. 167-180.
[11] K.H. Norwich, C.N.L. Seburn, and E. Axelrad, “An informational approach to reaction times,” Bull. Math. Biol. 51, 1989, pp. 347-358. [12] K.H. Norwich, “The magical number seven: making a “bit” of
“sense”,”.Percept. Psychophys. 29, 1981, pp. 409-422.
[13] K.H. Norwich and W. Wong, “A universal model of single-unit sensory receptor action,” Math. Biosci. 125, 1995, pp. 83-108.
[14] K.H. Norwich, “Do sensory receptors express their state of certitude?”
Psychon. Soc. Abst. 25, 1984, p. 24.
[15] K.H. Norwich, “Why the eye may be found to be a source of light,” 6th
Int. Cong. Cyb. Syst., World Org. Gen. Syst. Cyb., Proc. vol. 2. 1984, pp. 831-836.
[16] K.H. Norwich and W. Wong, “Sensory function in extraterrestrial beings,” Ann. Fond. Louis de Broglie 22, 1997, pp. 161-168. [17] K.H. Norwich, “An hypothesis on the processing of information by
sensory receptors,” Dig. 11th Int. Conf. Med. Biol. Eng., Ottawa, 1976, pp. 610-611.
[18] K.H. Norwich, “On the information received by sensory receptors,”
Bull. Math. Biol. 39, 1977, pp. 453-461.
[19] K.H. Norwich, “An hypothesis on information, memory, and perception,” Med. Hyp. 4, 1978, pp. 156-164.
[20] K.H. Norwich, “On the theory of Weber fractions,” Percept. Psychophys. 42, 1987, pp. 286-298.
[21] K.H. Norwich, “Perception as an active process,” Math. Comput. Sim.
24, 1982, pp. 535-539.
[22] K.H. Norwich, “To perceive is to doubt: the relativity of perception,” J. Theo. Biol. 102, 1983, pp. 175-190.
[23] K.H. Norwich and K.M.V. McConville, “An informational approach to sensory adaptation,” J. Comp. Physiol. A168, 1991, pp. 151-157. [24] K.H. Norwich and W. Wong, “Unification of psychophysical
phenomena: the complete form of Fechner’s law,” Percept. Psychophys. 59, 1997, pp. 929-940.
[25] W. Wong and K.H. Norwich, “Obtaining equal loudness contours from Weber fractions,” J. Acoust. Soc. Am. 97, 1995, pp. 3761-3767. [26] W. Wong and K.H. Norwich, “Weber fraction and reaction time from
the neural entropy,” Proc. 12th Ann. Meet. Int. Soc. Psychophys.,
Padua, Italy, 1996, pp. 429-434.
[27] K.H. Norwich and E. Sagi, “Deriving the loudness exponent from categorical judgments,” Percept. Psychophys. 64, 2002, pp. 804-814. [28] R.C. Tolman, The Principles of Statistical Mechanics. Toronto: Oxford