Capital mobility in the panel GMM framework:
Evidence from EU members
Natalya Ketenci* Abstract
This paper examines the level of international capital mobility in European Union members under the Feldstein and Horioka (1980) hypothesis. The validity of the Feldstein-Horioka puzzle is investigated taking into account the impact of the global financial crisis employing the generalized method of moments (GMM) estimation technique developed by Hansen (1982). In general, the world countries with time have a tendency to a higher level of capital market openness. According to Feldstein and Horioka (1980), a higher saving-investment correlation is related to lower capital mobility. In this paper, panel data for 27 European countries were used for the period of 1995-2013 on the quarterly basis. The empirical results provide evidence of high capital mobility in EU members, obtaining a low value of a saving retention coefficient. The results of estimations indicate significant dependence of investments on its past values. It is found that the global financial crisis had a deeply negative impact on investment rates in 2007 and for the general period of 2007-2013. The empirical results indicate that the level of capital mobility increased during the global financial crisis, 2007-2013. Thus decrease in investments and increase in the international capital mobility level of European countries during the period of the global financial crisis of 2007-2013, taking into account high risk in the international market, indicates a reallocation of capital from international to regional markets.
JEL: F32
Keywords: Capital mobility, Feldstein-Horioka puzzle, saving-investment association, generalized method of moments (GMM), EU, panel data.
1. Introduction
Many studies on international capital mobility in the literature have been inspired by the seminal work of Feldstein and Horioka (1980), who examined the level of capital mobility in OECD countries, estimating the following equation:
( )
IYR it =α0 +β( )
SYR it +eit (1)Where IYR is the ratio of gross domestic investment to gross domestic product, SYR is the ratio of the gross domestic savings to the gross domestic product of the country i at period t. Coefficient β, which is known as a saving retention coefficient, measures the degree of capital mobility. High international capital mobility refers to low
* Natalya Ketenci, Department of Economics, Yeditepe University, Kayisdagi, 34755, Istanbul, Turkey. Tel: 0090 2165780581. Fax: 0090 2165780797. E-mail: [email protected]
correlation between investments and saving flows, or the value of β, is supposed to be close to 0. A low level of capital mobility in a country suggests a low correlation between investments and saving flows, or the value of the saving retention coefficient is supposed to be close to 1, indicating the capital immobility of the country. Feldstein and Horioka (1980) found that the value of the saving retention coefficient for developed countries is closer to 1 than to 0 value, illustrating by this international capital immobility in the estimated countries. These controversial results gave start to widespread debates in the economic literature. Numerous studies have provided evidence supporting these results, but other results exist in the literature with a wide array of interpretations.
Various literature reviews were made related to the Feldstein Horioka Puzzle, for example, Tesar (1991), Frankel (1992), Coakley et al. (1998), Obstfeld and Rogoff (2000), and the latest updated literature review by Apergis and Tsoumas (2009). Obstfeld and Rogoff (2000) referred to the findings of Feldstein and Horioka (1980), which are indeed contrary to economic theory, as “the mother of all puzzles.” Frankel (1992) argued that the Feldstein Horioka puzzle is not that surprising as it can be explained by the failure of some form of interest rate parity, for which arguments such as transaction costs and regulations can be made. The author suggested that the high value of the coefficient may be due to the procyclicality of savings and investments. Obstfeld and Rogoff (2000) suggested that the high value of the saving retention coefficient is due to the “home bias” in investor preferences. Apergis and Tsoumas (2009) concluded that the results of the majority of studies support a high correlation between savings and investments, but at a lower level. At the same time, they indicate that most studies do not validate the capital mobility hypothesis.
Most empirical studies with panel data have concentrated on large samples of OECD countries following the work of Feldstein and Horioka (1980) (see, for example, Ho 2002, 2003; Fouquau et al., 2008; Adedeji and Thornton, 2008; Ketenci, 2013), or on smaller samples of OECD countries (Georgopoulos and Hejazi, 2009; Rao et al., 2010; Narayan and Narayan, 2010). Another group of studies narrows its focus to EU countries (for example, Feldstein and Bachetta, 1991; Artis and Byoumi, 1991; Banerjee and Zanghieri, 2003; Telatar et al., 2007; Kollias et al., 2008; Ketenci, 2012).
Ho (2003), for example, employed only a country-size threshold variable for measuring its impact on the saving retention coefficient. The study was conducted for the panel of 23 OECD countries, covering the period from 1961 to 1997. The author provided substantial evidence of the threshold effects of the country size variable on the saving retention coefficient, which can be a partial explanation of Feldstein Horioka Puzzle. Ketenci (2013) estimated the saving retention coefficient for four groups of OECD countries: OECD, EU15, NAFTA, and G7 samples. The results of the study indicated that the saving retention coefficient estimates are sensitive to panel selection. Thus, the high saving retention coefficient was found at the 0.784 level only for the G7 group, while the saving retention coefficients for other groups were detected at lower levels, rejecting the hypothesis of the Feldstein Horioka Puzzle existence.
The degree of capital mobility between EU countries has to be above the capital mobility between OECD countries due to the presence of homogenous institutions, the degree of financial openness, and regulations in the EU. This hypothesis is supported in many studies. For example, Feldstein and Bachetta (1991) and Artis and Byoumi (1991) compared EU and OECD countries in their studies on savings-investment relations and on financial integration. In both studies, the results were in favor of the higher degree of the capital mobility inside the EU than between OECD members. Kollias et al. (2008), in their studies on Feldstein Horioka Puzzle across EU members using the ARDL bounds approach and panel data, illustrated that the savings-retention coefficient for EU15 is 0.148, and that this coefficient increases to 0.157 when Luxemburg is excluded from the panel. Therefore, the estimations of this study provided evidence of high capital mobility in the group of EU members, which contradicts the findings of Feldstein-Horioka (1980) for OECD countries.
Investment and saving flows are exposed to various changes in domestic as well as in world economies. Recently, more authors have started to take into account the presence of structural breaks or regime shifts using different econometric techniques. See, for example, Ozmen and Parmaksiz (2003), Telatar et al. (2007), Mastroyiannis (2007), Kejriwal (2008), Rao et al. (2010), and Ketenci (2012). Ozmen and Parmaksiz (2003), in their capital mobility analysis of the UK, and Mastroyiannis (2007), in his capital mobility analysis of Greece, did not find evidence supporting Feldstein Horioka Puzzle in the presence of structural breaks.
retention coefficients in the literature can be in the misspecification of regression models. Ketenci (2012) employed the Gregory and Hansen (1996) cointegration test in the presence of one structural break and the Johansen cointegration test with dummy variables, located at known points for structural dates. The results of this empirical research illustrated a low level saving retention coefficient estimated in the presence of structural breaks. The results indicate high capital mobility in most of the countries, providing evidence against Feldstein Horioka Puzzle in the European Union countries sample.
This study investigates the degree of capital mobility in EU members using the panel Generalized Method of Moments (GMM) approach and its dynamic model. At the same time, it inquires into the effect of the global financial crisis on capital mobility employing dummy variables for different years and periods of the crisis. In the case of perfect capital mobility, investment depends on the rate of interest; however, the decisions of investors very often depend on experience of previous decades having dynamic nature. The level of international capital mobility is exposed to various changes in domestic as well as in world economies. Particularly the global financial crisis had an impact on developed economies where fluctuations of capital flows are considered to have been one of main reasons for the crisis spread.
This topic has received significant coverage in the literature. See, for example, Baldwin (2009), Fratzscher (2011), Milesi-Ferretti and Tille (2011), and Broner et al. (2013). Broner et al. (2013), for example, argue that gross capital flows are pro-cyclical and follow economic cycles. Particularly gross capital flows significantly decrease during crises, when investors leave foreign markets. The authors found that even though such retrenchments take place during both domestic and global crises, they are much stronger under the effect of global crises.
2. Methodology
2.1 Unit root tests
The GMM estimation framework was developed for strictly stationary data. In order to test the stationarity of panel data, various panel unit root tests were employed. These are four first generation panel unit root tests, the Im, Pesaran, and Shin (IPS) test (Im et al., 2003), Fisher-type tests that employ the Augment Dickey-Fuller (ADF) and the Phillips-Perron (PP) tests (Maddala and Wu, 1999; and Choi, 2001), and Hadri tests (Hadri, 2000). The IPS test is a heterogeneous panel unit root test based on individual ADF tests and proposed by Im et al. (2003) as a solution to the homogeneity issue. It allows for heterogeneity in both the constant and slope terms of the ADF regression. Maddala and Wu (1999) and Choi (2001) proposed an alternative approach employing the Fisher test, which is based on combining the P-values from individual unit root test statistics such as ADF and PP. One of the advantages of the Fisher test is that it does not require a balanced panel. Finally, the Hadri test is a heterogenous panel unit root test that extends the KPSS (Kwiatkowski-Phillips-Schmidt-Shin) test, outlined in Kwiatkowski et al. (1992), to a panel with individual and time effects, as well as deterministic trends, which has as its null hypothesis the stationarity of the series. In addition to discussed tests the second generation panel unit root test was employed, the cross-sectionally augmented IPS (CIPS) test developed by Pesaran (2007). Pesaran extended the IPS test by introducing a common factor to the regression in order to consider correlation between data cross sections. The main difference of second generation panel unit root tests from first generation tests is the consideration of cross-sectional dependencies. Several studies have shown that series size distortions can occur if cross-sectional dependencies are not taken into account (Strauss and Yiğit, 2003; Banerjee et al., 2005; Pesaran, 2007).
2.2 GMM
correlation in the errors exists, it is weak, because “the sequence of the covariances of the disturbances across individuals i and j at time t, given the conditioning set of all time-invariant characteristics of individuals i and j, converges absolutely as N→∞” (p.2). Another drawback of the GMM is that the number of sequential moment conditions in dynamic panel data regressions rises with the availability of the number of time periods. Therefore results of the GMM estimators may be biased by using the large number of moment conditions, even in the case when number of cross sections is large, Bun and Kiviet (2006). Another disadvantage which is commonly discussed in the literature is weak instruments of regressions. Instruments employed in the GMM test are presented by lagged endogenous regressors of a model. However in the case where the panel data are persistent, the employed instruments are weakly correlated with endogenous changes leading to the poor performance of the GMM estimators (Blundell and Bond, 1998; Kruiniger, 2009; Bun and Windmeijer, 2010).
Employing the GMM estimation approach, this study estimates equation 1. Additionally, this study estimates dynamic model, where lagged investment is included as an explanatory variable. The estimated dynamic regression can be written as follows:
( )
IYR it =α0 +α1( )
IYR it−1 +β( )
SYR it +εit (2)International capital flows can be considered as of dynamic nature. Interest rate is not the only determinant of investments. At the same time decisions of investors very often depend on the experience of previous decades. Therefore, the inclusion of past value of investment as an explanatory variable gives opportunity to assess investment and saving relations under the condition of the dynamic behavior of capital flows. The level of international capital mobility is exposed to various changes in domestic as well as world economies. Particularly, the global financial crisis impacted developed economies where fluctuations of capital flows are regarded as one of the main reasons for the spread of the crisis. For example, Fratzscher (2011) analyzes the effect of different drivers on capital flow patterns for a set of 50 advanced and emerging economies during the global financial crisis of 2007-2008. The findings of the paper show that common shocks such as global financial crises have substantial effects on international capital flows. Particularly the global financial crisis triggered a reallocation of capital flows from emerging market economies to advanced economies.
Therefore, in order to estimate the effect of the global financial crisis on investment- savings relations, dummy variables are included in estimated models. Thus equation (1) can be rewritten as follows:
And dynamic model (2) can be rewritten as follows:
( )
IYR it =α0 +α1( )
IYR it−1 +β( )
SYR it +α2Dj +νit (4)where IYR is the ratio of gross domestic investment to gross domestic product, SYR is the ratio of gross domestic savings to the gross domestic product of the country i at period t. Dj is the dummy variable which represents one of estimated periods of the global financial crisis year, where j refers to the crisis period. The purpose of this study is to measure the saving retention coefficient β employing the GMM approach. It is supposed that developed countries have high international capital mobility that refers to low correlation between investments and saving flows. Therefore, it is expected that the value of β is close to 0.
To establish the robustness of the GMM results, alternatively, the Ordinary Least Squares (OLS), the Fully Modified Ordinary Least Squares (FMOLS) and Dynamic Ordinary Least Squares (DOLS) panel estimation techniques were employed. Kao and Chiang (2000) found that the OLS is biased in finite samples for heterogeneous panels, the FMOLS is biased in the homogenous panel, while the DOLS performs better in both heterogeneous and homogenous panels. The DOLS estimator outperforms both the OLS and the FMOLS; however three of them are employed in this study for the comparison reason.
3. Empirical Results
3.1 Unit root tests
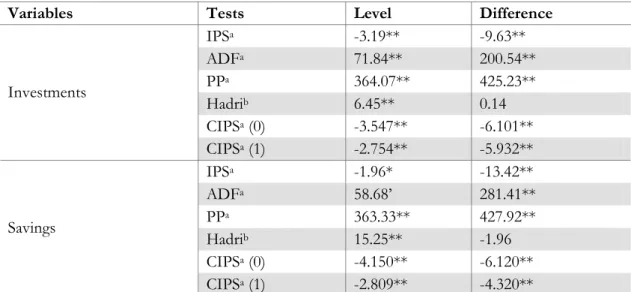
lag and for the one lag cases. In both cases the test statistics rejects the null hypothesis of the CIPS test of the unit root presence. The results of the CIPS test are consistent with the first generation panel unit root tests, IPS, ADF and PP, and support the result on the absence of the unit root in series’ levels and in their first differences. Based on the results of these alternative unit root tests, it is reasonable to conclude that series are generated by a stationary process; therefore, series may be estimated by the GMM approach.
Table 1: Panel Unit Root Tests
Variables Tests Level Difference
IPSa -3.19** -9.63**
ADFa 71.84** 200.54**
PPa 364.07** 425.23**
Hadrib 6.45** 0.14
CIPSa (0) -3.547** -6.101** Investments
CIPSa (1) -2.754** -5.932**
IPSa -1.96* -13.42**
ADFa 58.68’ 281.41**
PPa 363.33** 427.92**
Hadrib 15.25** -1.96
CIPSa (0) -4.150** -6.120** Savings
CIPSa (1) -2.809** -4.320**
Notes: In panel unit root tests, probabilities are computed assuming asymptotic normality. (a) tests the hypothesis of the presence of the individual unit root process, and (b) tests the hypothesis of no unit root in the common unit root process. * and ** denote the rejection of the null hypothesis at the 5 and 1 percent significance level, respectively. Number in brackets of the CIPS test indicates lags allowed in the regression.
3.2 GMM estimations
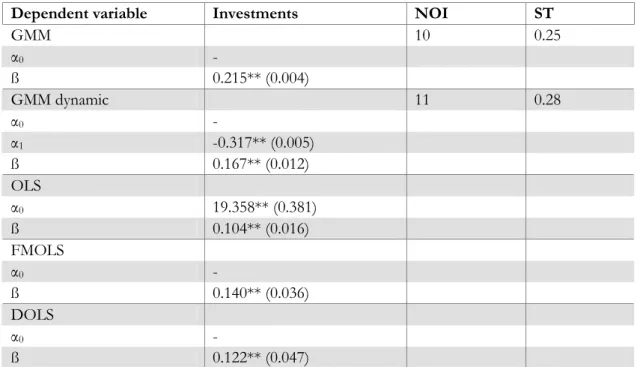
the panel sample, providing evidence for the argument against the Feldstein Horioka Puzzle. The estimation results indicate a significant dependence of investments on its past values. The results of the dynamic estimations provide evidence of the presence of restrictions for capital mobility in terms of the past values of investment flows.
Table 2: GMM Estimations, panel
Dependent variable Investments NOI ST
GMM 10 0.25
α0 -
ß 0.215** (0.004)
GMM dynamic 11 0.28
α0 -
α1 -0.317** (0.005)
ß 0.167** (0.012)
OLS
α0 19.358** (0.381)
ß 0.104** (0.016)
FMOLS
α0 -
ß 0.140** (0.036)
DOLS
α0 -
ß 0.122** (0.047)
Notes: ** and * indicate significance level at 1 and 5 percents, respectively. Standard errors for the coefficient estimates are given in parentheses. Sargan p values are reported. a0, a1 and ß coefficients are from equations 1 and 2. NOI: Number of instruments, ST: Sargan test.
see for example Bienkowski et al. (2014), Choudhry and Jayasekera (2014), . Therefore the period 2007-2013 was evaluated in this study as well.
Figure 1: EU GDP real growth rates.
Source: Eurostat
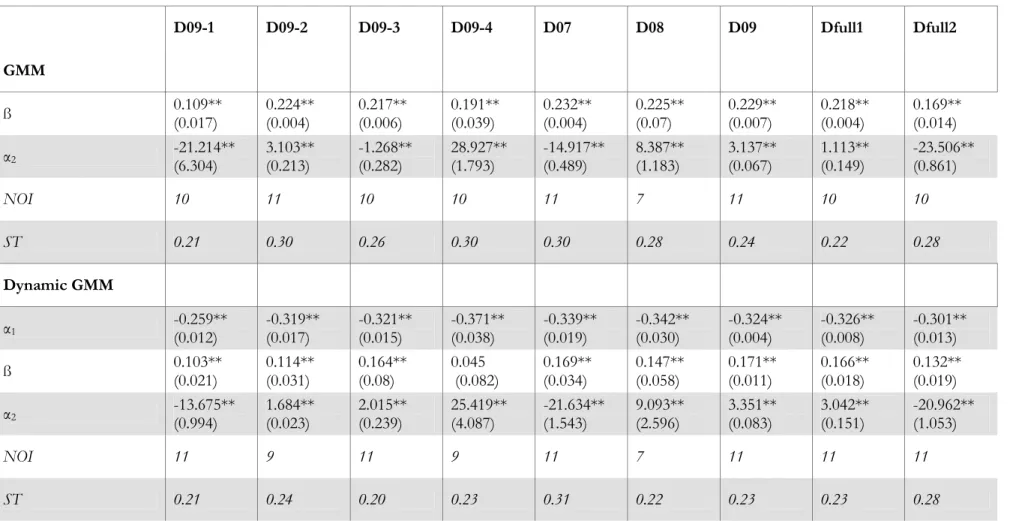
Table 3: GMM Estimations, panel, with the financial crisis dummy variable.
D09-1 D09-2 D09-3 D09-4 D07 D08 D09 Dfull1 Dfull2
GMM
ß 0.109**
(0.017) 0.224** (0.004) 0.217** (0.006) 0.191** (0.039) 0.232** (0.004) 0.225** (0.07) 0.229** (0.007) 0.218** (0.004) 0.169** (0.014)
α2 -21.214**
(6.304) 3.103** (0.213) -1.268** (0.282) 28.927** (1.793) -14.917** (0.489) 8.387** (1.183) 3.137** (0.067) 1.113** (0.149) -23.506** (0.861)
NOI 10 11 10 10 11 7 11 10 10
ST 0.21 0.30 0.26 0.30 0.30 0.28 0.24 0.22 0.28
Dynamic GMM
α1 -0.259**
(0.012) -0.319** (0.017) -0.321** (0.015) -0.371** (0.038) -0.339** (0.019) -0.342** (0.030) -0.324** (0.004) -0.326** (0.008) -0.301** (0.013)
ß 0.103**
(0.021) 0.114** (0.031) 0.164** (0.08) 0.045 (0.082) 0.169** (0.034) 0.147** (0.058) 0.171** (0.011) 0.166** (0.018) 0.132** (0.019)
α2 -13.675**
(0.994) 1.684** (0.023) 2.015** (0.239) 25.419** (4.087) -21.634** (1.543) 9.093** (2.596) 3.351** (0.083) 3.042** (0.151) -20.962** (1.053)
NOI 11 9 11 9 11 7 11 11 11
ST 0.21 0.24 0.20 0.23 0.31 0.22 0.23 0.23 0.28
The estimations of the dynamic panel GMM method provided a negative sign for dummy variables in the first quarter, while in next consequent quarters the coefficient of the dummy variable was found positive. The estimations results illustrate the deeply negative impact of the global financial crisis on investment rates in the first quarter followed by a strong recovery, particularly in the fourth quarter. The dynamic panel GMM estimations results are in line with the standard GMM estimation results for individual years, and crisis periods dummies. Thus estimations for dummies of individual years illustrate a significant drop in investment rate in 2007, followed by increase in 2008 and 2009. Similar to the standard GMM estimations the dynamic panel estimations detected positive but not high effect of the period 2007-2009 on investment rate and strong negative effect of period 2007-2013.
The estimation results of the panel sample illustrate the presence of the effect of the inclusion of dummy variables on capital mobility level. In both the GMM and the dynamic GMM estimations, the saving retention coefficient was found to be at a lower level in the first quarter of 2009 compared to the estimations without dummies. In both models, the saving retention coefficient was found to be at a higher level in the consequent three quarters. The estimation results for individual years’ dummies do not demonstrate divergence between saving retention coefficients indicating on similar level of capital mobility throughout these years. However inclusion of two crisis dummies reveals lower level of the saving retention coefficient for period 2007-2013 compared to period 2007-2009. These results illustrate the higher level of capital mobility for the period 2007-2013 compared to period 2007-2009. Thus the GMM estimations revealed high level of capital mobility in the EU member countries which contradicts to the Feldstein Horioka Puzzle. The consideration of dynamic nature of capital flows in estimations provided lower level of the saving-retention coefficients in all different regressions, indicating on an even higher level of capital mobility.
4. Conclusion
This paper investigated the level of international capital flows in the panel sample of the EU27 members except Greece, Ireland, Malta, and Romania. Estimations were made for the period from 1995 to the end of 2013 on the quarterly basis. The study applied the GMM framework developed by Hansen (1982). In order to examine effect of the global financial crisis on the level of capital mobility in the selected country sample, dummy variables were employed for crisis periods.
of the previous quarters play a significant part in determining current capital flows and obstruct the level of perfect capital mobility.
In order to investigate the impact of the global financial crisis on the capital mobility in the EU member countries dummy variables for different years and periods of the recent global financial crisis were employed. The estimated coefficients for dummy variables were represented by α2 coefficients in Table 3. The coefficients of the dummy variables were found highly significant, indicating the presence of an effect of the global financial crisis on the level of capital mobility in the selected panel. The results of the estimates of dummy coefficients in the GMM model reveal a significant decrease in investment rates in 2007 with consequent increase in following two estimated years. Additionally estimations illustrated deep decline in investment rates during period 2007-2013. The estimations of the dynamic panel for the GMM approach provided results similar to those of the GMM model, illustrating the deeply negative impact of the global financial crisis on investment rates for the year 2007 and for the extended estimated period 2007-2013, while period 2007-2009, which is characterized by deterioration of the EU’s GDP, was estimated with slight positive effect on investment rates.
The estimation results of the saving retention coefficient indicated that the level of capital mobility was higher in the first quarter of year 2009 compare to following three quarters. Level of capital mobility during years 2007, 2008 and 2009 was staying almost at the same level, however period 2007-2013 is characterized by higher level of capital mobility. At the same time estimations for dummy variable of the period 2007-2013 illustrate significant decline in investment rate for this period and at the same time increase in capital mobility. Increase in capital mobility and decrease in investments rate during the crisis period may indicate on capital repatriation that is related to high level of risk in the international market. The global financial crisis induced investors to move away from high-risk projects to safer assets, decreasing interest in new foreign direct investments abroad (Poulsen and Hufbauer, 2011). For example, Fratzscher (2011) states that the global financial crisis triggered a reallocation of capital flows from emerging market economies to advanced economies. Even after detecting the negative impact of the global financial crisis on the capital mobility of the European countries, the results of this study still illustrate a high level of capital mobility, rejecting in this way the presence of the Feldstein-Horioka Puzzle hypothesis in the European countries.
References
Adedeji O., Thornton J. (2008), ‘International capital mobility: Evidence from panel cointegration tests’, Economics Letters, 99, 349-352.
Apergis N., Tsoumas C. (2009), ‘A survey on the Feldstein Horioka puzzle: What has been done and where we stand’, Research in Economics, 63, 64-76.
Artis M., Bayoumi T. (1991), ‘Global financial integration and current account imbalances’, in Alogoskoufis G., Papademos L. and Portes R. (eds.), External constraints on Macroeconomic Policy: The European Experience, Cambridge University Press, Cambridge.
Baldwin R. (2009), ‘The Great Trade Collapse: What Caused it and What does it mean?’, in Baldwin R. (ed.), The Great Trade Collapse: Causes, Consequences, and Prospects, Voxeu E book. Banerjee A., Zanghieri P. (2003), ‘A new look at the Feldstein-Horioka puzzle using an
integrated panel’, CEPII Working Paper, 22.
Banerjee A., Marcellino M., Osbat C. (2005), ‘Testing for PPP: Should we use panel methods?’,
Empirical Economics, 30, 77–91.
Bienkowski W., Gawronska-Nowak B., Grabowski W. (2014), ‘Comovements of stock markets in the CEE-3 countries during the global financial crisis’, Eastern European Economics, 52(5), 32-55.
Blundell R., Bond S. (1998), ‘Initial conditions and moment restrictions in dynamic panel data models’, Journal of Econometrics, 87, 115-143.
Broner F. et al. (2013), ‘Gross capital flows: Dynamics and crises’, Journal of Monetary Economics,
60, 113-133.
Bun M.J.G., Kiviet J.F. (2006), ‘The effects of dynamic feedbacks on LS and MM estimator accuracy in panel data models’, Journal of Econometrics, 132, 409-444.
Bun M.J.G., Windmeijer F. (2010), ‘The weak instrument problem of the system GMM estimator in dynamic panel data models’, Econometrics Journal, 13, 95-126.
Choi I. (2001), ‘Unit Root Tests for Panel Data’, Journal of International Money and Finance, 20, 249-272.
Choudhry T., Jayasekera R. (2014), ‘Market efficiency during the global financial crisis: Empirical evidence from European banks’, Journal of International Money and Finance,49(B), 299-318.
Chudik A., Fratzscher M. (2011), ‘Identifying the global transmission of the 2007-2009 fnancial crisis in a GVAR model’, European Economic Review, 55(3), 325-339.
Coakley J., Kulasi F., Smith R. (1998), ‘The Feldstein-Horioka puzzle and capital mobility: A review’, International Journal of Finance and Economics, 3, 169-188.
Elliot G., Rothenberg T.J., Stock J.H. (1996), ‘Efficient Tests for an Autoregressive Unit Root’,
Econometrica, 64, 813-836.
Kruiniger H. (2009), ‘GMM estimation and inference in dynamic panel data models with persistent data’, Econometric Theory, 25, 1348-1391.
Levin A., Lin C.F., Chu C.S.J. (2002), ‘Unit root tests in panel data: Asymptotic and finite-sample properties’, Journal of Econometric,108(1), 1-24.
Feldstein M., Bachetta P. (1991), ‘National saving and international investment’, in Bernheim D. and Shoven, J. (eds.), National Saving and Economic Performance, The University of Chicago Press. Feldstein M., Horioka C. (1980), ‘Domestic saving and international capital flows’, Economic
Journal, 90, 314–329.
Frankel J. A. (1992), ‘Measuring international capital mobility – A review’, American Economic Review,82, 197-202.
Fratzscher M. (2011), ‘Capital flows, push versus pull factors and the global financial crisis’,
Working Paper Series, 1364, July. European Central Bank.
Fouquau J., Hurlin C., Rabaud I. (2008), ‘The Feldstein-Horioka puzzle: A panel smooth transition regression approach’, Economic Modelling, 25, 284-299.
Georgopoulos G., Hejazi W. (2009), ‘The Feldstein–Horioka puzzle revisited: Is the home-bias much less?’ International Review of Economics & Finance, 18(2), 341-350.
González A., Teräsvirta T., van Dijk D. (2005), ‘Panel smooth transition regression model’,
Working Paper Series in Economics and Finance, 604.
Gregory A.W., Hansen B.E. (1996), ‘Tests for cointegration in models with trend and regime shifts’, Oxford Bulletin for Economics and Statistics, 58(3), 555-560.
Hadri K. (2000), ‘Testing for stationarity in heterogenous panel data’, Econometrics Journal, 3(2), 148-161.
Ho T.W. (2002), ‘The Feldstein-Horioka puzzle revisited’, Journal of International Money and Finance, 21, 555-564.
Ho T.W. (2003), ‘The saving-retention coefficient and country-size: The Feldstein-Horioka puzzle reconsidered’, Journal of Macroeconomics,25, 387-396.
Kejriwal M. (2008), ‘Cointegration with structural breaks: An application to the Feldstein-Horioka puzzle’, Studies in Nonlinear Dynamics and Econometrics, 12(1),article 3.
Ketenci N. (2012), ‘The Feldstein –Horioka Puzzle and Structural Breaks: Evidence from EU Members’, Economic Modelling, 29(2), 262-270.
Ketenci N. (2013), ‘The Feldstein-Horioka Puzzle in groupings of OECD members: a panel approach’, Research in Economics, 67(1), March, 76-87.
Kollias C., Mylonidis N., Paleologou S.M. (2008), ‘The Feldstein-Horioka puzzle across EU members: Evidence from the ARDL bounds approach and panel data’, International Review of Economics and Finance, 17, 380-387.
Kwiatkowski D., Phillips P.C.B, Schmidt P., Shin Y. (1992), ‘Testing the null hypothesis of stationarity against the alternative of a unit root: How sure are we that economic time series have a unit root?’, Journal of Econometrics, 44, 159-178.
Maddala G.S., Wu S. (1999), ‘A comparative study of unit root tests with panel data and a new simple test’, Oxford Bulletin of Economics and Statistics, 61, 631–652.
Miles-Ferretti G.M., Tille C. (2011), ‘The great retrenchment: international capital flows during the global financial crisis’, Economic Policy, 26(66), 289-346.
Narayan P.K., Narayan S. (2010), ‘Testing for capital mobility: New evidence from a panel of G7 countries’, Research in International Business and Finance, 24(1), 15-23.
Obstfeld M., Rogoff K. (2000), ‘The six major puzzles in international macroeconomics: is there a common cause?’ NBER Macroeconomics Annual, 15, 340–390.
Ozmen E., Parmaksız K. (2003), ‘Policy regime change and the Feldstein-Horioka puzzle: the UK evidence’, Journal of Policy Modeling,25, 137-149.
Poulsen L. S., Hufbauer G.C. (2011), ‘Foreign direct investment in times of crisis’, Working Paper Series, WP 11-3, Peterson Institute for International Economics, Washington.
Pesaran M.H. (2007), ‘A simple panel unit root test in the presence of cross-section dependence’, Journal of Applied Econometrics, 22, 265-312.
Rao B.B., Tamazian A., Kumar, S. (2010), ‘Systems GMM estimates of the Feldstein–Horioka puzzle for the OECD countries and tests for structural breaks’, Economic Modelling, 27, 1269-1273.
Said S.E., Dickey D.A. (1984), ‘Testing for unit roots in autoregressive – moving average model of unknown order’, Biometrica,71, 599-608.
Sarafidis V. (2009), ‘GMM estimation of short dynamic panel data models with error cross-sectional dependence’, REPEC.
Strauss J., Yigit T. (2003), ‘Shortfalls of panel unit root testing’, Economics Letters, 81, 309-313. Telatar E., Telatar F., Bolatoglu N. (2007), ‘A regime switching approach to the
Feldstein-Horioka puzzle: Evidence from some European countries’, Journal of Policy Modeling,29(3), 523-533.
Tesar L.L. (1991), ‘Saving, investment and international capital flows’, Journal of International Economics,31, 55–78.