* Corresponding author Tel.: +919416467609 E-mail: [email protected] (P. Kumar) © 2017 Growing Science Ltd. All rights reserved. doi: 10.5267/j.ijiec.2017.1.002
International Journal of Industrial Engineering Computations 8 (2017) 303–314
Contents lists available at GrowingScience
International Journal of Industrial Engineering Computations
homepage: www.GrowingScience.com/ijiec
Performance analysis and optimization for CSDGB filling system of a beverage plant
using particle swarm optimization
Parveen Kumara* and P.C. Tewarib
aResearcher, Department of Mechanical Engineering, National Institute of Technology, Kurukshetra, Haryana, 136119, India bProfessor, Department of Mechanical Engineering, National Institute of Technology, Kurukshetra, Haryana, 136119, India C H R O N I C L E A B S T R A C T
Article history:
Received September 2 2016 Received in Revised Format October 28 2016
Accepted January 7 2017 Available online January 7 2017
The paper deals with the performance analysis and optimization for Carbonated Soft Drink Glass Bottle (CSDGB) filling system of a beverage plant using Particle Swarm Optimization (PSO) approach. The CSDGB system consists of seven main subsystems arranged in series namely Uncaser, Bottle Washer, Electronic Inspection Station, Filling Machine, Crowner, Coding Machine and Case Packer. Considering exponential distribution for probable failures and repairs, mathematical modeling is performed using Markov Approach (MA). The differential equations have been derived on the basis of probabilistic approach using transition diagram. These equations are solved using normalizing condition and recursive method to drive out the steady state availability expression of the system i.e. system’s performance criterion. The performance optimization of system has been carried out by varying the number of particles and number of generations. It has been observed that the maximum availability of 90.27% is achieved at flock size of 55 and 90.84% at 300th generation. Thus, findings of the paper will be useful to the plant
management for execution of proper maintenance decisions.
© 2017 Growing Science Ltd. All rights reserved Keywords:
Performance optimization PSO
Bottling system Markov approach
1. Introduction
The available literature shows the many approaches have been used to analyze the system performance in terms of availability such as Reliability Block Diagram (RBD), Monte Carlo Simulation (MCS), Markov Approach (MA), Failure Mode and Effect Analysis (FMEA), Fault Tree Analysis (FTA) and Petri nets etc. Also as the performance optimization is one of the key parameter for industries, therefore the researchers used many optimization techniques such as Genetic Algorithm (GA), Paticle Swarm Optimization (PSO) and Simulated Annealing (SA) etc. In the present work PSO technique is being used. PSO (Kennedy & Eberhart, 1995) is Population Based Metaheuristic (PBM) inspired by the behavior of biological swarms and social adaptation. In PSO, a swarm of structures encoding solution candidates (“particles”) flying in n-dimensional search space of the optimization problem looking for optima or near-optima regions. The position of a particle represents a solution candidate itself, while the velocity attribute, and provides information about direction and position. Particles are guided by two components: i) cognitive information based on particles’ own experience and ii) social information based on observation of neighbors. Let Xi={Xi,1, Xi,2,…Xi,n} and Vi= {Vi,1, Vi,2,… Vi,n} respectively position and
velocity of ith particle . Considering that pbest is the best position already found by ith particle and gbest
is the best position already found by a neighbor particle. The PSO updating rules for velocity and position are given by (Kennedy & Eberhart, 1995)
Vi= W×Vi+c1r1(pbesti-Xi)+c2r2(gbest-Xi), (1)
Xi=Xi+Vi, (2)
where r1 and r2 are random numbers between 0 to 1. Coefficients c1 and c2 are given acceleration constants
towards pbest and gbest respectively and their value lie between 0-2 randomly selected and w is the inertia weight. The inertia weight w, is the responsible for the scope of the exploration of the search space. High values of w promote global search, while low values, lead to local search (Kennedy & Eberhart, 1995). The swarm is randomly initialized. Then, while stopping criterion is not reached, particles move according velocity and positions Eqs. (1-2). The PSO algorithm pseudo code can be seen as follows:
begin
for i=1 to no. of particles do begin
randomize position(Xi); randomize (Vi)
end
for Gen=1 to Gen do begin
for i=1 to no. of particles do evaluate (Xi)
fori=1 to no. of particles do update (pbest, gbest)
fori=1 to no. of particles do update (velocity, position)
Vi= W×Vi+c1×r1×pbesti-Xi)+c2×r2×(gbest-Xi)
Xi=Xi+Vi; end
end end
/ International Journal of Industrial Engineering Computations 8 (2017)
Dhillon and Singh (1981) used the MA for the availability analysis using exponential distribution for failure and repair rates. Kumar et al. (1989, 1993) used the Markov modeling for analysis and performance evaluation of sugar and fertilizer plant. Tewari et al. (2000, 2005) developed the decision support system of refining system of a sugar plant. They found out the availability of the refining system with independent failure and repair rates of various subsystems. They also discussed the behavioral analysis of refining system using GA. Coit et al. (2004) proposed a multiple objective formulation for maximizing the system availability. Gupta et al. (2005) discussed the reliability parameters of butter making system of dairy plant taking exponentially distributer failure and repair rates of various subsystems. Kumar et al. (2007) evaluated the availability of CO2 cooling system of a fertilizer plant
using markovian approach. Gupta et al. (2008) developed the performance model and decision support system for feed water unit of thermal power plant based on Markov birth-death process. Sachdeva et al. (2008) described a new multi criteria optimization framework for deriving optimal maintenance schedules for Preventive Maintenance (PM) which considers availability, maintenance cost and life cycle costs as the criteria for optimization using Petri Net. Juang et al. (2008) proposed a GA based optimization model to optimize availability of a series-parallel system.
Azaron et al. (2009) developed a new methodology for reliability evaluation and optimization of non-repairable dissimilar component cold standby redundant systems. Garg et al. (2009) developed the mathematical model of a cattle feed plant using a birth-death Markov Process. The differential equations have been solved for the steady-state. The system performance has also been studied. Garg et al. (2010) developed a reliability model of a block- board manufacturing system in the plywood industry using time dependent and steady state availability under idealized and faulty Preventive Maintenance. Kumar and Tewari (2011) discussed the mathematical modeling and performance optimization of CO2 cooling
system of a fertilizer plant using genetic algorithm. Carlos et al. (2012) proposed a PSO technique for the analysis of safety components and systems of nuclear power plants under uncertain maintenance planning considering reliability, availability, maintainability and cost act as decision criteria whereas surveillance test and maintenance strategies act as decision variables.
Bose et al. (2012) investigated Reliability, Availability and Maintainability (RAM) characteristics of a coal based thermal power plant for finding critical subsystems and deciding maintenance schedule for improving availability of the plant. Khanduja et al. (2012) developed a performance model for stock preparation unit of a paper plant using Markov approach and optimize the performance using genetic algorithm. Khanduja et al. (2012) described a performance enhancement model of crystallization unit of a sugar plant using MA and GA. Kumar et al. (2012) proposed a methodology based on MA to evaluate the availability simulation model for power generation system (Turbine) of a thermal power plant under realistic working environment. The effects of occurrence of failure/course of actions and availability of repair facilities on system performance have been investigated. Arabi and Jahromi (2012) suggested a model of availability of a repairable system with multiple subsystems in which the involved components follow cold-standby strategy. The goal is to find the optimal number of repairmen and redundant components in each subsystem for optimization of steady-state availability subject to weight, cost and volume constraints. Due to complexity of the problem and time limitation, a simulated annealing algorithm is proposed to solve the problem.
upper manufacturing unit and find out the time dependent system availability along with long term availability of the system concerned. Usubamatov et al. (2013) developed mathematical models for productivity and availability of automated lines taking machine availability as important parameter and integrated it with machine reliability.
Gowid et al. (2014) suggested a reliability model based on time dependent Markov approach for LNG production plant. Aggarwal et al. (2014) discussed the performance analysis and performance optimization of a butter oil production system using MA and Runge-Kutta method to calculate the Mean Time Between Failure (MTBF). Further performance has been optimized using GA. Ravinder Kumar (2014) developed a mathematical model based on Markov birth-death process for a boiler air circulation system of a thermal power plant. The differential equations associated with the model have been solved recursively in order to find out the system’s steady state availability.
Huang and Wang (2014) proposed an optimal PM model for a multi-state degraded system under the condition that individual components or subsystems can be monitored in real time. The requirement of minimum system availability, the total maintenance cost is minimized by determining the maintenance activities of components in degraded states. The General Non-Homogeneous Continuous-Time Markov Model (NHCTMM) and its analogous Non-Homogeneous Continuous-Time Markov Reward Model (NHCTMRM) are used to determine the various performance indicators. Further, they apply GA to optimize the proposed model.
Zhange et al. (2014) proposed a simplified method for offshore oil production system which is a hybrid approach i.e. combination of continuous-time and discrete time. Li and Peng (2014) propose an analytical approach to calculate the system availability and the operation cost of the multi-state series–parallel system. In this approach, Markov process is used to model the dynamics of system phase changing and component state changing, using Universal Generating Function (UGF) to calculate the system availability. After that GA is applied to solve the optimization problem of a real-world maritime oil transportation system.
The available literature reveals that most of the researchers had confined their research work to power plants, sugar industries, chemical industries and paper industries. However, rarely any work related to Performance analysis and optimization of filling system of a beverage industries has been noticed so far. Therefore in the present work an attempt has been made to optimize the performance of CSDGB filling system using PSO technique.
2. System description
The beverage plant is divided into many subsystems like Poly Ethylene Terephthalate (PET) Bottle Line, Glass Bottle Line, Hot Drink Line and Mix Preparation unit. The Carbonated Soft Drink Glass Bottle (CSDGB) filling system is one of the important system of the beverage industry. The concentrated mix syrup is supplied to the filling machine from the mix preparation unit. Now the carbonation is done by mixing CO2 with the syrup. The carbonated drink is filled into glass bottles which are coming out from
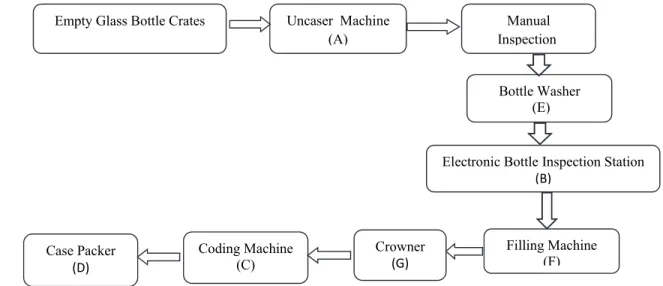
bottle washer. Thereafter, the filled bottles are sent to crowner where the crown is fixed on the bottles. The filled bottles then are sent to the coding machine to code the information regarding price, batch and date of filling. Further, the filled bottles are sent to the case packer where these are packed into carets. The process flow diagram of CSDGB line of beverage industry is shown in figure1. It consists of seven subsystems as described below:
Uncaser: First of all the empty bottles are separated from the crates by uncaser machine and feed the bottles for washing to the bottle washer.
/ International Journal of Industrial Engineering Computations 8 (2017)
Electronic bottle inspection station : This machine is used to inspect the impurity present in the bottle after washing by means of sensors.
Filling machine :This machine is used to clean the bottle first, then fill the metered quantity of cold drink into the bottle, after mixing syrup with CO2 in 1: 5 ratio. The filled bottles are sent to crowner for capping
operation.
Crowner : This Machine is used to fix the crown on the filled bottle.
Coding machine : This machine is used to print the information about price, batch no. etc. on the neck of bottle. Case packer: This machine is used to pack the filled bottle in crates. The filled crates are stacked using fork lifter for further storage.
Fig. 1. Process flow diagram of CSDGB filling system of beverage plant
2.1 Assumptions
i. Failure and repair rates for each subsystem are constant and statistically independent. ii. Not more than one failure occurs at a time.
iii. Repair returns the unit to as good as new condition.
iv. All the units are initially operating and are in working state.
v. Sufficient repair facilities are provided, i.e. no waiting time for repair.
2.2 Notations
A, B, C, D, E, F, G Represents working states of Uncaser Machine, Electronic Inspection Station, Coding machine, Case Packer, Bottle Washer, Filling Machine and Crowner.
a, b, c, d, e, f, g Represents failed states of Uncaser Machine, Electronic Inspection Station, Coding Machine, Case Packer, Bottle Washer, Filling Machine and Crowner.
λ1, λ2, λ3, λ4,λ5, λ6,λ7 Failure rates of A, B, C, D, E, F and G
µ1, µ2, µ3, µ4, µ5, µ6, µ7 Repair rates of A, B, C, D, E, F and G
Pi(t) Probability at time ‘t’ all units are good and the system is in ith state
' Derivatives w.r.t. ‘t’
Ass Steady state availability of the system
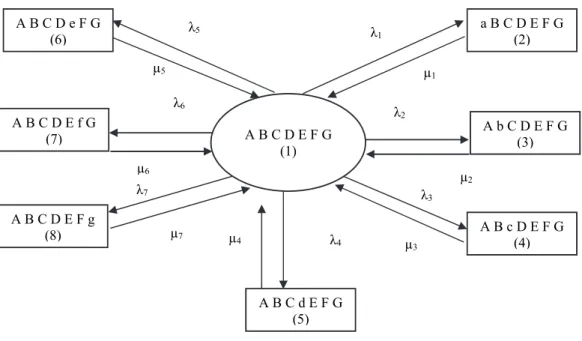
Based on above assumptions and notations the state transition diagram of CSDGB filling system has been developed as shown in Fig. 2.
Coding Machine (C)
Uncaser Machine (A)
Manual Inspection Empty Glass Bottle Crates
Bottle Washer (E)
Electronic Bottle Inspection Station
(B)
Crowner
(G)
Case Packer
(D)
Fig. 2. State transition diagram of CSDGB filling system of a beverage plant
3. Performance modeling
The mathematical modeling of the system based on Markov birth-death process is carried out using various probabilistic considerations. The first order Chapman-Kolmogorov differential equations associated with the state transition diagram shown in figure 2 are developed by using mnemonic rule as stated by Khanduja et al. (2012).Various probability considerations generate the following sets of differential equations:
P t K P t P t P t P t P t P t P t P t (3)
P t P t P t (4)
P t P t P t (5)
P t P t P t (6)
P t P t P t (7)
P t P t P t (8)
P t P t P t (9)
P t P t P t (10)
where K .
By putting t and d/dt= 0 applying on Eq. (3) to 10 we get:
P P P P P P P P
P P P P P P
The probability of good working condition viz P1 is determine by normalizing condition, i.e
Pi (t) = 1 for i=1 and Pi (t) = 0 for i ≠ 1, we get:
P M P P M P P M1P1 P M P P M P P M P P M P
where, Mi = λi/µi, for i =1, 2, 3, 4, 5, 6 and 7.
P 1 (11)
5
λ
A B C D E F G (1) A B C D e F G
(6)
a B C D E F G (2)
A B C D E f G
(7) A b C D E F G(3)
2
λ
1
λ
6
λ
6
µ
5
µ
1
µ
2
µ
3
λ
7
λ
A B C D E F g
(8) µ4
A B c D E F G (4)
4
λ
7
µ
3
µ
/ International Journal of Industrial Engineering Computations 8 (2017)
Now, the steady state availability of the system may be obtained as summation of all the working state probabilities, i .e P1 .
P1 1 P P P P P P P
(12)
The steady state availability of the system As s is given by A P
3.1 Performance analysis
The performance analysis is being carried out by taking appropriate range of failure and repair parameters of all subsystems from maintenance record of CSDGB filling system and detailed discussion with the maintenance personnel. The simulation results are presented in table1 to 7. The effect of various subsystems on availability of the system with various combinations of failure and repair parameters has been shown in table 1 to 7. It also reveals the effect of failure and repair parameters of all subsystems on CSDGB filling system performance. On the basis of analysis we can select the best possible combination of failure and repair rate (λi, µi)to increase the system’s availability. Table 1 to 7 also reflects the
maximum availability level for all the subsystems (for Uncaser 0.8160, Electronic inspection station 0.7930, Coding machine 0.7885, Case packer 0.7885, Bottle washer 0.8337, Filling machine 0.7958 and Crowner=0.7934) which is further optimized using PSO approach.
Table 1
Effect of failure and repair rates of Uncaser machine on availability of the system
λ1
µ1 0.004 0.006 0.008 0.010
0.05 0.7880 0.7639 0.7412 0.7199 Other Constant Parameters
λ2=0.005, µ2=0.35, λ3=0.00035, µ3=0.85,
λ4=0.00038,µ4=0.8, λ5=0.008, µ5=0.08,
λ6=0.005, µ6=0.07,λ7=0.0008 and µ7=0.07.
0.075 0.8024 0.7844 0.7642 0.7508
0.09 0.8107 0.7963 0.7825 0.7691
0.11 0.8160 0.8041 0.7925 0.7812
Table 2
Effect of failure and repair rates of electronic inspection machine on availability of the system
λ2
µ
2 0.005 0.007 0.009 0.11
0.35 0.7880 0.7844 0.7809 0.7775 Other Constant Parameters
λ1=0.004, µ1=0.05, λ3=0.00035, µ3=0.85,
λ4=0.00038, µ4=0.8, λ5=0.008, µ5=0.08,
λ6=0.005, µ6=0.07, λ7=0.0008 and µ7=0.07.
0.5 0.7906 0.7881 0.7851 0.7832
0.65 0.7921 0.7901 0.7882 0.7863
0.8 0.7930 0.7914 0.7898 0.7883
Table 3
Effect of failure and repair rates of coding machine on system availability
λ3
µ3 0.0035 0.0070 0.0105 0.0140
0.85 0.7880 0.7877 0.7874 0.7872 Other Constant Parameters
λ1=0.004, µ1=0.05,λ2=0.005,µ2=0.35,
λ4=0.00038, µ4=0.8, λ5=0.008,µ5=0.08,
λ6=0.005, µ6=0.07, λ7=0.0008 and µ7=0.07
1.7 0.7881 0.7879 0.7878 0.7877
2.25 0.7884 0.7880 0.7879 0.7878
3.4 0.7885 0.7881 0.7880 0.7880
Table 4
Effect of failure and repair rates of case packer machine on system availability
λ4
µ4 0.00038 0.00088 0.00138 0.00638
0.8 0.7880 0.7876 0.7872 0.7833 Other Constant Parameters
λ1=0.004,µ1=0.05,λ2=0.005,µ2=0.35,
λ3=0.00035,µ3=0.85,λ5=0.008, µ5=0.08, λ6=0.005,
µ6=0.07, ,λ7=0.0008 and µ7=0.07.
1.6 0.7881 0.7878 0.7872 0.7856
2.4 0.7882 0.7880 0.7879 0.7866
Table 5
Effect of failure and repair rates of bottle washer on system availability
λ5
µ5 0.0008 0.01 0.03 0.05
0.08 0.7880 0.7727 0.6476 0.5574 Other Constant Parameters
λ1=0.004,µ1=0.05,λ2=0.005,µ2=0.35,
λ3=0.00035,µ3=0.85,λ4=0.00038,
µ4=0.8, λ6=0.005,µ6=0.07, λ7=0.0008 and µ7=0.07
0.1 0.8087 0.7958 0.6865 0.6036
0.12 0.8231 0.8120 0.7152 0.6390
0.14 0.8337 0.8234 0.7371 0.6669
Table 6
Effect of failure and repair rates of filling machine on system availability
λ6
µ6 0.005 0.01 0.015 0.02
0.07 0.7880 0.7510 0.7173 0.6865 Other Constant Parameters
λ1=0.004,µ1=0.05,λ2=0.005,µ2=0.35,
λ3=0.00035,µ3=0.85,λ4=0.00038,
µ4=0.8, λ5=0.008,µ5=0.08 ,λ7=0.0008 and µ7=0.07
0.14 0.7910 0.7510 0.7163 0.6880
0.21 0.7930 0.7590 0.7402 0.7130
0.28 0.7958 0.7686 0.7610 0.7414
Table 7
Effect of failure and repair rates of crowning machine on system availability
λ7
µ7 0.0008 0.0016 0.002 0.0035
0.07 0.7880 0.7809 0.7740 0.7672 Other Constant Parameters
λ1=0.004,µ1=0.05,λ2=0.005,µ2=0.35,
λ3=0.00035,µ3=0.85,λ4=0.00038,
µ4=0.8, λ5=0.008,µ5=0.08, λ6=0.005 and µ6=0.07
0.14 0.7915 0.7881 0.7844 0.7809
0.21 0.7927 0.7901 0.7891 0.7847
0.30 0.7934 0.7928 0.7908 0.7878
3.2 Optimization modeling
A Particle Swarm Optimization approach for performance optimization through availability is proposed. The proposed PSO is intended to search for the optimum availability level considering several of the following features such as: i) the various combination of failure and repair rates for subsystems, ii) the impact of number of generation on the systems availability as a whole and iii) the impact of number of particles on the systems availability. Considering availability as main function so, that system must be available for maximum duration of time in good working condition. In this problem PSO is hereby proposed to find out the optimum repair and failure parameters of each subsystem for system performance, i.e maximum availability. Here, the numbers of parameters are fourteen (seven failure and seven repair parameters).Therefore, all possible failure and repair parameters combination has been considered for optimum availability of the system. The real coded structure is used with parameters Inertia weight w=0.9, Cognitive information coefficient (c1) and social information coefficient (c2) both
are 1.5, randomly selected. In order to tune the parameters, 20 independent runs have been made and the best results are reported. The proposed search method is first tested on standard bench mark function i.e Resonbrock to check the results of the algorithm. The termination criterion has been set either maximum number of generations or the value of the objective function start decreasing. Initially, the optimum number of particles has been decided keeping generations equal to 100, then optimum number of generations has been find out taking optimum number of particles. The performance of the system has been determined by imposing constraints on failure and repair parameters i.e minimum and maximum value. Table 8 shows the PSO parameters used in the present work.
λ1 ∈ (0.004, 0.010) λ2 ∈ (0.005, 0.11) λ3 ∈ (0.00035, 0.0014) λ4 ∈ (0.00038, 0.0063) λ5 ∈ (0.008, 0.005)
λ6 ∈ (0.005, 0.02) λ7 ∈ (0.0008, 0.0035) µ1 ∈ (0.05, 0.11) µ2 ∈ (0.05, 0.8) µ3 ∈ (0.85, 3.4)
/ International Journal of Industrial Engineering Computations 8 (2017)
Table 8
PSO Parameters
Sr. No. Parameter Value Remarks
1 Inertia Weight(w) 0.9 High value give Global Exploration it lies between 0-1
2 Cognitive Component(c1) 1.5 Selected Randomly (0-2)
3 Social Component(c2) 1.5 Selected Randomly (0-2)
4 Number of Particles 25 to 70 To find number of particles for optimum performance 5 Number of Generations 100 to 400 To find number of generations for optimum performance
4. Results and Discussion
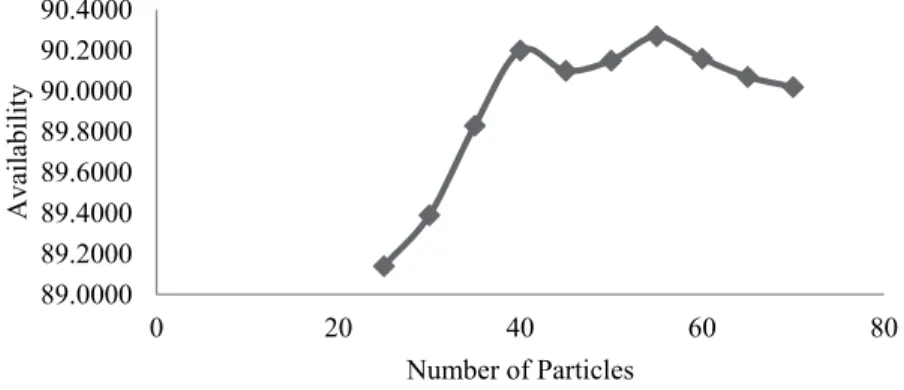
Initially, the simulation is done to find out maximum number of particles in the flock, which are varied from 25 to 70 in a step of 5 taking generation size constant i.e. 100.The convergence characteristic of the algorithm based on number of particles and the effect on system availability is shown in Fig. 3. The optimum value of system’s performance is 90.27%, for which the best possible combination of failure and repair parameters is λ1=0.004, λ2=0.006, λ3=0.004, λ4=0.00078 λ5=0.0090, λ6=0.005, λ7=0.0011,
µ1=0.150, µ2=0.613, µ3=2.011, µ4=0.832, µ5=0.241, µ6=0.256 and µ7=0.131 which is also reflected in
Table 9.
Fig. 3. Effect of Number of Particles on System Availability
Table 9
Effect of Number of Particles on System Availability Taking Number of Generations Constant (100)
Number of Particles
Parameters 25 30 35 40 45 50 55 60 65 70
λ1 0.004 0.005 0.004 0.004 0.004 0.004 0.004 0.004 0.004 0.004
λ2 0.005 0.005 0.005 0.005 0.005 0.007 0.006 0.005 0.005 0.005
λ3 0.002 0.001 0.006 0.001 0.001 0.001 0.004 0.001 0.001 0.001
λ4 0.0014 0.0030 0.0011 0.0005 0.0010 0.0008 0.0008 0.0009 0.0056 0.0005
λ5 0.0083 0.0082 0.0081 0.0080 0.0080 0.0080 0.0090 0.0080 0.0080 0.0080
λ6 0.005 0.005 0.005 0.005 0.005 0.006 0.005 0.005 0.005 0.005
λ7 0.0012 0.0009 0.0009 0.0008 0.0008 0.0009 0.0011 0.0008 0.0008 0.0009
µ1 0.141 0.147 0.145 0.150 0.149 0.355 0.150 0.147 0.150 0.148
µ2 0.713 0.766 0.681 0.799 0.797 0.678 0.613 0.794 0.799 0.775
µ3 1.554 3.391 3.205 0.868 0.850 1.004 2.016 2.816 3.282 0.884
µ4 2.185 1.079 3.192 3.194 1.940 1.923 0.832 3.187 2.766 2.659
µ5 0.148 0.149 0.150 0.150 0.150 0.145 0.241 0.150 0.149 0.150
µ6 0.242 0.277 0.278 0.285 0.281 0.211 0.256 0.273 0.280 0.285
µ7 0.186 0.240 0.295 0.239 0.238 0.237 0.131 0.299 0.296 0.291
Availability 89.14 89.39 89.83 90.2 90.1 90.15 90.27 90.16 90.07 90.02
89.0000 89.2000 89.4000 89.6000 89.8000 90.0000 90.2000 90.4000
0 20 40 60 80
A
v
aila
b
ilit
y
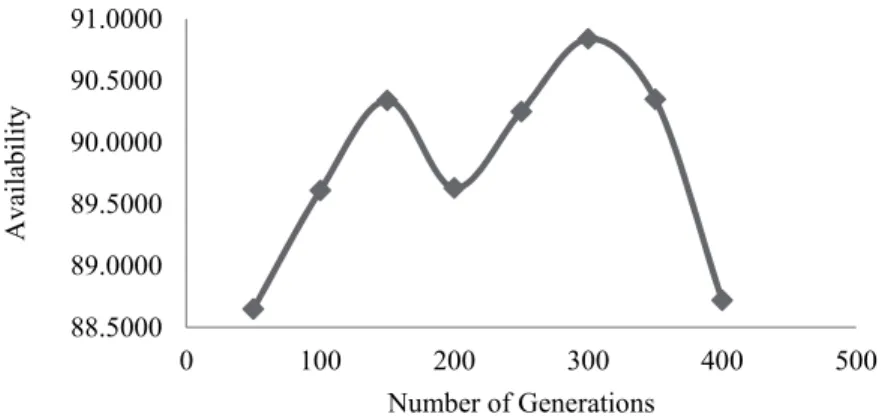
Similarly, the convergence characteristics of the algorithm based on number of generations has been shown in figure 4. Now the simulation has been done to a maximum number of generations, which varied from 50 to 400 with a step size of 50 taking number of particles 55. The effect of number of generations on system availability has been shown in table 10. The optimum value of system’s performance is 90.84%, for which the best possible combination of failure and repair parameters is λ1=0.004, λ2=0.006,
λ3=0.002, λ4=0.0023, λ5=0.0081, λ6=0.006, λ7=0.0009 µ1=0.148, µ2=0.771, µ3=3.352, µ4=3.082,
µ5=0.193, µ6=0.277 and µ7=0.868.
Fig. 4. Effect of Number of Generations on System Availability (Number of Particles 55)
Table 10
Effect of Number of Generations on System Availability Taking Number of Particles Constant (55)
No. of Generations
50 100 150 200 250 300 350 400
λ1 0.004 0.004 0.004 0.004 0.004 0.004 0.004 0.004
λ2 0.005 0.006 0.005 0.005 0.005 0.006 0.005 0.006
λ3 0.007 0.013 0.001 0.011 0.001 0.002 0.001 0.002
λ4 0.0005 0.0009 0.0004 0.0011 0.0004 0.0023 0.0004 0.0059
λ5 0.0081 0.0080 0.0080 0.0082 0.0080 0.0081 0.0080 0.0081
λ6 0.005 0.005 0.005 0.005 0.005 0.006 0.005 0.007
λ7 0.0016 0.0008 0.0008 0.0010 0.0008 0.0009 0.0008 0.0010
µ1 0.139 0.149 0.149 0.140 0.149 0.148 0.149 0.131
µ2 0.423 0.933 0.800 0.751 0.775 0.771 0.799 0.516
µ3 1.953 3.367 3.382 1.969 1.064 3.352 3.143 1.000
µ4 2.194 1.068 3.033 1.134 3.003 3.082 3.147 2.829
µ5 0.149 0.149 0.150 0.171 0.150 0.193 0.150 0.150
µ6 0.237 0.277 0.284 0.270 0.282 0.277 0.285 0.284
µ7 0.296 0.152 0.298 0.191 0.286 0.868 0.300 0.293
Availability 88.65 89.61 90.34 89.63 90.25 90.84 90.35 88.72
5. Conclusions
The present paper highlighted the applications of PSO for determining the optimum value of availability of CSDGB filling system of a beverage plant. The availability equations has been derived and effect of failure and repair rate on system availability has been studied. Further, system performance has been optimized using PSO approach, the effect of number of particles and number of generations on the system performance, has been studied. The results of the paper are discussed with the plant management and which found the result for betterment of system performance. As far as future scope of research work is concerned, such approach could be extended to multi-objective and multi-criteria optimization problems to give more effective and practical solutions applied to various types of industrial systems. Further, the proposed method can be compared to other optimization methods such as Genetic Algorithms, Ant Colony, etc.
88.5000 89.0000 89.5000 90.0000 90.5000 91.0000
0 100 200 300 400 500
A
v
ai
la
b
il
ity
/ International Journal of Industrial Engineering Computations 8 (2017)
References
Arabi, A. A. Y., & Jahromi, A. E. (2012). Developing a new model for availability of a series repairable system with multiple cold-standby subsystems and optimization using simulated annealing
considering redundancy and repair facility allocation. International Journal of System Assurance
Engineering and Management, 3(4), 310-322.
Aggarwal, A. K., Singh, V., & Kumar, S. (2014). Availability analysis and performance optimization of
a butter oil production system: a case study. International Journal of System Assurance Engineering
and Management, 1-17.
Azaron, A., Perkgoz, C., Katagiri, H., Kato, K., & Sakawa, M. (2009). Multi-objective reliability
optimization for dissimilar-unit cold-standby systems using a genetic algorithm. Computers &
Operations Research, 36(5), 1562-1571.
Bose, D., Chattopadhyay, S., Bose, G., Adhikary, D., & Mitra, S. (2012). RAM investigation of
coal-fired thermal power plants: a case study. International Journal of Industrial Engineering
Computations, 3(3), 423-434.
Bourouni, K. (2013). Availability assessment of a reverse osmosis plant: comparison between reliability
block diagram and fault tree analysis methods. Desalination, 313, 66-76.
Coit, D. W., Jin, T., & Wattanapongsakorn, N. (2004). System optimization with component reliability
estimation uncertainty: a multi-criteria approach. IEEE transactions on reliability, 53(3), 369-380.
Carlos, S., Sánchez, A., Martorell, S., & Villanueva, J. F. (2012). Particle Swarm Optimization of safety
components and systems of nuclear power plants under uncertain maintenance planning. Advances in
Engineering Software, 50, 12-18.
Dhillon, B. S., & Singh, C. (1981). Engineering reliability: new techniques and applications (No. 04;
TS173, D4.). New York: Wiley.
Gupta, P., Lal, A. K., Sharma, R. K., & Singh, J. (2005). Numerical analysis of reliability and availability
of the serial processes in butter-oil processing plant. International Journal of Quality & Reliability
Management, 22(3), 303-316.
Garg, D., Singh, J. & Kumar, K. (2009). Performance analysis of a cattle feed plant. ICFAI University
Journal of Science and Technology, 5(2), 83-94.
Garg, S., Singh, J., & Singh, D. V. (2009). Availability and maintenance scheduling of a repairable
block-board manufacturing system. International journal of reliability and safety, 4(1), 104-118.
Gowid, S., Dixon, R., & Ghani, S. (2014). Optimization of reliability and maintenance of liquefaction
system on FLNG terminals using Markov modelling. International Journal Of Quality & Reliability
Management, 31(3), 293-310.
Garg, H., & Rani, M. (2013). An approach for reliability analysis of industrial systems using PSO and
IFS technique. ISA transactions, 52(6), 701-710.
Garg, H. (2013). Performance analysis of complex repairable industrial systems using PSO and fuzzy
confidence interval based methodology. ISA transactions, 52(2), 171-183.
Huang, C. H., & Wang, C. H. (2014). Optimization of preventive maintenance for a multi-state degraded
system by monitoring component performance. Journal of Intelligent Manufacturing, 1-20.
Kennedy J. & Eberhart R. C. (1995). Particle Swarm Optimization. In Proceedings of IEEE International
Conference on Neural Network, 4, 942-948.
Kumar, D., Singh, J., & Pandey, P. C. (1989). Availability of a washing system in the paper
industry. Microelectronics Reliability, 29(5), 775-778.
Kumar, S., Tewari, P. C. & Sharma, R. (2007). Simulated availability of co2 cooling system in a fertilizer
plant. Industrial Engineering Journal,36(10), 19-23.
Kumar, S. & Tewari, P. C. (2011) Mathematical modeling and performance optimization of co2 cooling
system of a fertilizer plant. International Journal of Industrial Engineering Computation, 2(3), 689-698.
Khanduja, R., Tewari, P. C. & Chauhan, R. S. (2012). Performance modeling and optimization for the stock preparation unit of a paper plant using genetic algorithm. International Journal of Quality
Reliability and Management,28(6), 688-703.
Khanduja, R., Tewari, P. C. & Gupta, M. (2012). Performance enhancement for crystallization unit of sugar plant using genetic algorithm technique. Journal of Industrial Engineering International,28(6), 688-703.
Kumar, R., Sharma, A., & Tewari, P. (2012). Markov approach to evaluate the availability simulation
model for power generation system in a thermal power plant. International Journal of Industrial
Engineering Computations, 3(5), 743-750.
Kumar, R. (2014). Availability analysis of thermal power plant boiler air circulation system using
Markov approach. Decision Science Letters, 3(1), 65-72.
Li, Y. F., & Peng, R. (2014). Availability modeling and optimization of dynamic multi-state series–
parallel systems with random reconfiguration. Reliability Engineering & System Safety, 127, 47-57.
Modgil, V., Sharma, S. K., & Singh, J. (2013). Performance modeling and availability analysis of shoe
upper manufacturing unit. International Journal of Quality & Reliability Management, 30(8),
816-831.
Sachdeva, A., Kumar, D., & Kumar, P. (2008). Planning and optimizing the maintenance of paper
production systems in a paper plant. Computers & Industrial Engineering, 55(4), 817-829.
Tewari, P. C., Joshi, D., & Rao, M. S. (2005). Mathematical modeling and behavioral analysis of a
refining system using genetic algorithm. In Proceedings of national conference on Competitive
Manufacturing Technology and Management for Global Marketing, Chennai.
Usubamatov, R., Ismail, K. A., & Sah, J. M. (2013). Mathematical models for productivity and
availability of automated lines. The International Journal of Advanced Manufacturing
Technology, 66(1-4), 59-69.
Juang, Y. S., Lin, S. S., & Kao, H. P. (2008). A knowledge management system for series-parallel
availability optimization and design. Expert Systems with Applications, 34(1), 181-193.
Waintraub, M., Schirru, R., & Pereira, C. M. (2009). Multiprocessor modeling of parallel Particle Swarm
Optimization applied to nuclear engineering problems. Progress in Nuclear Energy, 51(6), 680-688.
Zhang, H., Innal, F., Dufour, F., & Dutuit, Y. (2014). Piecewise Deterministic Markov Processes based
approach applied to an offshore oil production system. Reliability Engineering & System Safety, 126,
126-134.