Submitted18 March 2015 Accepted 11 April 2015 Published30 April 2015
Corresponding author
Annette F. Govindarajan, [email protected]
Academic editor
Robert Toonen
Additional Information and Declarations can be found on page 11
DOI10.7717/peerj.926
Copyright
2015 Govindarajan et al.
Distributed under
Creative Commons CC-BY 4.0
OPEN ACCESS
Phylogeographic structure and
northward range expansion in the
barnacle
Chthamalus fragilis
Annette F. Govindarajan1, Filip Bukˇsa1,2, Katherine Bockrath3, John P. Wares3,4and Jes ´us Pineda1
1Biology Department, Woods Hole Oceanographic Institution, Woods Hole, MA, USA 2Department of Biology, University of Zagreb, Croatia
3Department of Genetics, University of Georgia, Athens, GA, USA 4Odum School of Ecology, University of Georgia, Athens, GA, USA
ABSTRACT
The barnacleChthamalus fragilisis found along the US Atlantic seaboard historically from the Chesapeake Bay southward, and in the Gulf of Mexico. It appeared in New England circa 1900 coincident with warming temperatures, and is now a conspicuous member of rocky intertidal communities extending through the northern shore of Cape Cod, Massachusetts. The origin of northernC. fragilisis debated. It may have spread to New England from the northern end of its historic range through larval transport by ocean currents, possibly mediated by the construction of piers, marinas, and other anthropogenic structures that provided new hard substrate habitat. Alternatively, it may have been introduced by fouling on ships originating farther south in its historic distribution. Here we examine mitochondrial cytochrome c oxidase I sequence diversity and the distribution of mitochondrial haplotypes ofC. fragilisfrom 11 localities ranging from Cape Cod, to Tampa Bay, Florida. We found significant genetic structure between northern and southern populations. Phylogenetic analysis revealed three well-supported reciprocally monophyletic haplogroups, including one haplogroup that is restricted to New England and Virginia populations. While the distances between clades do not suggest cryptic speciation, selection and dispersal barriers may be driving the observed structure. Our data are consistent with an expansion ofC. fragilisfrom the northern end of its mid-19th century range into Massachusetts.
Subjects Biodiversity, Biogeography, Marine Biology
Keywords Chthamalus, Range expansion, Barnacle, Phylogeography
INTRODUCTION
are other coastal boundary regions for nearshore species (e.g.,Valentine, 1966), it is necessary to evaluate each species individually. The intertidal barnacleChthamalus fragilis
is currently found along the eastern United States, extending from the Gulf of Mexico to the Atlantic coast northward up to Massachusetts (Wells, 1966;Zullo, 1963;Carlton, Newman & Pitombo, 2011), and is thought to be experiencing a northward range expansion linked to warmer temperatures (Wethey, 1984;Carlton, Newman & Pitombo, 2011). Prior to the late 19th century,C. fragiliswas observed from the Chesapeake Bay area and southward. It was first observed in New England (Woods Hole, Massachusetts) in 1898, and subsequently was observed in other locations south of Cape Cod, in Buzzards Bay and Vineyard Sound (Carlton, Newman & Pitombo, 2011). More recently, it is found along the north shore of Cape Cod, from the outer Cape (Provincetown) to Sandwich at the northern end of the Cape Cod Canal (Zullo, 1963;Carlton, 2002;Wethey, 2002;Jones, Southward & Wethey, 2012).C. fragilisis a conspicuous species occupying the easily accessible upper intertidal, so it is unlikely that an earlier northern presence was overlooked, particularly as the Woods Hole region has a long history of faunal surveys.
The source of the northernC. fragilispopulations is controversial. It is unknown if the barnacles dispersed via natural (e.g., ocean currents) or anthropogenic vectors (e.g., ship hull fouling), or both.C. fragilispossesses a typical biphasic life cycle, with the potential for long distance dispersal. Adults are hermaphroditic with internal fertilization and are capable of self-fertilization (Barnes & Barnes, 1958). Thus, clusters of adults are not required for reproduction as in many barnacles (Crisp, 1950). Larvae are released into the water, typically in the summer (Lang & Ackenhusen-Johns, 1981), where they pass through 6 naupliar stages and a non-feeding cyprid stage. In chthamalids, the planktonic period may last up to three weeks or more (Miller et al., 1989), allowing ample time for larval transport by ocean currents. Cyprids settle on hard intertidal substrata and metamorphose into the adult form.
C fragilissettles on artificial surfaces, and thus has a high potential for dispersal by anthropogenic transport.Sumner (1909)suggested that the relatively sudden appearance ofC. fragilisin Woods Hole, MA was due to human introduction. In support of this hypothesis,Carlton, Newman & Pitombo (2011)points out that Woods Hole was home to the Pacific Guano Company between 1863 and 1889, which received potentially fouled ships from South Carolina, the type locality forC. fragilis, and elsewhere. The construction of structures such as docks, pilings, and seawalls may have provided suitable habitats along the mostly sandy shoreline south of Connecticut, also facilitating range expansion (e.g.,Jones, Southward & Wethey, 2012).
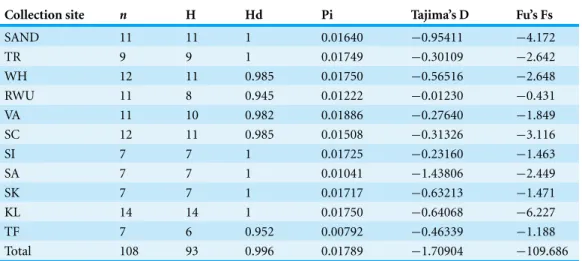
Table 1 Summary statistics calculated in DnaSP.None of the Tajima’s D values were significant.
Collection site n H Hd Pi Tajima’s D Fu’s Fs
SAND 11 11 1 0.01640 −0.95411 −4.172
TR 9 9 1 0.01749 −0.30109 −2.642
WH 12 11 0.985 0.01750 −0.56516 −2.648
RWU 11 8 0.945 0.01222 −0.01230 −0.431
VA 11 10 0.982 0.01886 −0.27640 −1.849
SC 12 11 0.985 0.01508 −0.31326 −3.116
SI 7 7 1 0.01725 −0.23160 −1.463
SA 7 7 1 0.01041 −1.43806 −2.449
SK 7 7 1 0.01717 −0.63213 −1.471
KL 14 14 1 0.01750 −0.64068 −6.227
TF 7 6 0.952 0.00792 −0.46339 −1.188
Total 108 93 0.996 0.01789 −1.70904 −109.686
Notes.
N, number of individuals; H, number of haplotypes; Hd, haplotype diversity; Pi, nucleotide diversity; SAND, Sandwich, Massachusetts; TR, Truro, Massachusetts; WH, Woods Hole, Massachusetts; RWU, Bristol, Rhode Island; VA, Gloucester Point, Virginia; SC, Charleston, South Carolina; SI, Sapelo Island, Georgia; SA, Savannah, Georgia; SK, Summerland Key, Florida; KL, Key Largo, Florida; TF, Tampa, Florida.
The goals of this study were to investigate the phylogeographic structure ofC. fragilis
and gain insight into the origin of northernC. fragilispopulations by comparing mito-chondrial cytochrome c oxidase (COI) haplotypes from several locations in Massachusetts and Rhode Island with those obtained from locations farther south, in Virginia, South Carolina, Georgia, and Florida. Thus, sampling covered a∼2,000 km range (minimum
linear separation). While confirming the source of populations that are cryptogenic (i.e., of unknown origin) can be difficult, the existence of private haplotypes shared between the northern populations and a subset of southern populations may indicate the colonization pathway (Geller, Darling & Carlton, 2010). For example, private haplotypes shared between northern and South Carolina barnacles may support the idea that barnacles arrived through transport associated with the Woods Hole guano industry (Carlton, Newman & Pitombo, 2011). Alternatively, private haplotypes shared only between northern and Chesapeake Bay—area barnacles (at the northern end of their historic range) may suggest a range expansion. We compare genetic diversity and the distribution of mitochondrial haplotypes from barnacles ranging from Massachusetts to Florida, and demonstrate significant genetic structuring between northern and southern populations. We discuss the implications of these patterns for a genetic break near Cape Hatteras and the origin of northernC. fragilis.
MATERIALS & METHODS
We collected 108Chthamalus fragilisindividuals from 11 sites along the Atlantic and Gulf coasts of North America (Table 1). We extracted genomic DNA using DNEasy Blood and Tissue and Puregene kits (Qiagen) and amplified the mitochondrial cytochrome c oxidase I (COI) gene using standard primers (Folmer et al., 1994) and protocols. We ran 25µl
denaturation at 95◦
for 3 min; 35 cycles of 95◦
for 30 s, 48◦
for 30 s, and 72◦
for 1 min; and a final extension at 72◦for 5 min. We visualized PCR products on a 1.5% agarose gel stained with GelRed (Biotium). PCR products were purified using Qiaquick PCR Purification kits (Qiagen, Hilden, Germany) and quantified using a Nanodrop 2000 spectrophotometer (Nanodrop Technologies, Wilmington, Delaware, USA). Purified products were sent to MWG Eurofins Operon for sequencing in both directions.
We assembled chromatograms and confirmed sequence quality using Geneious v. 7.1.7 (Biomatters, San Francisco, California, USA). Sequences were aligned using ClustalW (Larkin et al., 2007) with default parameters using the Geneious platform. The alignment was confirmed by eye and translated into amino acid sequences to verify that no pseudogenes were present. Sequences were deposited in GenBank (KP898760–KP898867)
Nucleotide diversity, haplotype diversity, Tajima’s D and Fu’s Fs were calculated using DnaSP (Librado & Rozas, 2009). An Analysis of Molecular Variance (AMOVA) was performed using Arlequin (Excoffier & Lischer, 2010). To examine relationships between haplotypes, we conducted a Bayesian analysis using Mr.Bayes, accessed through Geneious. The best-fit model for the Bayesian analysis was selected using the corrected Akaike Information Criterion (AICc) with jModeltest 2.1.6 (Guindon & Gascuel, 2003;Darriba et al., 2012), based on 3 substitution schemes for compatibility with Geneious. The settings in Mr. Bayes were Nst=6, rates=invgamma, ngammacat=4,1,100,000 generations, sam-pling frequency=1,000, number of chains=4; temperature=0.2, and burn-in=100.
We examined the geographic distribution of the major well-supported haplogroups recovered in the Bayesian analysis. A Mantel test was conducted using the Isolation By Distance Web Service v. 3.23 (Jensen, Bohonak & Kelley, 2005) to test for isolation by distance. Pairwise geographic distances were calculated using Google Earth following the coast with the segments connecting two shoreline points≤20 km, reflecting plausible larval transport routes and dispersal distances. We also compared intraspecific divergences between sequences from the major haplogroups withC. proteus, a cryptic sibling species of
C. fragilis(Genbank accession numbersFJ858021–FJ858040,Wares, 2001).
RESULTS
After trimming the ends and removing 6 positions with ambiguous base calls, our align-ment was 613 base pairs, with 93 unique sequences (haplotypes), and 110 polymorphic sites, of which 58 were parsimony informative. In the amino acid alignment (which included the 6 positions excluded in the nucleotide alignment), there were three amino acid substitutions: a valine for an alanine in position 6 in a Charleston, South Carolina se-quence; a valine for an isoleucine in position 55 for a Woods Hole, Massachusetts sequence, and an alanine for a threonine in position 157 for a Summerland Key, Florida sequence.
Table 2 Population paiwise FSTvalues.Distance method: pairwise distance. Negative values converted to 0. Significant values (p<0.05) in bold.
WH RI SC TF SI VA TR SN KL SK
WH
RI 0
SC 0.153 0.299
TF 0.349 0.497 0.118
SI 0.154 0.310 0 0.055
VA 0.085 0.186 0.003 0.109 0
TR 0.031 0.053 0.078 0.240 0.062 0
SAND 0 0 0.202 0.381 0.205 0.103 0
KL 0.100 0.241 0 0.120 0 0.018 0.080 0.154
SK 0.158 0.306 0 0.044 0 0 0.074 0.203 0
SA 0.390 0.537 0.103 0.112 0.023 0.137 0.267 0.430 0.143 0.065
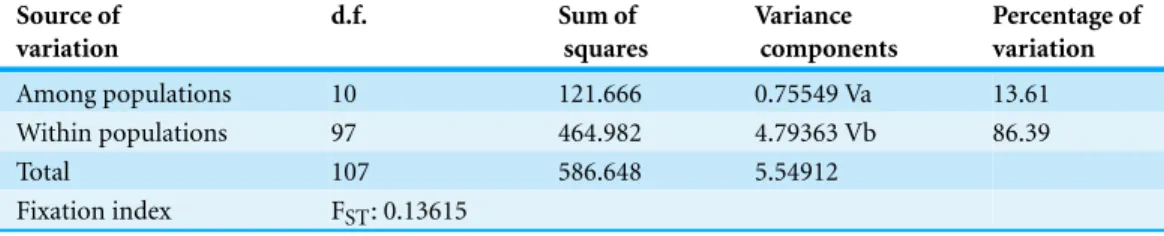
Table 3 Analysis of Molecular Variance (AMOVA) results.
Source of variation
d.f. Sum of
squares
Variance components
Percentage of variation
Among populations 10 121.666 0.75549 Va 13.61
Within populations 97 464.982 4.79363 Vb 86.39
Total 107 586.648 5.54912
Fixation index FST: 0.13615
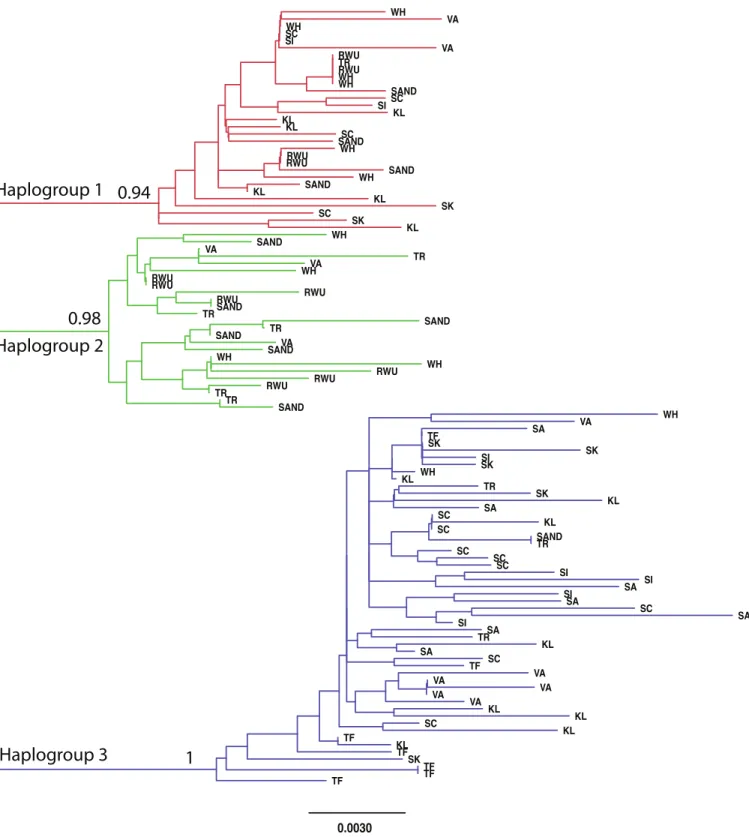
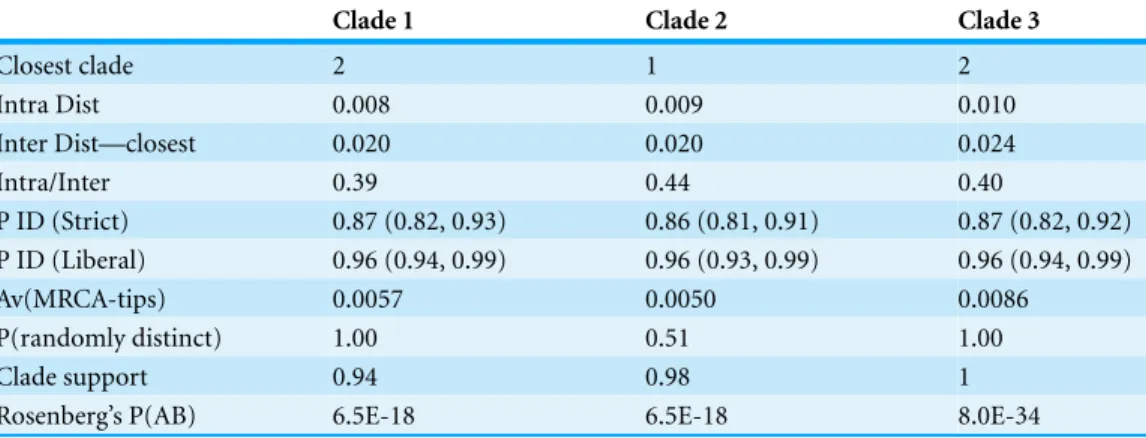
within populations (Table 3). The best-fit model selected using the AICc was HKY+I+G. A Bayesian analysis conducted with this model revealed three distinct, well-supported haplogroups (i.e., clades) (Fig. 1). A neighbor-joining tree based on HKY distances also uncovered these three haplogroups (Fig. 1), and was used to assess the distinctiveness of the haplogroups with the Species Delimitation Plugin in Geneious (Rosenberg, 2007;Masters, Fan & Ross, 2011). Within each of the three haplogroups, intraclade distances were significantly smaller than interclade distances (Table 4). Rosenberg’s PAB was 6.5E-18, 6.5E-18, 8.0E-34, for clades 1, 2, and 3, respectively (Table 4), strongly supporting reciprocal monophyly of the three haplogroups. All three haplogroups are clearly differentiated from the sister taxonChthamalus proteus(Fig. 2).
Figure 2 Comparison withChthamalus proteus.Midpoint-rooted neighbor-joining topology generated using HKY distances.
Table 4 Species delimitation results.Clade support is posterior probability from the Bayesian analysis for the node defining the clade (Fig. 1).
Clade 1 Clade 2 Clade 3
Closest clade 2 1 2
Intra Dist 0.008 0.009 0.010
Inter Dist—closest 0.020 0.020 0.024
Intra/Inter 0.39 0.44 0.40
P ID (Strict) 0.87 (0.82, 0.93) 0.86 (0.81, 0.91) 0.87 (0.82, 0.92) P ID (Liberal) 0.96 (0.94, 0.99) 0.96 (0.93, 0.99) 0.96 (0.94, 0.99)
Av(MRCA-tips) 0.0057 0.0050 0.0086
P(randomly distinct) 1.00 0.51 1.00
Clade support 0.94 0.98 1
Rosenberg’s P(AB) 6.5E-18 6.5E-18 8.0E-34
DISCUSSION
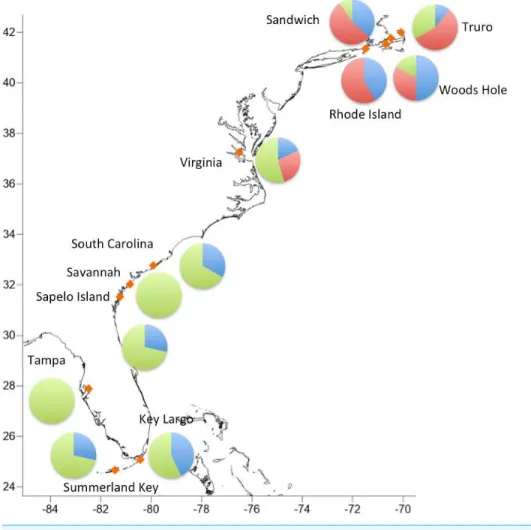
Lineage diversityFigure 3 Geographic distribution of the three major haplogroups.
includingBalanus glandulaalong the California coast (Sotka et al., 2004),Notochthamalus scabrosusalong the Chilean coast (Zakas et al., 2009) andChthamalus moroin southeastern Asia (Wu et al., 2014).
A deep phylogeographic break for species like barnacles with high planktonic dispersal potential may be due to several non mutually exclusive factors, including selection, cryptic speciation, and the presence of dispersal barriers (Zakas et al., 2009). It is possible thatC. fragilisbelonging to haplotype group 2 have characteristics that are less suited to southern locations. Additional research on the physiology and ecology ofC. fragilisare necessary to elucidate possible adaptive differences between northern and southern populations.
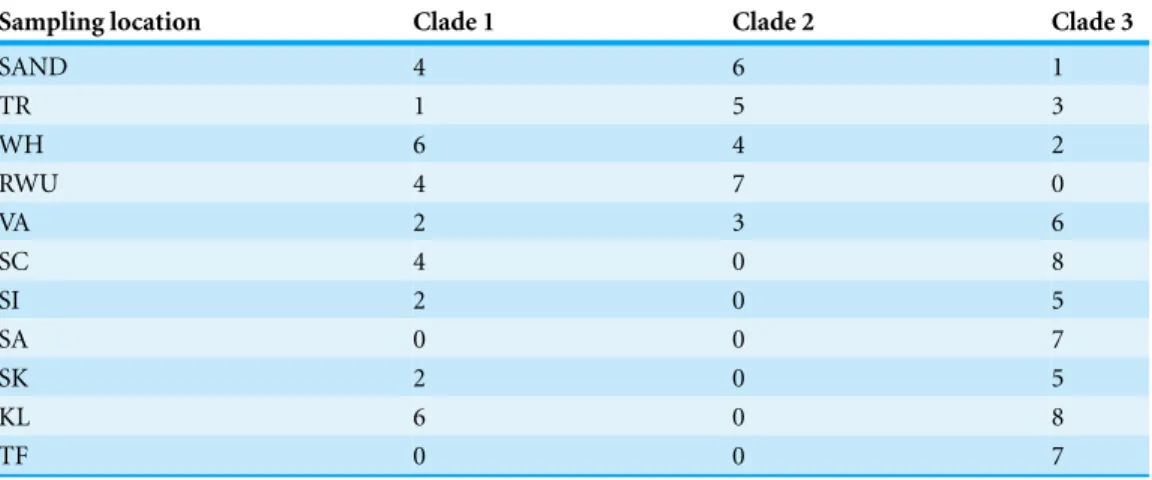
Table 5 Distribution of individuals in haplogroups.Number of individuals falling in haplogroups 1, 2, and 3 for each sampling location.
Sampling location Clade 1 Clade 2 Clade 3
SAND 4 6 1
TR 1 5 3
WH 6 4 2
RWU 4 7 0
VA 2 3 6
SC 4 0 8
SI 2 0 5
SA 0 0 7
SK 2 0 5
KL 6 0 8
TF 0 0 7
Notes.
SAND, Sandwich, Massachusetts; TR, Truro, Massachusetts; WH, Woods Hole, Massachusetts; RWU, Bristol, Rhode Island; VA, Gloucester Point, Virginia; SC, Charleston, South Carolina; SI, Sapelo Island, Georgia; SA, Savannah, Georgia; SK, Summerland Key, Florida; KL, Key Largo, Florida; TF, Tampa, Florida..
3%,Bucklin, Steinke & Blanco-Bercial, 2011) than sequences originating from individuals belonging to different species (often>10%,Bucklin, Steinke & Blanco-Bercial, 2011).
Cryptic speciation may be common among chthamalid barnacles.Dando & Southward (1980)identifiedChthamalus proteusas a cryptic species distinguishable only through molecular techniques fromC. fragilisusing enzyme electrophoresis, and these results were supported byWares (2001)andWares et al. (2009)using DNA sequences. In the Asian
Chthamalus moro,Wu et al. (2014)observed interpopulation COI variation 3.9–8.3%, and inferred a cryptic speciation noting that population comparisons at the upper end of that range were comparable to interspecific divergence in the chthamalidsEuraphia rhizophoraeandE. eastropacensis(∼9%;Wares, 2001), which were separated by the rise of the Panamanian isthmus. However, the relatively short distances between our threeC. fragilisclades relative toC. proteusdo not support separate species status for the clades.
Our observed phylogeographic transition between Virginia and South Carolina spans Cape Hatteras, a region thought to be an important biogeographic boundary.Pappalardo et al. (2014)found that Cape Hatteras is a northern boundary for many species, but less so a southern boundary. In our dataset, this region is apparently a southern boundary for haplogroup 2. However, additional fine scale sampling between Virginia and South Carolina, especially around Cape Hatteras, is necessary to demarcate the location and nature of the break (e.g.,Jennings et al., 2009).
Cunningham, 2005;Moyle, 2006), and may be driven by mechanisms of vicariance and selection on these divergent lineages. Given the high potential for larval dispersal in
C. fragilis, we simply note that this statistical signal indicates a limit to gene flow, which may or may not be distinct from patterns of larval dispersal.
Northern expansion
Anthropogenic factors influence species distributions and population structure, which may facilitate the northward expansion ofC. fragilis(Carlton, Newman & Pitombo, 2011). For barnacles, larvae can be transported long distances in ballast water and adults on ship hulls (Godwin, 2003;Zardus & Hadfield, 2005;Carlton, Newman & Pitombo, 2011). Coastal development is creating more and novel habitats for barnacles as well as other hard substrate organisms in regions dominated by sandy and muddy habitats where suitable substrate may have been previously limiting (Landschoffet al., 2013). Furthermore, warmer temperatures associated with climate change are thought to facilite poleward range expansions for many species (Barry et al., 1995;Zacherl, Gaines & Lonhart, 2003;Perry et al., 2005;Sunday, Bates & Dulvy, 2012), including barnacles (Southward, 1991;Dawson et al., 2010;De Rivera et al., 2011).
Here, we sought to gain insight into the origin of the northern expansion ofC. fragilis.
Carlton, Newman & Pitombo (2011)speculated thatC. fragilismay have colonized Massachusetts by traveling on ships bound for Woods Hole from South Carolina. Alternatively, non-transport related anthropogenic factors may have facilitated expansion from the historical northern boundary in the mid-Atlantic. Warmer temperatures may have shifted ecological interactions to favorC. fragilis(Wethey, 2002;Carlton, Newman & Pitombo, 2011). Additionally, coastal development could have facilitated stepwise northward dispersal. Construction of marinas, docks, jetties, seawalls, and other structures provided hard substrate habitat that was not previously available in the typically sandy coastline between Chesapeake Bay and New England.
The absence of clade 2 south of Virginia suggests that northernC. fragilislikely originate from the northern part of its mid-19th century range. While our sample sizes are relatively small and we analyze a single marker, the complete absence of any haplogroup 2 sequences south of Virginia supports this hypothesis. Additional sampling in the mid-Atlantic region and analysis of multiple genetic markers will be crucial for both providing additional testing of this hypothesis, and for understanding the nature of the putative Cape Hatteras biogeographic break forC. fragilis.
by shifts in genetic composition (e.g., expansion of haplogroup 2). Understanding how the population genetic composition is shifting, and how these changes may impact the overall community structure, is critical for understanding the consequence of climate change on coastal communities.
ACKNOWLEDGEMENTS
We thank V Starczak (WHOI) for assistance with collecting barnacles, P Polloni (WHOI) for assistance with laboratory procedures, and T Shank (WHOI) for use of his laboratory equipment.
ADDITIONAL INFORMATION AND DECLARATIONS
Funding
Funding was provided by the Woods Hole Oceanographic Institution in an Independent Study Award to J Pineda and AF Govindarajan, a WHOI summer fellowship to F Bukˇsa, and NSF Biological Oceanography #1029526 to JP Wares. The funders had no role in study design, data collection and analysis, decision to publish, or preparation of the manuscript.
Grant Disclosures
The following grant information was disclosed by the authors: Woods Hole Oceanographic Institution.
NSF Biological Oceanography: #1029526.
Competing Interests
The authors declare there are no competing interests.
Author Contributions
• Annette F. Govindarajan conceived and designed the experiments, performed the
experiments, analyzed the data, contributed reagents/materials/analysis tools, wrote the paper, prepared figures and/or tables, reviewed drafts of the paper.
• Filip Bukˇsa and Katherine Bockrath performed the experiments, analyzed the data, reviewed drafts of the paper.
• John P. Wares conceived and designed the experiments, performed the experiments,
analyzed the data, contributed reagents/materials/analysis tools, reviewed drafts of the paper.
• Jes ´us Pineda conceived and designed the experiments, performed the experiments, analyzed the data, contributed reagents/materials/analysis tools, prepared figures and/or tables, reviewed drafts of the paper.
DNA Deposition
REFERENCES
Barnes H, Barnes M. 1958.Further observations on self-fertilization inChthamalus sp.Ecology
39(3):550DOI 10.2307/1931773.
Barry JP, Baxter CH, Sagarin RD, Gilman SE. 1995.Climate-related, long-term faunal changes in
a California rocky intertidal community.Science267:672–675
DOI 10.1126/science.267.5198.672.
Bucklin A, Steinke D, Blanco-Bercial L. 2011.DNA barcoding of marine metazoan.Annual
Review of Marine Science3(1):471–508DOI 10.1146/annurev-marine-120308-080950.
Carlton JT. 2002.Bioinvasion ecology: assessing invasion impact and scale. In: Lepp˘akoski
E, Gollasch S, Olenin S, eds.Invasive aquatic species of Europe: distribution, impacts, and management. Dordrecht: Kluwer Academic Publishers, 7–19.
Carlton JT, Newman WA, Pitombo FB. 2011.Barnacle invasions: introduced, cryptogenic, and
range expanding Cirripedia of North and South America. In: Galil BS, Clark PF, Carlton JT, eds.In the wrong place—Alien marine crustaceans: distribution, biology and impacts. Berlin: Springer–Verlag, 159–213.
Crisp D. 1950.Breeding and distribution ofChthamalus stellatus.Nature166:311–312
DOI 10.1038/166311b0.
Dando PR, Southward AJ. 1980.A new species of Chthamalus(Crustacea: Cirripedia)
characterized by enzyme electrophoresis and shell morphology: with a revision of other species ofChthamalusfrom the western shores of the Atlantic Ocean.Journal of the Marine Biological Association of the United Kingdom60(3):787–831DOI 10.1017/S0025315400040455.
Darriba D, Taboada GL, Doallo R, Posada D. 2012.jModelTest 2: more models, new heuristics
and parallel computing.Nature Methods9:772DOI 10.1038/nmeth.2109.
Dawson MN, Grosberg RK, Stuart YE, Sanford E. 2010.Population genetic analysis of a recent
range expansion: mechanisms regulating the poleward range limit in the volcano barnacle Tetraclita rubescens.Molecular Ecology19(8):1585–1605
DOI 10.1111/j.1365-294X.2010.04588.x.
De Rivera CE, Steves BP, FofonoffPW, Hines AH, Ruiz GM. 2011.Potential for high-latitude
marine invasions along western North America.Diversity and Distributions17(6):1198–1209
DOI 10.1111/j.1472-4642.2011.00790.x.
Excoffier L, Lischer HEL. 2010.Arlequin suite ver 3.5: a new series of programs to perform
population genetics analyses under Linux and Windows. Molecular Ecology Resources 10:564–567DOI 10.1111/j.1755-0998.2010.02847.x.
Folmer O, Black M, Hoeh W, Lutz R, Vrijenhoek R. 1994.DNA primers for amplification of
mitochondrial cytochrome c oxidase subunit I from diverse metazoan invertebrates.Molecular Marine Biology and Biotechnology3(5):249–299.
Geller JB, Darling JA, Carlton JT. 2010.Genetic perspectives on marine biological invasions.
Annual Review of Marine Science2:367–393DOI 10.1146/annurev.marine.010908.163745.
Godwin LS. 2003.Hull fouling of maritime vessels as a pathway for marine species invasions to
the Hawaiian Islands.Biofouling19:123–131DOI 10.1080/0892701031000061750.
Govindarajan AF, Halanych KM, Cunningham CW. 2005.Mitochondrial evolution and
phylogeography in the hydrozoanObelia geniculata(Cnidaria).Marine Biology146(2):213–222
DOI 10.1007/s00227-004-1434-3.
Guindon S, Gascuel O. 2003.A simple, fast and accurate method to estimate large phylogenies by
Harley CDG. 2011. Climate change, keystone predation, and biodiversity loss.Science 334:1124–1127DOI 10.1126/science.1210199.
Jennings RM, Shank TM, Mullineaux LS, Halanych KM. 2009.Assessment of the Cape Cod
phylogeographic break using the bamboo wormClymenella torquatareveals the role of regional water masses in dispersal.Journal of Heredity100(1):86–96DOI 10.1093/jhered/esn067.
Jensen JL, Bohonak AJ, Kelley ST. 2005.Isolation by distance, web service.BMC Genetics
6:13Available athttp://ibdws.sdsu.edu/DOI 10.1186/1471-2156-6-13.
Jones SJ, Southward AJ, Wethey DS. 2012.Climate change and historical biogeography of the
barnacleSemibalanus balanoides.Global Ecology and Biogeography21:716–724
DOI 10.1111/j.1466-8238.2011.00721.x.
LandschoffJ, Lackschewitz D, Kesy K, Reise K. 2013.Globalization pressure and habitat change:
Pacific rocky shore crabs invade armored shorelines in the Atlantic Wadden Sea.Aquatic Invasions8(1):77–87DOI 10.3391/ai.2013.8.1.09.
Lang WH, Ackenhusen-Johns A. 1981. Seasonal species composition of barnacle larvae
(Cirripedia: Thoracica) in Rhode Island waters, 1977–1978.Journal of Plankton Research 3(4):567–575DOI 10.1093/plankt/3.4.567.
Larkin MA, Blackshields G, Brown NP, Chenna R, McGettigan PA, McWilliam H, Valentin F,
Wallace IM, Wilm A, Lopez R, Thompson JD, Gibson TJ, Higgins DG. 2007.Clustal W and
Clustal X version 2.0.Bioinformatics23:2947–2948DOI 10.1093/bioinformatics/btm404.
Librado P, Rozas J. 2009.DnaSP v5: A software for comprehensive analysis of DNA polymorphism
data.Bioinformatics25:1451–1452DOI 10.1093/bioinformatics/btp187.
Masters BC, Fan V, Ross HA. 2011.Species Delimitation—a Geneious plugin for the exploration
of species boundaries.Molecular Ecology Resources11:154–157
DOI 10.1111/j.1755-0998.2010.02896.x.
Miller KM, Blower SM, Hedgecock D, Roughgarden J. 1989.Comparison of larval and adult
stages ofChthamalus dalliandChthamalus fissus(Cirripedia: Thoracica).Journal of Crustacean Biology9(2):242–256DOI 10.2307/1548504.
Moyle LC. 2006.Correlates of genetic differentiation and isolation by distance in 17 congeneric
Silene species.Molecular Ecology15(4):1067–1081DOI 10.1111/j.1365-294X.2006.02840.x.
Pappalardo P, Pringle JM, Wares JP, Byers JE. 2014.The location, strength, and mechanisms
behind marine biogeographic boundaries of the east coast of North America.Ecography 38:001–010DOI 10.1111/ecog.01135.
Perry AL, Low PJ, Ellis JR, Reynolds JD. 2005.Climate change and distribution shifts in marine
fishes.Science308:1912–1915DOI 10.1126/science.1111322.
Rosenberg NA. 2007.Statistical tests for taxonomic distinctiveness from observations of
monophyly.Evolution61:317–323DOI 10.1111/j.1558-5646.2007.00023.x.
Sorte CJB, Williams SL, Carlton JT. 2010.Marine range shifts and species introduction:
comparative spread rates and community impacts.Global Ecology and Biogeography19:303–316
DOI 10.1111/j.1466-8238.2009.00519.x.
Sotka EE, Wares JP, Barth JA, Grosberg RK, Palumbi SR. 2004.Strong genetic clines and
geographical variation in gene flow in the rocky intertidal barnacleBalanus glandula.Molecular Ecology13:2143–2156DOI 10.1111/j.1365-294X.2004.02225.x.
Southward AJ. 1991.Forty years of changes in species composition and population density of
Sumner FB. 1909.On the occurrence of the littoral barnacleChthamalus stellatus(Poli) at Woods Hole, Mass.Science30:373–374DOI 10.1126/science.30.768.373.
Sunday JM, Bates AE, Dulvy NK. 2012.Thermal tolerance and the global redistribution of
animals.Nature Climate Change2:686–690DOI 10.1038/nclimate1539.
Valentine JW. 1966.Numerical analysis of marine molluscan ranges on the extratropical
north-eastern Pacific shelf.Limnology and Oceanography11:198–211DOI 10.4319/lo.1966.11.2.0198.
Wares JP. 2001.Patterns of speciation inferred from mitochondrial DNA in North American
Chthamalus(Cirripedia: Balanomorpha: Chthamaloidea).Molecular Phylogenetics and Evolution18(1):104–116DOI 10.1006/mpev.2000.0857.
Wares JP, Cunningham CW. 2005.Diversification before the most recent glaciation inBalanus
glandula.The Biological Bulletin208(1):60–68DOI 10.2307/3593101.
Wares JP, Pankey MS, Pitombo F, Daglio LZ, Achituv Y. 2009.A “shallow phylogeny” of shallow
barnacles (Chthamalus).PLoS ONE4(5):e5567DOI 10.1371/journal.pone.0005567.
Wells HW. 1966.Barnacles of the northeaster Gulf of Mexico.Quarterly Journal of the Florida
Academy of Science29(2):81–95.
Wethey DS. 1984.Sun and shade mediate competition in the barnacles Balanus and Chthamalus:
a field experiment.Biological Bulletin167:176–185DOI 10.2307/1541346.
Wethey DS. 2002.Biogeography, competition, and microclimate: the barnacleChthamalus fragilis
in New England.Integrative and Comparative Biology42:872–880DOI 10.1093/icb/42.4.872.
Wu TH, Tsang LM, Chan BK, Chu KH. 2014.Cryptic diversity and phylogeography of the
island-associated barnacleChthamalus moroin Asia.Marine EcologyDOI 10.1111/maec.12146.
Zacherl D, Gaines SD, Lonhart SI. 2003.The limits to biogeographical distributions: insights
from the northward range extension of the marine snail,Kelletia kelletii(Forbes, 1852).Journal of Biogeography30(6):913–924DOI 10.1046/j.1365-2699.2003.00899.x.
Zakas C, Binford J, Navarrete SA, Wares JP. 2009.Restricted gene flow in Chilean barnacles
reflects an oceanographic and biogeographic transition zone.Marine Ecology Progress Series 394:165–177DOI 10.3354/meps08265.
Zardus JD, Hadfield MG. 2005.Multiple origins and incursions of the Atlantic barnacle
Chthamalus proteusin the Pacific.Molecular Ecology14(12):3719–3733
DOI 10.1111/j.1365-294X.2005.02701.x.
Zullo VA. 1963.A preliminary report on systematics and distribution of barnacles (Cirripedia)