Application of Selection Mapping to Identify Genomic
Regions Associated with Dairy Production in Sheep
Beatriz Gutie´rrez-Gil1*, Juan Jose Arranz1, Ricardo Pong-Wong2, Elsa Garcı´a-Ga´mez1, James Kijas3,
Pamela Wiener2
1Dpto. Produccio´n Animal, Universidad de Leo´n, Leo´n, Spain,2The Roslin Institute and R(D)SVS, University of Edinburgh, Roslin, Midlothian, United Kingdom,3Animal, Food and Health Sciences, CSIRO, Brisbane, Australia
Abstract
In Europe, especially in Mediterranean areas, the sheep has been traditionally exploited as a dual purpose species, with income from both meat and milk. Modernization of husbandry methods and the establishment of breeding schemes focused on milk production have led to the development of ‘‘dairy breeds.’’ This study investigated selective sweeps specifically related to dairy production in sheep by searching for regions commonly identified in different European dairy breeds. With this aim, genotypes from 44,545 SNP markers covering the sheep autosomes were analysed in both European dairy and non-dairy sheep breeds using two approaches: (i) identification of genomic regions showing extreme genetic differentiation between each dairy breed and a closely related non-dairy breed, and (ii) identification of regions with reduced variation (heterozygosity) in the dairy breeds using two methods. Regions detected in at least two breeds (breed pairs) by the two approaches (genetic differentiation and at least one of the heterozygosity-based analyses) were labeled as core candidate convergence regions and further investigated for candidate genes. Following this approach six regions were detected. For some of them, strong candidate genes have been proposed (e.g.ABCG2, SPP1), whereas some other genes designated as candidates based on their association with sheep and cattle dairy traits (e.g. LALBA, DGAT1A) were not associated with a detectable sweep signal. Few of the identified regions were coincident with QTL previously reported in sheep, although many of them corresponded to orthologous regions in cattle where QTL for dairy traits have been identified. Due to the limited number of QTL studies reported in sheep compared with cattle, the results illustrate the potential value of selection mapping to identify genomic regions associated with dairy traits in sheep.
Citation:Gutie´rrez-Gil B, Arranz JJ, Pong-Wong R, Garcı´a-Ga´mez E, Kijas J, et al. (2014) Application of Selection Mapping to Identify Genomic Regions Associated with Dairy Production in Sheep. PLoS ONE 9(5): e94623. doi:10.1371/journal.pone.0094623
Editor:Bernhard Kaltenboeck, Auburn University, United States of America ReceivedNovember 19, 2013;AcceptedMarch 19, 2014;PublishedMay 1, 2014
Copyright:ß2014 Gutie´rrez-Gil et al. This is an open-access article distributed under the terms of the Creative Commons Attribution License, which permits unrestricted use, distribution, and reproduction in any medium, provided the original author and source are credited.
Funding:The authors gratefully acknowledge support from the Spanish Ministry of Economy and Competitiveness (Project AGL2009-07000), Institute Strategic Grant funding from the UK Biotechnology and Biological Sciences Research Council (BBSRC) and the financial support of the European Science Foundation through the GENOMIC-RESOURCES Exchange Grant awarded to Beatriz Gutierrez (EX/3723). BGG is funded through the Spanish ‘‘Ramo´n y Cajal’’ Programme from the Spanish Ministry of Economy and Competitiveness (State Secretariat for Research, Development and Innovation). The funders had no role in study design, data collection and analysis, decision to publish, or preparation of the manuscript.
Competing Interests:The authors have declared that no competing interests exist. * E-mail: [email protected]
Introduction
Since their domestication 8 000–9 000 years ago (reviewed by [1]), sheep (Ovis aries) have been used by humans for the production of wool, meat and milk. Adaptation to very different geographic and climatic conditions and the specialization for specific characteristics have resulted in a phenotypically highly diverse species. The first documented modifications to sheep by human-imposed selection had taken place by the time that illustrations and records first appeared c. 3 000 BC and primarily concerned morphological and coat colour traits with the initial major morphological changes including reduction in the length of the legs, lengthening of the tail and alteration of horn shape [2]. Initially, sheep were kept solely for meat, milk and skins. Archaeological evidence suggests that selection for woolly sheep may have begun around 6000 BC.
Dairy sheep are mainly found in Europe, especially in Mediterranean areas, where they have been traditionally exploited as a dual purpose species, with income from both meat and milk. Sheep milk has a higher solid content than cow or goat milk,
which means that it is particularly suited to processing into cheese. Historically, most sheep milk has been produced by multipurpose local breeds with low-to-medium milk yields and raised under traditional husbandry conditions [3]. More recently, moderniza-tion of husbandry methods and the establishment of breeding schemes focused on milk production have led to the development of ‘‘dairy breeds’’, facilitated by the implementation of quantitative genetics-based breeding and the use of artificial insemination [2]. The market for sheep milk and sheep dairy products appears to be growing, even in those countries without a history of sheep dairying [4].
Selection sweep mapping strategies, in which regions of the genome are identified that show patterns consistent with positive selection, can be used as a complementary approach to linkage mapping and genome-wide association study (GWAS) analysis to identify regions of the genome that influence important traits in livestock. Various methods have been applied to livestock and other domesticated animals, with the aim of identifying genomic regions with characteristics that reflect the influence of selection: extended low diversity haplotypes [5], overall low heterozygosity
(e.g. [6,7]), specific diversity patterns [8], extreme allele frequen-cies [9] and between-breed differentiation [10,11,12]. Because of their well-documented selection pressures and highly-developed genetic resources, domesticated animal species also provide a valuable resource with the potential to identify the molecular pathways underlying phenotypic traits through the use of selection mapping approaches [10,13].
To perform a search for signatures of selection related to dairy production in sheep, we used genotypes obtained with theIllumina OvineSNP50 BeadChip(Illumina Inc., San Diego, CA) for a number of European breeds genotyped within the framework of the Sheep HapMap Project [14]. These breeds include several selected primarily for dairy production and others not used for dairy. In order to specifically target regions under dairy-related selection and not related to other traits that may have been under selection in the sheep populations, only selection signatures commonly identified in different European dairy breeds were considered. We applied two approaches for the detection of selection sweeps: (i) we looked for regions with extreme genetic differentiation between each dairy breed and a closely related non-dairy breed, and (ii) we looked for regions of the genome with reduced heterozygosity in the dairy breeds using two methods. We then searched for candidate genes that could be selection targets within the regions that were identified in multiple breeds and using multiple analysis methods. For these regions we also looked for correspondence with previously reported QTL related to dairy production traits in cattle or sheep. Although the selection history of dairy cattle is quite different from that of dairy sheep, in particular because breeding schemes in sheep are focused on more localized (and in many cases isolated) breeds than the global dairy cattle population, comparison of our results with studies in cattle allowed us to evaluate whether some of the same regions/genes show evidence of selection in both dairy sheep and dairy cattle.
Materials and Methods
Data
Samples. We analysed a subset of the dataset generated in the Ovine HapMap project [14], which included 5 dairy and 5 non-dairy sheep breeds (Table 1).
Genotypes. After an initial quality control procedure de-scribed in detail elsewhere [14], this dataset provides the genotypes of 49,034 SNPs (using theIllumina OvineSNP50 BeadChip) distrib-uted across the 26 autosomal ovine chromosomes and chromo-some X (only one of the markers genotyped belongs to chromosome Y). Markers were filtered to exclude loci assigned to unmapped contigs. The analyses reported here focused on the remaining 44,545 of these SNP located on autosomes. The positions of the markers according to the Sheep Genome Assembly v2.0 (update September 2011) were used for the analyses.
Selection Sweep Mapping Analysis Methods
(i) Genetic differentiation: Pair-wise FST calculations.
In order to search for genomic regions that have been under divergent selection in dairy and non-dairy breeds, we examined genetic differentiation across the genome for five breed pairs. The selection of sheep breeds to serve as non-dairy partners for non-dairy breeds was based on the shortest divergence time estimates reported by the Sheep HapMap project (based on the extent of haplotype sharing and correlation of linkage disequilibrium values; Supplementary Information Figure S10 and Figure 3 in [14]), and close relationships according to additional Principal Component
Analyses (PCA) performed in a selection of breeds (described in detail in File S1).
The following pairs of breeds of European ancestry were considered in the differentiation analysis:
a. Chios (Greek, dairy)vsSakiz (Turkey, non-specialized) b. Churra (Spanish, dairy)vsOjalada (Spanish, meat)
c. Comisana (Italian, dairy)vs Australian Poll Merino (Austra-lian, originated in southwest Europe, wool)
d. East Friesian Brown (highly specialized dairy) vs Finnsheep (Finland, primary wool, more recently used as a meat producing breed)
e. Milk Lacaune (French, highly specialized dairy)vsAustralian Poll Merino (Australian, originated in southwest Europe, wool)
f. Milk Lacaune (French, highly specialized dairy) vs Meat Lacaune (French, meat)
For each of these pairs, unbiased estimates of Weir and Cockerham’s FST[15], a measure of genetic differentiation, were
calculated as functions of variance components, as detailed in Akey et al. [16]. This type of approach to selection mapping, exploiting between-breed allele frequency differences, has been applied in studies of humans [16] and domesticated animals [10,11,12,17,18] where it has been demonstrated to be effective in identifying genes that are associated with breed differentiation. (ii) Reduced diversity: Observed heterozygosity.For all
the breeds included in the pair-wise FST calculations,
observed heterozygosity (ObsHtz) was calculated for each SNP marker. This approach has previously been applied in selection mapping studies of chickens [6,7], pigs [19] and dogs [20].
(iii) Reduced diversity: Regression analysis for detec-tion of regions with asymptotic heterozygosity patterns.For all the breeds included in the pair-wise FST
calculations, tests of significant asymptotic relationships between heterozygosity and distance from a test position were performed across the genome based on the approach of Wiener and Pong-Wong [8]. This method detects regions with patterns of variation consistent with positive selection: an asymptotic increase in marker variation (heterozygosity;y) with increasing distance (x) from a selected locusy=A+B Rx (where R is the asymptotic rate of increase; B is the difference between heterozygosity at the test position and the asymptotic level; A is the asymptotic level of heterozygosity). For each regression (performed in Genstat, [21]), we recorded the parameters of the asymptotic regression, their standard errors, the significance level associated with the regression (p) and the variance explained by the curve. Positive and increasing regressions (0,R,1, B,0) were considered as being in the direction predicted by positive selection. Analysis of simulated data suggests improved precision of this selection mapping approach compared to an alternative haplotype-based method as well as robustness to demographic influences [8].
Protocols for Selection Mapping Analyses
In order to determine appropriate parameters for the above-mentioned analyses, we investigated their behaviour on a test genomic region encompassing the myostatin (GDF-8) gene, which is known to have been under selection in the Texel breed (details in File S2).
Window/bracket sizes. Based on the analysis of the myostatin gene (File S2), window and bracket sizes for the three methods were established. For the differentiation and reduced heterozygosity analyses, FSTand ObsHtz values, respectively, were Selection Signatures in Dairy Sheep
averaged across sliding windows of 9 SNPs (FST-9SNPW,
ObsHtz-9SNPW). For the regression analysis, the test position was moved every 50 Kb across each chromosome and all markers within 10 Mb of this position (10 Mb-bracket size) were considered in the asymptotic regression. A –log(p) value was determined for each test position.
Identification of selection signals by individual methods. Evidence of positive selection was interpreted for window estimates in the extreme of the empirical distributions, as suggested by Akey et al. [10,16] and employed in various subsequent studies (e.g. [11,13]. Specifically, we considered the positions showing signatures of selection as the top 0.5th percent of the distributions for differentiation (FST) and asymptotic regression
(–log(p), for regressions in the predicted direction) or the bottom 0.5th percent for observed heterozygosity. Based on the results of the analysis of the myostatin gene (File S2), a selected ‘‘region’’ was defined as the range of positions within 2 Mb of each other showing evidence of selection by any of the three methods. An additional criterion for selected regions was that they were identified in at least two breed pairs, for FST, or two dairy breeds,
for heterozygosity-based methods (with distances up to 2 Mb allowed between the regions identified for different breeds). For genetic differentiation, we further required that regions of extreme FSTmust be detected in at least two different pairs of dairy –
non-dairy breeds that did not share a common breed (e.g. top regions found only in the Milk Lacaune-Australian Poll Merino and Comisana-Australian Poll Merino but not in other studied pairs were not included in the list of differentiated regions). By requiring at least two breeds (or breed pairs) for the initial identification of candidate regions for each methodology, this selection mapping strategy will not identify dairy gene variants occurring in only one breed.
Criteria for Identification of Regions with Shared Selection Signals
Based on the selected ‘‘regions’’ identified by the individual methods through the overlapping of at least two breeds or breed pairs, and taking into account that the FST-based method is
expected to specifically target traits relevant for dairy production, whereas signals detected by heterozygosity-based methods may not be specific for dairy-related selection, we defined a ‘‘convergent
candidate region’’ (CCR) as one where a signal was identified by the pair-wise FST comparison and at least one of the reduced
heterozygosity methods. Hence, a CCR was labelled where there was overlap between the position ranges of the candidate regions identified by the genetic differentiation methodology and at least one of the two heterozygosity-based methods, such that each CCR was associated with a region identified in at least two breeds (breed pairs) and using at least two different methods.
Identification of Candidate Genes within CCR Regions
We identified the genes mapping to the end of each CCR using the genome browser of the sheep genome reference sequence (v2.0; http://www.livestockgenomics.csiro.au/cgi-bin/gbrowse/ oarv2.0/) and identified the corresponding orthologous regions in the bovine genome (Cow (UMD3.1) using Ensembl (http:// www.ensembl.org/Bos_taurus/Info/Index). A systematic extrac-tion of all the annotated genes contained within the orthologous genomic ranges in cattle was performed using Biomart (www. biomart.org). Subsequently, an exhaustive search was performed for candidate genes previously linked to cattle dairy traits [22]. In addition, genes not included in this database but reported as candidate genes in the literature in relation to milk production or dairy-related traits were also identified. We also looked for correspondence with genes for which signatures of selection have been reported in studies of dairy cattle [23,24,25] and sheep [14,26].
We evaluated correspondence of the CCR with QTL reported for milk production and other functional traits related to dairy production in sheep (based on the SheepQTL database, http:// www.animalgenome.org/cgi-bin/QTLdb/OA/index). We also examined overlap between the CCR and QTL influencing milk-related traits, mastitis and other functional traits milk-related to dairy production in cattle (based on the CattleQTL database; http:// www.animalgenome.org/cgi-bin/QTLdb/BT/index), positioned on the bovine genome reference sequence (UMD_version 3.1).
Results
Regions Identified by Individual Methods
Genetic differentiation. The level and range of the top 0.5% of FSTvalues averaged in sliding windows of 9 SNPs (FST
-9SNPW) varied among the five breed pairs (Figure 1). The lowest Table 1.Breeds included in the present study.
Group Breed name
Number of
samples Aptitude
Dairy Chios 23 High milk production
Churra 96 Double purpose breed
(milk and lamb production
Comisana 24 Highly-specialized dairy breed
East Friesian Brown 39 Highly-specialized dairy breed
Milk Lacaune 103 Highly-specialized dairy breed
Non-dairy Australian Poll Merino 98 Meat production
Meat Lacaune 78 Meat production
Ojalada 24 Meat production
Sakiz 22 Triple-purpose (milk, meat, wool)
Finnsheep 99 Primary used for wool production;
more recently used for meat production. The classification established into Dairy and Non-dairy groups are presented together with some details about the breed aptitude. doi:10.1371/journal.pone.0094623.t001
Selection Signatures in Dairy Sheep
genome-wide differentiation within a pair was found, as expected, for the Milk Lacaune-Meat Lacaune pair (0.076), whereas the highest levels of genetic differentiation were found for the East Friesian Brown-Finnsheep pair (0.752, for the 9SNP-window centered on marker OAR3_185527791) (Table 2).
Twenty-eight genomic regions distributed across 15 autosomes were identified in at least two dairy-non-dairy breed pairs (Table S1, where a reference number has been given to each of them: FST-CandidateRegionX, FST-CRX). The largest number of FST
-based candidate regions per chromosome was found on OAR3 (5 regions). The length of the FST-based candidate regions varied
from 0.215 Mb (OAR3, FST-CR8) to 9.211 Mb (OAR6, FST
-CR14).
Reduced observed heterozygosity in dairy breeds. Fifty-five regions showing reduced observed heterozygosity (ObsHtz-CR1–ObsHtz-CR55) in more than one dairy breed were found across 21 of the 26 autosomes (Table S2; where a non-dairy breed showed reduced heterozygosity in the same region, this is also indicated). Eight of the candidate regions found in dairy breeds covered intervals larger than 3 Mb. The largest was that on OAR13 (ObsHtz-CR42; 56.061–63.781 Mb), followed by one on OAR6 (ObsHtz-CR27:34.576–41.863 Mb), while the smallest region was a single window centered on marker on OAR2 (ObsHtz-CR9; 211.205 Mb). A normalized observed heterozy-gosity (NObsHtz) (based on that introduced by Rubin et al. [6]) was also calculated for all breeds analysed, again averaged in 9-SNP windows. There were no regions in the extreme lower end of the distribution (NObsHtz,-6) in the dairy breeds although the region on OAR6 (ABCG2gene region) had a value of25.99 for the Meat Lacaune breed.
Regression analysis for detection of regions with asymptotic heterozygosity patterns in dairy breeds. Three regions ranging in size from 0.1 to 4.0 Mb were
identified with asymptotic heterozygosity patterns (bracket size = 10 Mb) in two or more dairy breeds (RegBrack10-CR1– RegBrack10-CR3) (Table 3, where a non-dairy breed showed reduced heterozygosity in the same region, this is also indicated). The myostatin analysis suggested that a bracket size of 10 Mb was optimal for identification of selected region. However, because this is a new methodology, the results obtained for the dairy breeds with all three bracket sizes (5-, 10- and 20-Mb) were compared to aid interpretation of results based on this approach. The number of candidate regions identified in at least two dairy breeds decreased with increasing bracket size. For the 5-Mb bracket size, a total of seven candidate regions were observed, whereas only three and one candidate regions were observed for the 10- and 20-Mb bracket sizes, respectively (Table 3). The region commonly identified through the use of all three bracket sizes was located on OAR6 (RegBrack5-CR6, RegBrack10-CR2 and RegBrack20-CR1). The signal for this region was seen in Milk Lacaune (34.875–38.875 Mb, 10-Mb bracket) and Comisana (36.125– 38.325 Mb, 10-Mb bracket) breeds. In addition, the Meat Lacaune variety also showed extreme results for this region for all three bracket sizes (34.375–38.175, 10-Mb bracket). Another region on OAR2 (104 Mb) was identified by both of the smaller bracket sizes.
Some of the inconsistencies between bracket sizes were investigated further. In several cases, where regions were not found in the top 0.5% of –log(p) values for a particular bracket size, they did appear in the top 1% of –log(p) values. Regarding the region on OAR20 (,50 Mb) that was identified in two dairy
breeds using the 10-Mb bracket size (RegBrack10-CR3, Table 3) but not using the 5-Mb bracket size: for Churra, positions within this region appeared within the top 1st percent of –log(p) values for the smaller bracket size but did not reach the threshold for the top
Figure 1. Genome-wide distribution of FSTvalues for the six analysed breed pairs.The level of genetic differentiation, measured by FST, was estimated within each dairy – non-dairy breed pair1, and averaged in sliding windows of 9 SNPs (FST-9SNPW) across the genome: The horizontal line indicates the top 0.5.th percent threshold considered for the FST-distributions. These raw results were used to identify FST-based candidate regions (FST-CRs) when overlapping significant selection signals (allowing gaps up to 2-Mb) were identified between different pairs.1Breed pairs analysed: a) Chios-Sakiz, b) Churra-Ojalada; c) Comisana-Australian Poll Merino; d) East Friesian Brown -Finnsheep, e) Milk Lacaune-Australian Poll Merino f) Milk Lacaune-MeatLacune.
doi:10.1371/journal.pone.0094623.g001
Selection Signatures in Dairy Sheep
0.5th percent, whereas for Milk Lacaune, this region was identified using both bracket sizes. Regarding the five regions (Table 3) that were identified in two dairy breeds using 5-Mb bracket size but not 10-Mb, four of the regions were in the top 1st percent of –log(p) values for one or both of the dairy breeds. Two of these regions (RegBrack5-CR1 and RegBrack5-CR3) were found in Chios and Churra, however, while these regions were found for Churra using both the 5- and 10-Mb bracket sizes, for the 10-Mb bracket size, the top –log(p) values for Chios were dominated by regions on OAR13 and OAR16, which did not feature in the top –log(p) values for the other dairy breeds. Thus, these Chios-specific signals may have overwhelmed the more general dairy signals for the larger bracket size in this breed. The region labelled as RegBrack5-CR4, identified at ,75 Mb on OAR3 for Churra
and Milk Lacaune using the 5-Mb bracket size, did not feature in the top 1st percent of the –log(p) values for the 10-Mb bracket for either of these breeds. It is worth noting that regions identified using one bracket size but not a smaller one could reflect more recent selection events for which the pattern of heterozygosity with respect to distance from the selected locus appears linear rather than asymptotic in the smaller bracket.
Convergence Candidate Regions (CCR)
Six candidate regions were detected in at least two breed pairs by the pair-wise FSTcomparison and in at least two breeds by a
heterozygosity-based analysis (Table 4). One of the regions, CCR3 (OAR6:30.367–41.863 Mb), was identified by all three analysis methods. The orthologous bovine genomic regions corresponding to each of the CCR are shown in Table 5. A total of 406 genes (positional candidate genes) were found in these six core regions (Table S3). There were three other regions where an FST-CR
signals was less than 1 Mb from an ObsHtz-CR signal (OAR3:18.648–19.360 Mb, OAR3:167.711–168.959 Mb, and OAR13:95.801–98.865 Mb) but because they did not overlap, they were not considered as CCR.
Among the positional candidate genes extracted from the six CCRs, a search for functional candidates for milk production traits and mastitis was performed by comparison with the genes included in the Ogorevc et al. [22] database of cattle candidate genes for dairy-related traits. A total of 13 genes were common to these two lists (Table 5). The evidence for relationships with milk production traits for these genes was based on the different aspects considered in the Ogorevc et al. [22] database such as gene expression studies related to mammary gland (TFAP2C, FAM110A, CD82, ABCG2) or mastitis (BID, MAFF, AHCY), mouse model studies in which gene knockouts or expression of transgenes resulted in phenotypes associated with the mammary gland
(FKBP4, MKL1, POFUT1, CHUK) and association studies of milk production traits (ABCG2, SPP1, SCD).
In order to assess whether there was greater overlap between the CCRs and candidate genes than expected by chance, we repeatedly (1 000 000 times) assigned regions of the same length as the CCR at random positions on the bovine genome and checked overlap with all candidate genes from the Ogorevc et al. [22] database that could be positioned on the bovine genome (423 genes). Although we could not do the test with the sheep genome as the annotation is not as complete, the length of the sheep and bovine genomes is very similar and so we expect this test would provide similar results. The number of overlaps between CCR regions and candidate genes based on a model with random positioning of CCR regions was very different from the actual situation: only 8.4% of the replicates contained any overlaps and the maximum number of overlaps was 4.
Some other positional candidate genes not included in the Ogorevc et al. [22] database were identified as possible functional candidates based on their known biological function and an exhaustive literature review of reported signatures of selection in dairy cattle (Table 5). There was also correspondence between the CCR and QTL previously reported in dairy cattle and sheep for milk production traits or functional traits related to dairy production (Table 5), which is discussed below.
Discussion
This study reports the first genome-wide analysis of regions under selection for dairy traits in sheep. For this we have used the valuable information generated in the International Sheep HapMap project [14], through the use of theIllumina OvineSNP50 BeadChip,to evaluate a range of European sheep breeds that have been selected for dairy production. With the aim of identifying the signatures of selection specifically due to dairy selection and not related to other traits that may have been selection target in the studied sheep populations (e.g. coat colour), we also included in our study other non-dairy European sheep breeds. Furthermore, because of the difficulties in distinguishing between the effects caused in the genome by genuine selective sweeps rather than demographic events such as population expansion or contraction [16], we used three different analysis methods and only considered for further exploration those six regions identified by the FST
-based method and at least one of the two heterozygosity--based methodologies.
Candidate Dairy Selection Regions
Based on the convergence among the three different analysis methods, six core regions were identified as candidate regions under positive selection in dairy sheep. Based on the comparison Table 2.Maximum and minimum of the 0.005 top averaged pair-wise FSTvalues in sliding windows of 9 SNPs (FST-9SNPW)
estimated for the pairs considered in the present work to detect selection signals in dairy sheep.
Breed pair Min. FST-9SNPW Max. FST-9SNPW
Chios-Sakiz 0.2799 0.4392
Churra-Ojalada 0.1345 0.2193
Comisana-Australian Poll Merino 0.1781 0.4873
East Friesian Brown-Finnsheep 0.3212 0.7515
Milk Lacaune-Australian Poll Merino 0.1547 0.3071
Milk Lacaune-Meat Lacaune 0.0757 0.1449
doi:10.1371/journal.pone.0094623.t002
Selection Signatures in Dairy Sheep
Table 3.Initial candidate regions identified on the basis of the regression analysis performed for detection of regions with asymptotic heterozygosity patterns in at least two of the dairy breeds (top 0.5% results for bracket sizes 5, 10 and 20 Mb).
Analysis Regression-CR Chr.
Dairy breed
Start position (Mb)
End position (Mb)
Non-dairy breed
Start position (Mb)
End position (Mb)
Regression top 0.5% bracket 5 Mb
RegBrack5-CR1 2 Churra 51.810 54.110 Ojalada 52.610 53.760
Chios 52.860 53.410
RegBrack5-CR2 2 Milk Lacaune 104.360 104.560 Meat Lacaune 104.360 104.510
Churra 104.460 Australian Poll Merino 104.410 104.460
RegBrack5-CR3 2 Churra 122.360 122.910
Chios 123.010 123.210
RegBrack5-CR4 3 Milk Lacaune 75.192 75.292
Churra 75.292
RegBrack5-CR5 3 Milk Lacaune 168.742 168.892 Australian Poll Merino 168.692 168.942
Churra 168.792 168.892 Meat Lacaune 168.792 168.892
RegBrack5-CR6 6 Milk Lacaune 35.475 36.625 Meat Lacaune 34.725 36.775
Comisana 36.625 37.325 Australian Poll Merino 35.975 37.175
RegBrack5-CR7 11 Milk Lacaune 18.380 18.530 Ojalada 18.430 18.530
Churra 18.430 18.480 Meat Lacaune 18.430 18.480
Regression top 0.5% bracket 10 Mb
RegBrack10-CR1 2 Milk Lacaune 104.410 Ojalada 104.410 104.460
Churra 104.460 104.510 Meat Lacaune 104.410 104.460
Finnsheep 104.460 104.510
RegBrack10-CR2 6 Milk Lacaune 34.875 38.875 Meat Lacaune 34.3747 38.175
Comisana 36.125 38.325 Australian Poll Merino 35.525 38.225
RegBrack10-CR3 20 Churra 49.971 50.171
Milk Lacaune 50.071
Regression top 0.5% bracket 20 Mb
RegBrack20-CR1 6 Milk Lacaune 34.825 38.525 Meat Lacaune 34.375 38.175
Comisana 35.525 38.825 Australian Poll Merino 34.975 38.175
We also indicate if the same signature of selection was also identified in the non-dairy breeds. doi:10.1371/journal.pone.0094623.t003
Selection
Signatures
in
Dairy
Sheep
PLOS
ONE
|
www.ploson
e.org
6
May
2014
|
Volume
9
|
Issue
5
|
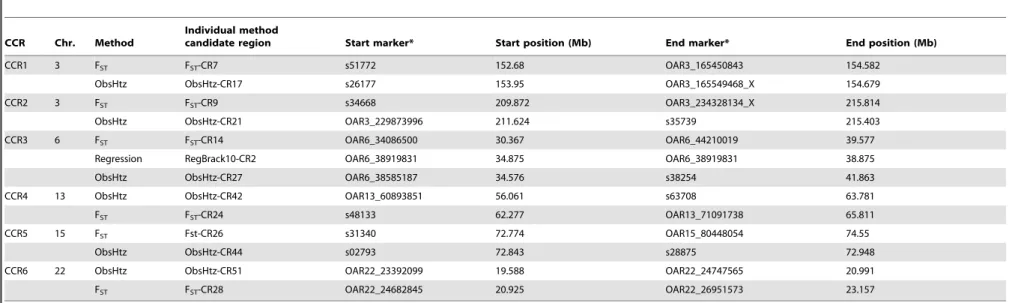
Table 4.Convergence candidate regions (CCR) for selection signals identified for dairy sheep.
CCR Chr. Method
Individual method
candidate region Start marker* Start position (Mb) End marker* End position (Mb)
CCR1 3 FST FST-CR7 s51772 152.68 OAR3_165450843 154.582
ObsHtz ObsHtz-CR17 s26177 153.95 OAR3_165549468_X 154.679
CCR2 3 FST FST-CR9 s34668 209.872 OAR3_234328134_X 215.814
ObsHtz ObsHtz-CR21 OAR3_229873996 211.624 s35739 215.403
CCR3 6 FST FST-CR14 OAR6_34086500 30.367 OAR6_44210019 39.577
Regression RegBrack10-CR2 OAR6_38919831 34.875 OAR6_38919831 38.875
ObsHtz ObsHtz-CR27 OAR6_38585187 34.576 s38254 41.863
CCR4 13 ObsHtz ObsHtz-CR42 OAR13_60893851 56.061 s63708 63.781
FST FST-CR24 s48133 62.277 OAR13_71091738 65.811
CCR5 15 FST Fst-CR26 s31340 72.774 OAR15_80448054 74.55
ObsHtz ObsHtz-CR44 s02793 72.843 s28875 72.948
CCR6 22 ObsHtz ObsHtz-CR51 OAR22_23392099 19.588 OAR22_24747565 20.991
FST FST-CR28 OAR22_24682845 20.925 OAR22_26951573 23.157
A CCR region was defined when overlapping selection regions identified by the genetic differentiation analysis (in at least two breed pairs), averaged for a 9-SNP window size (FST), and by at least one of the two heterozygosity-based analysis methodologies (in at least two breeds): observed heterozygosity, averaged for a 9-SNP window size (ObsHtz), and regression analysis, considering a 10-Mb bracket size (Regression).
*For Regression results, this indicates the closest marker to the Start/End position.
doi:10.1371/journal.pone.0094623.t004
Selection
Signatures
in
Dairy
Sheep
PLOS
ONE
|
www.ploson
e.org
7
May
2014
|
Volume
9
|
Issue
5
|
to predicted overlaps for randomly-positioned CCR, these regions were highly enriched for candidate dairy-related loci. We discuss further the CCR regions that meet specific criteria.
Region Identified by all the Three Methods
– CCR3 (OAR6:30.367–41.863 Mb). The three analysis methods identified this region of positive selection in the first half of OAR6, which includes the ABCG2 (ATP-binding cassette, sub-family G (white), member 2) and SPP1 (osteo-pontin) genes (at 36.565–36.610 Mb and 36.708–36.720 Mb respectively), and is orthologous to the region of the bovine genome on BTA6 where several QTL for milk production traits have been reported (See Table 5 for QTL identifier number in the CattleQTLdb). This region also includes the FAM13A(family with sequence similarity 13, member A) gene, which has been shown to be associated with mastitis in Jersey cows [27]. In dairy cattle, strong selection signals have previously been identified [23,24] in the proximity of the ABCG2gene, which harbors one of the few causal mutations or Quantitative Trait Nucleotide (QTN) described in livestock species [28]. In sheep, a selection signal in theABCG2region has also been identified in a work focused on Altamurana sheep, where differences in allele frequencies were compared for animals with high and low milk yields [29].
The identification of a selection signature in this region of OAR6 by the pair-wise FSTcomparison (FST-CR14) was based on
four breed pairs. For the Milk Lacaune-Australian Poll Merino and the Comisana-Australian Poll Merino pairs, the signal of genetic differentiation involved the ABCG2 and SPP1 genes, whereas for the two other pairs, the identified signal was upstream (Chios-Sakiz; OAR6:30.367–30.380 Mb) or downstream (Churra-Ojalada; OAR6:39.316–39.577 Mb) of these genes. The ObsHtz analysis showed a selection signal (ObsHtz-CR27) for Milk Lacaune, Comisana and Churra dairy breeds, and also for three non-dairy breeds, Australian Poll Merino, Meat Lacaune and Ojalada. Both Lacaune breeds showed low values of ObsHtz extended for long intervals (3.48 and 5.47 Mb for Milk Lacaune and Meat Lacaune, respectively). With regard to the regression-based analysis, this region was the only one detected in multiple breeds for all three bracket sizes (for Milk Lacaune, Comisana, Meat Lacaune and Australian Poll Merino breeds).
Together these results suggest that CCR3 shows selection for dairy traits in several sheep breeds, and that this signal may be related to the documented effects of theABCG2[28] orSPP1[30] genes on milk production and lactation regulation, respectively. The selection signal positioned directly atABCG2 andSPP1was only seen in the highly specialized breeds Milk Lacaune and Comisana (FST, ObsHtz and Regression). In other dairy breeds for
which the selection is more recent and less efficient (e.g. Churra and Chios), selection may not have substantially altered the frequencies of favoured alleles at these loci, which could explain why a strong selection signal directly at these genes was not observed. A previous study in Churra sheep found suggestive associations between theABCG2gene and milk fat percentage and milk yield [31] while no studies to date have tested the effects of these two genes on dairy traits in the Lacaune and Comisana breeds.
The results reported in the current study also suggest that in this region of OAR6 there could be a selection signal related to meat specialized breeds such as Meat Lacaune, Australian Poll Merino and Ojalada. In this regard, it is worth noting that several QTL for growth and carcass traits have been described in the orthologous bovine region [32,33]. Hence, analogous to the observations in the
orthologous bovine region, this region of the sheep genome may influence both dairy and meat production traits.
Regions with High FSTin more than Two Breed Pairs This criterion was used to highlight the CCR regions where the genetic differentiation analysis showed a particularly strong indication of a dairy selection signature, as this is possibly the most effective analysis performed in this study to detect regions specifically affected by dairy selection rather than selection acting on non-dairy-related traits. With the aim of establishing stringent criteria we consider in this section only those regions where more than two breed pairs (none sharing a common breed, as explained above) showed the selection signal. In addition to CCR3 discussed above, this category also includes the following two regions: – CCR1 (OAR3:152.680 to 154.679 Mb).This core region,
for which the FST-selection signals were identified for the
Churra-Ojalada, Comisana-Australian Poll Merino and East Friesian Brown-Finnsheep pairs, includes HMGA2 (high mobility group AT-hook 2), a gene associated with human stature [34]. The identification of this gene as a selection target was also found in an analysis of dogs with divergent stature [10]. The bovine region orthologous to CCR1 includes QTL related to stature (with theHMGA2gene suggested as a possible causative locus [35]) and rump length (see Table 5). Hence, the CCR1 signal identified in the present study might indicate selection targeting sheep body conformation traits. This hypothesis would agree with the differences in body size between some of the pairs involved in this selection signal. For example, the adult weight of Australian Poll Merino is significantly higher than that of Lacaune and Comisana; Churra and East Friesian Brown are also generally heavier than their comparison breeds.HGMA2has also been suggested as a candidate gene related to ear size and shape in both pigs and dogs [36,37], thus further investigation is required to assess whether there are differences in ear morphology between the sheep breeds showing this selection signal. Although the confidence interval of a QTL for protein percentage reported in Churra sheep [38] (Table 5) overlaps with CCR1, the causal mutation for that QTL was later found in the LALBA gene [39], which maps outside of this core region.
– CCR2 (OAR3:209.872–215.814 Mb). Four candidate genes in the orthologous bovine region to this CCR (distal end of BTA5) were identified from the Ogorevc et al. [22] database. Two of them were related to mastitis in a disease-induced mouse-model study [40]: BID (BH3 interacting domain death agonist), which is a pro-apoptotic induced gene, and MAFF (v-maf avian musculoaponeurotic fibrosarcoma oncogene homolog F), which is related to cell proliferation. The identification of two other genes as candidates for dairy traits in this regions, FKBP4 (FK506 binding protein 4) and MLK1 (mixed lineage protein kinase), was also based on mouse model studies (http://www.informatics.jax.org/). Furthermore, FKBP4is expressed in breast cancer tissue (Genes-to-Systems Breast Cancer database, G2SBC, http://www.itb.cnr.it/ breastcancer//index.html) andMLK1is expressed in epithelial tumor cell lines of colonic, breast and esophageal origin [41]. QTL effects described in the bovine region orthologous to CCR2 (on BTA5) influence milk production and some conformation traits (Table 5). A previous study in dairy cows found a selection signature in this region [23]. In that case, the gene displaying the strongest evidence of selection wasCD163, which is involved in the innate immune response and clearance of plasma hemoglobin [42]. This region also includes the gene coding for CSNK1e(casein-kinase epsilon), which is related to
Selection Signatures in Dairy Sheep
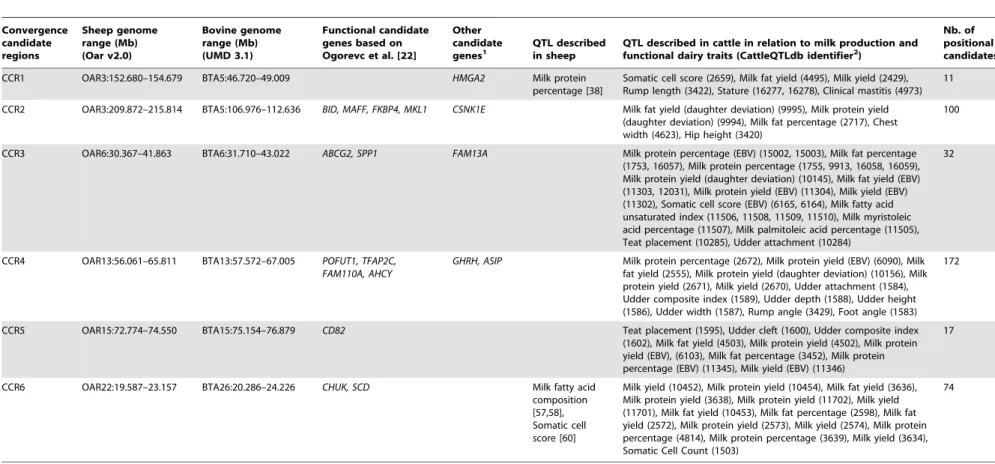
Table 5.Convergence candidate regions (CCR) for ovine dairy selection sweeps identified in this study.
Convergence candidate regions
Sheep genome range (Mb) (Oar v2.0)
Bovine genome range (Mb) (UMD 3.1)
Functional candidate genes based on Ogorevc et al. [22]
Other candidate genes1
QTL described in sheep
QTL described in cattle in relation to milk production and functional dairy traits (CattleQTLdb identifier2)
Nb. of positional candidates3
CCR1 OAR3:152.680–154.679 BTA5:46.720–49.009 HMGA2 Milk protein
percentage [38]
Somatic cell score (2659), Milk fat yield (4495), Milk yield (2429), Rump length (3422), Stature (16277, 16278), Clinical mastitis (4973)
11
CCR2 OAR3:209.872–215.814 BTA5:106.976–112.636 BID, MAFF, FKBP4, MKL1 CSNK1E Milk fat yield (daughter deviation) (9995), Milk protein yield (daughter deviation) (9994), Milk fat percentage (2717), Chest width (4623), Hip height (3420)
100
CCR3 OAR6:30.367–41.863 BTA6:31.710–43.022 ABCG2, SPP1 FAM13A Milk protein percentage (EBV) (15002, 15003), Milk fat percentage
(1753, 16057), Milk protein percentage (1755, 9913, 16058, 16059), Milk protein yield (daughter deviation) (10145), Milk fat yield (EBV) (11303, 12031), Milk protein yield (EBV) (11304), Milk yield (EBV) (11302), Somatic cell score (EBV) (6165, 6164), Milk fatty acid unsaturated index (11506, 11508, 11509, 11510), Milk myristoleic acid percentage (11507), Milk palmitoleic acid percentage (11505), Teat placement (10285), Udder attachment (10284)
32
CCR4 OAR13:56.061–65.811 BTA13:57.572–67.005 POFUT1, TFAP2C, FAM110A, AHCY
GHRH, ASIP Milk protein percentage (2672), Milk protein yield (EBV) (6090), Milk fat yield (2555), Milk protein yield (daughter deviation) (10156), Milk protein yield (2671), Milk yield (2670), Udder attachment (1584), Udder composite index (1589), Udder depth (1588), Udder height (1586), Udder width (1587), Rump angle (3429), Foot angle (1583)
172
CCR5 OAR15:72.774–74.550 BTA15:75.154–76.879 CD82 Teat placement (1595), Udder cleft (1600), Udder composite index
(1602), Milk fat yield (4503), Milk protein yield (4502), Milk protein yield (EBV), (6103), Milk fat percentage (3452), Milk protein percentage (EBV) (11345), Milk yield (EBV) (11346)
17
CCR6 OAR22:19.587–23.157 BTA26:20.286–24.226 CHUK, SCD Milk fatty acid
composition [57,58], Somatic cell score [60]
Milk yield (10452), Milk protein yield (10454), Milk fat yield (3636), Milk protein yield (3638), Milk protein yield (11702), Milk yield (11701), Milk fat yield (10453), Milk fat percentage (2598), Milk fat yield (2572), Milk protein yield (2573), Milk yield (2574), Milk protein percentage (4814), Milk protein percentage (3639), Milk yield (3634), Somatic Cell Count (1503)
74
The interval of each region (in bp) is based on the sheep genome reference sequence v2.0 (http://www.livestockgenomics.csiro.au/cgi-bin/gbrowse/oarv2.0/). The corresponding orthologous bovine genomic intervals are based on the bovine genome reference sequence UMD 3.1 (http://www.ensembl.org/Bos_taurus/Info/Index). The positional candidate genes that map within the bovine candidate range and that are included as candidate genes for milk production and mastitis traits in the database provided by Ogorevc et al. [22] are indicated as functional candidate genes. The affected trait and CattleQTLdb reference for previously reported cattle QTL that map within the bovine candidate genomic regions and that influence milk production traits or other functional traits related to dairy production are also indicated.
1Other candidate genes. This category includes two types of genes:
–Those that although are not included in the Ogorevc et al. [22] database may be considered as candidate genes in relation to milk production related traits based on other studies. –Those that are likely to be related to non-dairy selection signatures such as morphological traits and coat colour features.
2CattleQTLdb identifier: Search reference number at http://www.animalgenome.org/cgi-bin/QTLdb/BT/search to find complete details about QTL reported in the orthologous region of the corresponding sheep CCR identified in
this study.
3Number of positional candidate genes extracted from the orthologous bovine region using BioMart for each of the labeled CCRs (based on Table S3).
doi:10.1371/journal.pone.0094623.t005
Selection
Signatures
in
Dairy
Sheep
PLOS
ONE
|
www.ploson
e.org
9
May
2014
|
Volume
9
|
Issue
5
|
circadian rhythms. In a study of the human milk fat globule transcriptome,CSNK1ewas identified as one of the nine core ‘‘clock’’ genes that showed differential expression over a 24-hour period time in lactating women [43]. Of particular interest is the finding that this OAR3 region was labelled as a CCR based on the overlap of candidate regions detected by pair-wise-FSTin the pairs including the most highly specialized
dairy breeds (Milk Lacaune, Comisana and East Friesian Brown), which may have been under selection for circadian-related adaptation of milk production to intensive milking.
Other Regions
– CCR4 (OAR13:56.061 to 65.811 Mb). Several genes included in this core candidate region were also found in the Ogorevc et al. [22] database. The POFUT1 (protein O-fucosyltransferase 1) gene plays a crucial role in Notch signaling, which regulates mammary stem cell function and luminal cell-fate commitment [44]. TFAP2C (transcription factor AP-2 gamma; activating enhancer binding protein 2 gamma) is involved in mammary development, differentiation, and oncogenesis playing a critical role in gene regulation in hormone responsive breast cancer [45], and AHCY (adeno-sylhomocysteinase) has been suggested as potentially involved in mastitis defense based on its disease-associated expression [46]. Another positional candidate gene for this core region is the GHRH (growth hormone-releasing hormone) gene. Al-though the direct relationship of this gene and milk production traits is still not clear [47,48], its link to the somatotropic axis and other functional candidate genes included in the Ogorevc et al. [22] database (GH, GHR, GHRHR) suggest a possible influence, directly or indirectly, on dairy traits. In addition to these candidate dairy-related genes, theASIP(Agoutı´ signaling protein) gene is also located in this region (OAR13:63.028– 63.033 Mb). This gene has a major role in metabolic processes [49] and coat colour pigmentation in mammalian species [50]. Based on the known associations between polymorphisms at this gene and coat colour patterns in sheep [51] it is possible that the identified selection signal results from coat colour selection. In their analysis of the complete HapMap dataset, Kijas et al. [14] also identified a selection signal nearASIP. – CCR5 (OAR15:72.774–74.550 Mb).This region included
the CD82 (CD82 molecule) gene, which is included in the Ogorevc et al. [22] database based on its expression in the mammary gland. This gene is included in the group of genes that regulate breast cancer metastasis, as a metastasis suppressor [52]. Whereas no studies have reported an association of this gene with dairy related traits, there is a functional relationship between CD82and ERBB3 (Receptor tyrosine-protein kinase erbB-3) [53], which is related to normal mammary development [54].
– CCR6: (OAR22:19.588–23.157 Mb).Two functional can-didate genes [22] were found in this region:SCD(Stearoyl-CoA desaturase) and CHUK(conserved helix-loop-helix ubiquitous kinase). The SCD gene encodes a multifunctional complex enzyme important in the cellular biosynthesis of fatty acids. Several studies in different populations of dairy cattle have reported associations between polymorphisms at this gene with milk production traits [55] and milk fatty acid composition [56]. In sheep, theSCDgene has been suggested as positional and functional candidate gene for a QTL identified on OAR22 in a Sarda6Lacaune back-cross population for the ratio of conjugated linoleic acid to vaccenic acid in sheep milk [57]. A later study in Churra sheep also identified a QTL on OAR22 for the same trait close to theSCDposition, although various
analyses questioned this gene as responsible for the identified effect [58]. TheCHUKgene is listed in the Ogorevc et al. [22] database because it is expressed in breast cancer tumors and is a regulator of mammary epithelial proliferation [59]. Accord-ing to the SheepQTL database, this region includes a QTL for somatic cell score described in an Awassi x Merino cross population [60] and it has also been identified as a selection signal by the analysis of allele frequency differences between animals with divergent milk yields reported in Altamurana sheep [29].
The bovine region orthologous to CCR6 (on BTA26), overlaps with a region showing a selection signature in dairy cattle [23], where theC10ORF76 (chromosome 10 open reading frame 76) gene was associated with the strongest selection signal. Although there is not a reported association of this gene with milk production traits, it is expressed in the mammary gland and it is altered in breast cancer cells, based on the G2SBC database.
Inconsistencies between this Study and Previous QTL and Selection Mapping Studies of Cattle and Sheep
Although all six CCR overlapped with QTL for dairy traits in sheep or cattle (Table 4 and discussed above), our study did not identify a selection signal close to several genes previously associated with dairy traits in sheep and cattle. For example, there were no CCR near the LALBA (alpha-lactalbumin) gene (OAR3:137 Mb), where a particular variant has been recently been proposed to explain a QTL for milk protein percentage identified in Churra sheep [39]. The lack of signal near this QTL in the FSTanalysis of Churra vs Ojalada is consistent with the fact
that the causative mutation is still segregating in Churra, which allowed its identification as QTL.
In addition, in their analysis of the complete Sheep HapMap dataset, Kijas et al. [14] reported positive selection surrounding thePRLRgene, which is associated with milk traits in dairy cattle [61]. In our study, although none of the CCRs map to OAR16, where this gene is located (39.250–39.284 Mb), it is worth mentioning that this gene is included in the interval of FST
-CR27 (OAR16:37.347–40.850 Mb), which was identified based on the signals detected in three breed pairs involving the most specialized dairy breeds in this study (East Friesian Brown-Finnsheep, Milk Lacaune-Australian Poll Merino and Comisana-Australian Poll Merino) but was not classified a CCR due to the lack of selection signals from the heterozygosity-based methods. Other regions that were detected by the FST-pairwise comparison
for many breed pairs but that were not supported by the heterozygosity-based methods were found on OAR2 (FST
-CR2:52.346–53.409 Mb) and OAR9 (57.363–60.849 Mb). Whereas the first region does not include any functional candidate gene for dairy traits, the region in OAR9 included three genes related to the metabolism of fatty acids (FABP4, FABP5 and FABP9). FABP4 and FABP5 have been shown to be highly expressed in the mammary gland during lactation [62] and significant associations have been found betweenFABP4and fatty acid composition of bovine milk [63]. We acknowledge that one or more of these regions may represent false negatives that were missed by our stringent selection signal criteria. However, because of the difficulty in linking a sweep signal to a given phenotype, we suggest that application of stringent criteria in this type of study is an appropriate option to avoid reporting long lists of candidate regions based on spurious results.
We also did not find evidence of selection on some major candidate genes for milk production for which selection signatures have been observed in cattle (e.g. DGAT1: OAR9:13.534– 13,543 Mb; GHR: OAR16:32.068–32.231). In contrast to our Selection Signatures in Dairy Sheep
results, theGHR gene (BTA20) showed the largest difference in sliding window average allele frequencies in a study of divergent selection between dairy and beef cattle [24], and also showed significant extended haplotype homozygosity [25]. With regard to DGAT1, evidence of selection has also been identified when comparing dairy and beef cattle breeds [24].
In their study, Kijas et al. [14] also identified a strong selection signal on OAR10, associated to the presence or absence of horns and close to the gene responsible of the polled phenotype,RXFP2 (relaxin/insulin-like family peptide receptor 2) gene (OAR10:27.602–27.646 Mb). In our study, a selection signal was identified in this region based on the ObsHtz-based method (ObsHtz-CR33:24.856–27.897 Mb, for the dairy breeds Comi-sana, Churra and Milk Lacaune) and the FST-based method
(OAR10:25.540–28.983 Mb). However because the FST signal
was due only to the two breed pairs involving the Australian Poll Merino, this was not labelled as FST-CR.
Apart from the overlap between two CCRs (CCR3 on OAR6 and CCR6 on OAR22) with the selection signals identified in Altamurana sheep for milk yield [29], we did not find evidence of selection near the signals reported for this Italian breed. This lack of correspondence may derive from breed-specific signals reported for Altamurana.
Comparison of the Three Selection Mapping Methods
From our point of view, the analysis method that involved the estimation of pair-wise FST for pairs of related breeds showing
divergent specialization (one for milk production, one not) should be the most powerful analysis in terms of identifying selection specifically related to dairy production. Four out of the 28 candidate regions showing multiple pair-wise FST signals were
detected in four out of the six breed pairs (FST-CR3, FST-CR9,
FST-CR14 and FST-CR18). Of these, FST-CR3 (OAR2:52.346–
53.409 Mb) was not included as a CCR due to the lack of consistency with the ObsHtz or 10-Mb Regression analysis results, although the same region was identified by the 5-Mb Regression analysis (RegBrack5-CR1 in Table 3) in two dairy breeds (Churra and Chios) and one non-dairy breed (Ojalada). Given that no functional candidate genes from the Ogorevc et al. [22] database were found in the orthologous bovine region, it is possible that this region underlies breed differentiation not directly related to dairy traits.
Among the 55 candidate regions identified based on the ObsHtz analysis (ObsHtz-CRs, Table S2), there were only twelve regions showing a signal in dairy but not in non-dairy breeds (ObsHtz-CR3, 7, 8, 10, 12, 25, 28, 29, 31, 41, 45 and 55). Considering that the background genome has been previously selected for meat, maternal characteristics, and other traits, whereas the development of dairy breeds is much more recent, it would be expected that the selection signals specifically related to dairy traits would not be seen in the other breeds (although Meat Lacaune could be an exception). However, as none of these regions showing a reduction of heterozygosity exclusively in dairy breeds were identified by the FST-based method, they were not
identified as final core CCRs (and thus are not present in Table 4). Although the evidence linking these regions to dairy-related selection is weaker than for the CCRs, we performed an additional search for functional candidate genes and dairy-related QTL mapping within these regions, similar to that performed in the eight identified CCRs (see Table S4). A total of 118 genes were extracted from the orthologous bovine regions of these eleven dairy-breed-limited regions of reduced heterozygosity (data not shown). Among them, only the HSPD1 (Heat shock 60 kDa protein 1; chaperonin) gene is included in the Ogorevc et al. [22]
database, due to its expression in the mammary gland. This gene is also included in the G2SBC database although no studies have reported so far its association with milk production traits. Interestingly, among the dairy QTL detected in these regions there is greater overlap with ovine QTL for milk production traits (Table S4) than for the list of core CCRs. Hence, these regions identified exclusively by ObsHtz could include gene variants occurring in individual dairy breeds, as it is the case for many of the QTL described in sheep.
There were eight regions that overlapped between those identified by FST (including a full set of regions, including those
that contained pairs with the same breeds that were removed from Table S1) and ObsHtz (out of 35 and 55, respectively). The explanation for the higher number of regions identified by ObsHz is that the regions identified using FST were slightly larger
(incorporated more windows) than those identified using ObsHtz. There were far fewer signals identified using the Regression approach than either FSTor ObsHtz. Although the top (or bottom)
0.5th percent results were considered as signals of selection for all methods, the Regression method first filtered out the intervals with non-significant and non-asymptotic regression patterns, and thus the total number of eligible intervals was substantially reduced compared to the other approaches in which the distribution of FST/ObsHtz values for all markers (with the exception of those on
the very ends of the chromosomes) was considered. Thus the implementation of Regression in this study was more stringent than the other methods.
The regions identified by the Regression method showed greater overlap with ObsHtz than FST, which is not surprising
since both Regression and ObsHtz are designed to detect regions with a reduction in diversity. For the 10-Mb bracket size (results considered for the identification of CCR), all three regions identified with the Regression approach overlapped with those identified with ObsHtz while one out of the three, RegBrack10-CR2, overlapped with the regions identified with FST, and was
therefore considered as CCR (CCR3).
Conclusions
The results reported here provide a genome-wide map of selection signatures in the dairy sheep genome. The six core candidate regions identified are likely to influence traits of economic interest in dairy sheep production and can be considered as starting points for future studies aimed at the identification of the causal genetic variation underlying these signals. For some of these regions, strong candidate genes have been proposed (e.g. ABCG2, SPP1), whereas some other genes designated as candidates based on their association with sheep and cattle dairy traits (e.g.LALBA, DGAT1A) were not associated with a detectable sweep signal. Discrepancies between selection signals in dairy sheep and cattle may be explained either by statistical or biological factors, such as the limited statistical power of the analyses to identify effects of small magnitude or the fact that the genetic architecture of milk production and dairy-related traits substantially differs from sheep to cattle and also between the different breeds of dairy sheep, which have been subjected to different levels of selection pressure. Many of the identified regions corresponded to orthologous regions in cattle where QTL for dairy traits have been identified. Due to the limited number of QTL studies reported in sheep compared with cattle, the results illustrate the potential value of the study of selection signatures to uncover mutations with potential effects on quantitative dairy sheep traits. Additional studies are needed to confirm and refine the results reported here. To this end, the recent availability of the Selection Signatures in Dairy Sheep
high-density ovine chip (700 K) will provide a valuable tool to perform more powerful and precise selection mapping studies.
Supporting Information
Table S1 Candidate regions for signatures of selection identified on the basis of the pair-wise FSTanalysis.
(PDF)
Table S2 Candidate regions identified based on reduced heterozygosity signals identified in at least two of the dairy breeds. (PDF)
Table S3 List of all genes from the orthologous bovine genome regions corresponding to the six convergence candidate regions (CCR) for dairy selection sweeps identified in this study, extracted using the Biomart tool (http://www.biomart.org/).
(XLSX)
Table S4 Candidate regions identified by the analysis based on observed heterozygosity (ObsHtz-CR), averaged in sliding win-dows of 9 SNPs (ObsHtz-9SNPW), that were exclusively detected in dairy breeds.
(PDF)
File S1 Summary of the criteria for selection of breeds to be included in the study, including the results of a Principal Component Analysis (PCA) performed with the initial set of breeds considered.
(PDF)
File S2 Summary of the results of the analysis per-formed in this work in relation to the myostatin (GDF-8) gene region.These results were evaluated to establish criteria for the analyses performed to detect dairy selection signatures in the dairy breeds.
(PDF)
Acknowledgments
We thank Samantha Wilkinson for providing R scripts.
Author Contributions
Conceived and designed the experiments: BGG PW JJA. Analyzed the data: BGG PW. Contributed reagents/materials/analysis tools: RPW JJA EGG JK. Wrote the paper: BGG PW JJA RPW JK. Conceived the study: BGG PW.
References
1. Legge T (1996) The beginning of caprine domestication. In: Harris DR, editor. The Origins and Spread of Agriculture and Pastoralism in Eurasia. Smithsonian New York: Institution Press. pp. 238–262.
2. Maijala K (1997) Genetic aspects of domestication, common breeds and their origin. In: Piper L, Ruvinsky A, editors. The genetics of sheep. Oxford: CAB Int. pp. 539–564.
3. Barillet F (1997) Genetics of milk production. In: Piper L, Ruvinsky A, editors. The genetics of sheep. Oxford: CAB Int. pp. 539–564.
4. Ida A, Vicovan PG, Radu R, Vicovan A, Cutova N, et al. (2012) Improving the milk production at the breeds and populations of sheep from various geo-climatic zones. Lucra˘ri S¸tiint¸ifice - Seria Zootehnie 57: 17.
5. Gibbs RA, Taylor JF, Van Tassell CP, Barendse W, Eversole KA, et al. (2009) Genome-wide survey ofSNP variation uncovers the genetic structure of cattle breeds. Science 324: 528–532.
6. Rubin CJ, Zody MC, Eriksson J, Meadows JR, Sherwood E, et al. (2010) Whole-genome resequencing reveals loci under selection during chicken domestication. Nature 464: 587–591.
7. Elferink MG, Megens HJ, Vereijken A, Hu X, Crooijmans RP et al. (2012) Signatures of selection in the genomes of commercial and non-commercial chicken breeds. PLoS One 7: ve32720.
8. Wiener P, Pong-Wong R (2011) A regression-based approach to selection mapping. J Hered 102: 294–305.
9. Stella A, Ajmone-Marsan P, Lazzari B, Boettcher P (2010) Identification of selection signatures in cattle breeds selected for dairy production. Genetics 185: 1451–1461.
10. Akey JM, Ruhe AL, Akey DT, Wong AK, Connelly CF, et al. (2010) Tracking footprints of artificial selection in the dog genome. Proc Natl Acad Sci USA 107: 1160–1165.
11. Vaysse A, Ratnakumar A, Derrien T, Axelsson E, Rosengren Pielberg G, et al. (2011) Identification of genomic regions associated with phenotypic variation between dog breeds using selection mapping. PLoS Genet 10: e1002316. 12. Ai H, Huang L, Ren J (2013) Genetic diversity, linkage disequilibrium and
selection signatures in chinese and Western pigs revealed by genome-wide SNP markers. PLoS One 8: e56001.
13. Boyko AR, Quignon P, Li L, Schoenebeck JJ, Degenhardt JD, et al. (2010) A simple genetic architecture underlies morphological variation in dogs. PLoS Biol 8: e1000451.
14. Kijas JW, Lenstra JA, Hayes B, Boitard S, Porto Neto LR, et al. (2012a) Genome-wide analysis of the world’s sheep breeds reveals high levels of historic mixture and strong recent selection. PLoS Biol 10: e1001258.
15. Weir BS, Cockerham CC (1984) Estimating F-Statistics for the Analysis of Population Structure. Evolution 38: 1358–1370.
16. Akey JM, Zhang G, Zhang K, Jin L, Shriver MD (2002) Interrogating a high-density SNP map for signatures of natural selection. Genome Res 12: 1805– 1814.
17. Wilkinson S, Lu ZH, Megens HJ, Archibald AL, Haley C, et al. (2013) Signatures of diversifying selection in European pig breeds. PLoS Genet 9: e1003453.
18. Barendse W, Harrison BE, Bunch RJ, Thomas MB, Turner LB (2009) Genome wide signatures of positive selection: the comparison of independent samples and the identification of regions associated to traits. BMC Genomics 10: 178.
19. Rubin CJ, Megens HJ, Martinez Barrio A, Maqbool K, Sayyab S, et al. (2012) Strong signatures of selection in the domestic pig genome. Proc Natl Acad Sci USA. 109: 19529–19536.
20. Axelsson E, Ratnakumar A, Arendt ML, Maqbool K, Webster MT, et al. (2013) The genomic signature of dog domestication reveals adaptation to a starch-rich diet. Nature 495: 360–364.
21. Payne RW, Murray DA, Harding SA, Baird DB, Soutar DM (2007) GenStat for Windows (10th Edition) Introduction. Hemel Hempstead: VSN. International. 22. Ogorevc J, Kunej T, Razpet A, Dovc P (2009) Database of cattle candidate
genes and genetic markers for milk production and mastitis. Anim Genet 40: 832–851.
23. Flori L, Fritz S, Jaffre´zic F, Boussaha M, Gut I, et al. (2009) The genome response to artificial selection: a case study in dairy cattle. PLoS One 4: e6595. 24. Hayes BJ, Chamberlain AJ, Maceachern S, Savin K, McPartlan H, et al. (2009) A genome map of divergent artificial selection between Bos taurus dairy cattle and Bos taurus beef cattle. Anim Genet 40: 176–184.
25. Qanbari S, Pimentel EC, Tetens J, Thaller G, Lichtner P, et al. (2010) A genome-wide scan for signatures of recent selection in Holstein cattle. Anim Genet 41: 377–389.
26. Moradi MH, Nejati-Javaremi A, Moradi-Shahrbabak M, Dodds K G, McEwan JC (2012) Genomic scan of selective sweeps in thin and fat tail sheep breeds for identifying of candidate regions associated with fat deposition. BMC Genet 13: 10.
27. Kowalewska-Łuczak I, Kulig H (2013) Polymorphism of the FAM13A, ABCG2, OPN, LAP3, HCAP-G, PPARGC1A genes and somatic cell count of Jersey cows - Preliminary study. Res Vet Sci 94: 252–255.
28. Olsen HG, Nilsen H, Hayes B, Berg PR, Svendsen M, et al. (2007) Genetic support for a quantitative trait nucleotide in the ABCG2 gene affecting milk composition of dairy cattle. BMC Genet 8: 32.
29. Moioli B1, Scata` MC, Steri R, Napolitano F, Catillo G (2013) Signatures of selection identify loci associated with milk yield in sheep. BMC Genet 14: 76. 30. Sheehy PA, Riley LG, Raadsma HW, Williamson P, Wynn PC (2009) A
functional genomics approach to evaluate candidate genes located in a QTL interval for milk production traits on BTA6. Anim Genet 40: 492–498. 31. Garcı´a-Ferna´ndez M, Gutie´rrez-Gil B, Sa´nchez JP, Mora´n JA, Garcı´a-Ga´mez
E, et al. (2011) The role of bovine causal genes underlying dairy traits in Spanish Churra sheep. Anim Genet 42: 415–420.
32. Eberlein A, Takasuga A, Setoguchi K, Pfuhl R, Flisikowski K, et al. (2009) Dissection of genetic factors modulating fetal growth in cattle indicates a substantial role of the non-SMC condensin I complex, subunit G (NCAPG) gene. Genetics 183: 951–964.
33. Gutie´rrez-Gil B, Wiener P, Williams JL, Haley CS (2012) Investigation of the genetic architecture of a bone carcass weight QTL on BTA6. Anim Genet 43: 654–661.
34. Yang TL, Guo Y, Zhang LS, Tian Q, Yan H, et al. (2010) HMGA2 is confirmed to be associated with human adult height. Ann Hum Genet 74: 11–16. 35. Pryce JE, Hayes BJ, Bolormaa S, Goddard ME (2011) Polymorphic regions
affecting human height also control stature in cattle. Genetics 187: 981–984. 36. Li P, Xiao S, Wei N, Zhang Z, Huang R, et al. (2012) Fine mapping of a QTL
for ear size on porcine chromosome 5 and identification of high mobility group AT-hook 2 (HMGA2) as a positional candidate gene. Genet Sel Evol 44: 6.
Selection Signatures in Dairy Sheep
37. Boyko AR, Quignon P, Li L, Schoenebeck JJ, Degenhardt JD, et al. (2010) A simple genetic architecture underlies morphological variation in dogs. PLoS Biol 8: e1000451.
38. Gutie´rrez-Gil B, El-Zarei MF, Alvarez L, Bayo´n Y, de la Fuente LF et al. (2009) Quantitative trait loci underlying milk production traits in sheep. Anim Genet 40: 423–434.
39. Garcı´a-Ga´mez E, Gutie´rrez-Gil B, Sahana G, Sa´nchez JP, Bayo´n Y, et al. (2012) GWA analysis for milk production traits in dairy sheep and genetic support for a QTN influencing milk protein percentage in the LALBA gene. PLoS One 7: e47782.
40. Zheng J, Watson AD, Kerr DE (2006) Genome-wide expression analysis of lipopolysaccharide-induced mastitis in a mouse model. Infect Immun 74: 1907– 1915.
41. Dorow DS, Devereux L, Dietzsch E, De Kretser T (1993) Identification of a new family of human epithelial protein kinases containing two leucine/isoleucine-zipper domains. Eur J Biochem 213: 701–710.
42. Schaer DJ, Schaer CA, Buehler PW, Boykins RA, Schoedon G, et al. (2006) CD163 is the macrophage scavenger receptor for native and chemically modified hemoglobins in the absence of haptoglobin. Blood 107: 373–380. 43. Maningat PD, Sen P, Rijnkels M, Sunehag AL, Hadsell DL, et al. (2009) Gene
expression in the human mammary epithelium during lactation: the milk fat globule transcriptome. Physiol Genomics. 37: 12–22.
44. Bouras T, Pal B, Vaillant F, Harburg G, Asselin-Labat ML, et al. (2008) Notch signaling regulates mammary stem cell function and luminal cell-fate commitment. Cell Stem Cell 3: 429–441.
45. Woodfield GW, Chen Y, Bair TB, Domann FE, Weigel RJ (2010) Identification of primary gene targets of TFAP2C in hormone responsive breast carcinoma cells. Genes Chromosomes Cancer 49: 948–962.
46. Schwerin M, Czernek-Scha¨fer D, Goldammer T, Kata SR, Womack JE, et al. (2003) Application of disease-associated differentially expressed genes–mining for functional candidate genes for mastitis resistance in cattle. Genet Sel Evol 35 Suppl 1: S19–34.
47. Dybus A, Grzesiak W (2006) GHRH/HaeIII gene polymorphism and its associations with milk production traits in Polish Black-and-White cattle. Arch Tierz Dummerstorf 49: 434–438.
48. Szatkowskaac I, Dybusac A, Grzesiakab W, Jedrzejczakac M, Muszyn´skaac M (2009). Association between the growth hormone releasing hormone (GHRH) gene polymorphism and milk production traits of dairy cattle. J Appl Anim Res 36: 119–12.
49. Wolff GL, Roberts DW, Mountjoy KG (1999) Physiological consequences of ectopic agouti gene expression: The yellow obese mouse syndrome. Physiol Genomics 1: 151–163.
50. Bennett DC, Lamoreux ML (2003) The colour loci of mice–A genetic century. Pigment Cell Res 16: 333–344.
51. Norris BJ, Whan VA (2008) A gene duplication affecting expression of the ovine ASIP gene. Genome Res 18: 1282–1293.
52. Debies MT, Welch DR (2001) Genetic basis of human breast cancer metastasis. J Mammary Gland Biol Neoplasia 6: 441–451.
53. Odintsova E, Voortman J, Gilbert E, Berditchevski F (2003) Tetraspanin CD82 regulates compartmentalisation and ligand-induced dimerization of EGFR. J Cell Sci 116: 4557–4566.
54. Lahlou H, Mu¨ller T, Sanguin-Gendreau V, Birchmeier C, Muller WJ (2012) Uncoupling of PI3K from ErbB3 impairs mammary gland development but does not impact on ErbB2-induced mammary tumorigenesis. Cancer Res 72: 3080–3090.
55. Alim MA, Fan YP, Wu XP, Xie Y, Zhang Y, et al. (2012) Genetic effects of stearoyl-coenzyme A desaturase (SCD) polymorphism on milk production traits in the Chinese dairy population. Mol Biol Rep 39: 8733–8740.
56. Moioli B, Contarini G, Avalli A, Catillo G, Orru L, et al. (2007) Short communication: effect of stearoyl-coenzyme A desaturase polymorphism on fatty acid composition of milk. J Dairy Res 90: 3553–3558.
57. Carta A, Sechi T, Usai MG, Addis M, M Fiori, et al. (2006) Evidence for a QTL affecting the synthesis of linoleic conjugated acid cis-9, trans-11 from 11-c 18:1 acid on ovine chromosome 22. Proc. 8th World Congress on Genetics Applied to Livestock Production. Belo Horizonte, Brazil. Commun. no. 12–03. Instituto Prociencia, Belo Horizonte, Brazil.
58. Garcı´a-Ferna´ndez M, Gutie´rrez-Gil B, Garcı´a-Ga´mez E, Sa´nchez JP, Arranz JJ (2010) Detection of quantitative trait loci affecting the milk fatty acid profile on sheep chromosome 22: role of the stearoyl-CoA desaturase gene in Spanish Churra sheep. J Dairy Sci 93: 348–357.
59. Cao Y, Luo JL, Karin M (2007) IkappaB kinase alpha kinase activity is required for self-renewal of ErbB2/Her2-transformed mammary tumor-initiating cells. Proc Natl Acad Sci USA 104: 15852–15857.
60. Raadsma HW, Jonas E, McGill D, Hobbs M, Lam MK, et al. (2009). Mapping quantitative trait loci (QTL) in sheep. II. Meta-assembly and identification of novel QTL for milk production traits in sheep. Genet Sel Evol 41: 45. 61. Viitala S, Szyda J, Blott S, Schulman N, Lidauer M, et al. (2006) The role of the
bovine growth hormone receptor and prolactin receptor genes in milk, fat and protein production in Finnish Ayrshire dairy cattle. Genetics 173: 2151–2164. 62. Sumner-Thomson JM, Vierck JL, McNamara JP (2011) Differential expression
of genes in adipose tissue of first-lactation dairy cattle. J Dairy Sci 94: 361–369. 63. Nafikov RA, Schoonmaker JP, Korn KT, Noack K, Garrick DJ, et al. (200 Association of polymorphisms in solute carrier family 27, isoform A6 (SLC27A6) and fatty acid-binding protein-3 and fatty acid-binding protein-4 (FABP3 and FABP4) with fatty acid composition of bovine milk. J Dairy Sci 96: 6007–6021. Selection Signatures in Dairy Sheep