Misclassification Problem: Introducing Sensitivity and
Specificity as Error Measures
Claudia Lamina1, Friedhelm Bongardt2, Helmut Ku¨chenhoff3, Iris M. Heid1,2*
1Institute of Epidemiology, Helmholtz Zentrum Mu¨nchen – German Research Center for Environmental Health, Neuherberg, Germany,2Institute for Medical Information Processing, Biometry and Epidemiology, Ludwig-Maximilian University, Munich, Germany,3Institute for Statistics, Stablab, Ludwig-Maximilians University, Munich, Germany
Abstract
Background:Statistically reconstructing haplotypes from single nucleotide polymorphism (SNP) genotypes, can lead to falsely classified haplotypes. This can be an issue when interpreting haplotype association results or when selecting subjects with certain haplotypes for subsequent functional studies. It was our aim to quantify haplotype reconstruction error and to provide tools for it.
Methods and Results:By numerous simulation scenarios, we systematically investigated several error measures, including discrepancy, error rate, and R2, and introduced the sensitivity and specificity to this context. We exemplified several measures in the KORA study, a large population-based study from Southern Germany. We find that the specificity is slightly reduced only for common haplotypes, while the sensitivity was decreased for some, but not all rare haplotypes. The overall error rate was generally increasing with increasing number of loci, increasing minor allele frequency of SNPs, decreasing correlation between the alleles and increasing ambiguity.
Conclusions: We conclude that, with the analytical approach presented here, haplotype-specific error measures can be computed to gain insight into the haplotype uncertainty. This method provides the information, if a specific risk haplotype can be expected to be reconstructed with rather no or high misclassification and thus on the magnitude of expected bias in association estimates. We also illustrate that sensitivity and specificity separate two dimensions of the haplotype reconstruction error, which completely describe the misclassification matrix and thus provide the prerequisite for methods accounting for misclassification.
Citation:Lamina C, Bongardt F, Ku¨chenhoff H, Heid IM (2008) Haplotype Reconstruction Error as a Classical Misclassification Problem: Introducing Sensitivity and Specificity as Error Measures. PLoS ONE 3(3): e1853. doi:10.1371/journal.pone.0001853
Editor:Vincent Macaulay, University of Glasgow, United Kingdom
ReceivedOctober 30, 2007;AcceptedJanuary 23, 2008;PublishedMarch 26, 2008
Copyright:ß2008 Lamina et al. This is an open-access article distributed under the terms of the Creative Commons Attribution License, which permits unrestricted use, distribution, and reproduction in any medium, provided the original author and source are credited.
Funding:This work was supported by the DFG grant within the SFB-386 (‘Analysis of discrete structure’, project B10 ‘Genetic epidemiological methods: Analysis of haplotype risk structure’) and the NGFN grant PDN-S31T10.
Competing Interests:The authors have declared that no competing interests exist.
* E-mail: [email protected]
Introduction
Haplotypes have been the subject of considerable attention as they complement the information from the SNP (single nucleotide polymorphism) genotypes. When viewing the nucleotides of the two DNA strands as two long rows of code, we consider haplotypes to summarize the horizontal multi-locus information per strand while genotypes summarize the vertical information on a single locus across the two strands. There are several advantages of haplotypes: In regions of high linkage disequilibrium (LD), haplotype diversity is said to be limited resulting in only a few existing haplotypes and thus a gain in power for the analyses [1,2]. Multilocus haplotypes may capture the LD information in a gene better than methods based on single loci [3]. Furthermore, latent functional loci may be identified by haplotypes as they serve as multiallelic markers. Finally, the haplotype may represent the biologically functional genetic unit rather than the genotypes [4]. Haplotypes can thus provide additional information with respect
to association analysis and localization of complex disease genes [5], especially in the presence of multiple susceptibility alleles [6]. One draw-back of haplotypes is the fact that experimental derivation of haplotypes is still not practical for the large number of individuals in epidemiological studies, but has to be inferred statistically. The most frequently used methods for haplotype reconstruction are based either on the maximum likelihood-based expectation-maximization (EM) algorithm [7] or on a Bayesian framework incorporating the coalescent model [8,9]. The per-formance of the various reconstruction methods have already been compared by some groups on real or simulated datasets [8–12]. PHASE, for example, has been found to outperform other methods, if the data were generated by a coalescent model [8]. But clearly all methods involve a certain amount of error in the reconstructed haplotypes.
increasing number of loci. However, the MSE summarizes the error in the estimated haplotype frequencies rather than the error in the individuals’ haplotypes, which is of interest in haplotype association analyses. One commonly used error measure for the error in the individuals’ haplotypes is the error rate of which some authors have described selected aspects [8,10–12] . However, a systematic investigation of the error rate is still lacking. Furthermore, researchers are often interested in subjects carrying a specific haplotype and thus rather in the error in assigning this haplotype than in an error measure averaging across all haplotypes. Individual haplotypes are coded as trichotomous variables, which results in a straight-forward 363 misclassification problem. In association analysis models, misclassification in independent variables, in this case the haplotypes, are known to yield biased estimates [14,15]. The amount of bias depends on the magnitude of the error. If the corresponding 363 misclassification matrix is known, it completely describes the error mechanism and can be used for post-hoc adjustment of haplotype association analyses.
There are methods available, which do not infer individual haplotypes but instead use estimates of the distribution of haplotypes given the observed genotypes to estimate risk parameters within a likelihood framework ([16–21]). However, these methods are often limited to specific study types or modelling techniques. Inferred individual haplotypes provide the advantage of being easily adapted into the framework of generalized linear models and can thus be analyzed with standard statistical software. For haplotypes that are fairly well reconstructed, the analysis of inferred haplotypes is unbiased and is more powerful than the analysis based on expected haplotype probabilities [22]. For haplotypes with higher uncertainty in reconstruction, information of the misclassification probabilities can be used to correct association estimates, for example using the MC-SIMEX method [23].
However, downstream association analyses are not the only reason for inferring haplotypes. Haplotypes can also be used to put up phylogenetic trees or for selection of certain subjects in a study. Researchers in the need to select study subjects with specific haplotypes for subsequent in-depth functional studies use the haplotype assignment to individuals and rely on sufficient assignment certainty for subject selection.
For these reasons we think it is worthwhile to have a closer look at haplotype uncertainty with special emphasis on misclassification probabilities of individually inferred haplotypes.
Therefore, we aimed at a general understanding of the magnitude of haplotype reconstruction error in a systematic approach by simulations and analytical derivations. We applied various simulation scenarios including scenarios based on realistic haplotype distributions from our epidemiological study at hand. We present a systematic overview of error measures with focus on haplotype-specific error measures posing a classical misclassifica-tion problem and present the sensitivity and specificity as two intuitive measures. We outline analytical and simulation ap-proaches to quantify several error measures, describe the size and dependencies of these haplotype errors and show the impact on odds ratio estimates.
Methods
Notation and Definitions
LetLbe thenumber of lociandNthenumber of individuals. For each individual i= 1, ...,N, the vector Gi= (Gi1,...,GiL) denotes the
subject’s genotypes at theL loci,l= 1, ...L, with Gil indicating the
number of minor alleles at locuslfor individualiandGilM{0,1,2}.
Consequently, there are 3L possible values c= (c1,...,cL) for Gi.
There are M= 2L possible different haplotypesh1, ..., hM in the
population, the haplotypes of subjectican be written as a vector Hi= (Hi1,...,HiM), with eachHimindicatingthe true number of copies of
the haplotype hmof subjecti,m= 1, ...,M, andHimM{0,1,2}. Due to
the restriction P
m~1,...,M
Him~2, there are M
z1 2
possible
values g= (g1,..., gM) for Hi. Hi thus denotes the individual’s
haplotype pair (‘‘diplotype’’) and the variousgreflect all possible pairs. The number of different pairs actually appearing in a sample is further restricted by the correlation between the alleles at the loci. The effective number of loci,Leff, can be computed according
to Nyholt [24] taking this correlation into account. Note that the term ‘‘allele’’ and ‘‘haplotype’’ is not used completely consistent in the literature. We define analleleto be one of the different values on one chromosome at a SNP locus and haplotypes to be the combination of the alleles across several loci. The diploid human beings thus exhibit two alleles (at one SNP locus) and two haplotypes (across several SNP loci).
When statistically reconstructing haplotypes from genotypes, the reconstructed number of copies of each haplotypein subjectiis denoted as Hi*= (Hi1*,...,HiM*) being the vector of the expected values given
the observed genotypes Gi as estimated by a reconstruction
program: Hi*=E(Hi|Gi). As an unambiguous decision for a
haplotype pair is not always possible, the Him* move in a
continuous space,Him*M[0,2]. Themost probable or most likely number
of haplotypes Cim*is derived by categorizingHim*into the most likely
haplotype pair for each individual withCim*indicatingthe observed
number of copies of the haplotype hm, thus returning to the discrete
space,Cim*M{0,1,2}. They are also often denoted as individually
inferred haplotypes.
Haplotypes can be inferred unambiguously (i.e. without error) for subjects being heterozygous in less than two loci. Theambiguity fractionis the number of subjects being heterozygous for at least two loci,Namb, divided byN, which thus describes the proportion of the
sample where haplotype reconstruction error might occur. The frequencies of the haplotypes h1,..., hM in the sample are
denoted asf= (f1,...,fM) withfm~ P i~1,...,N
Him=2N,m= 1, ...,M,
1~ P
m~1,...,M
fm. The sampling error for estimating the frequency is
considered to be ignorable in large enough data sets. Analogously, the frequencies of the reconstructed haplotypes Hi* are denoted as
f*= (f1*,...,fM*).
Measures of the haplotype reconstruction error
The accuracy of haplotype reconstruction can be measured in different ways for different purposes. We propose a classification based on three characteristics: (1) The uncertainty across all haplotypes (1a, ‘‘overall error measure’’), versus the error in a specific haplotype (1b, ‘‘haplotype-specific error measure’’). (2) The uncertainty in a sample statistics (2a, i.e.: haplotype frequencies,fRf*) versus the uncertainty in individuals’ haplotypes
(2b). (3) To further differentiate 2b: The error made by using the expected number of haplotype copies, HRH* (3a), versus the
error made by using the most probable haplotype,HRC* (3b).
The measures are defined and related to the above stated classes in the following (for a summary, see Table 1):
Discrepancy. The discrepancy D is the average of the
differences between true and reconstructed haplotype frequencies, providing an ‘‘overall measure’’ of the error fRf* based on the
summary statisticsfinstead of the subjects’ haplotypes (class 1a,2a):
D~D f1,. . .,fM,f
1,. . .,f
M ~1 2 XM
m~1
fm{fm
A haplotype-specific discrepancy is given by Dm fm,fm
~
1 2 fm{fm
form= 1,...,M(class 1b,2a). The discrepancy is close to the mean squared error (MSE) [11,13], which is another way of averaging.
Error rate. The error rate among all individuals,
ERall~
Xn
i~1
1{ci
ð Þ=N, whereci~
0,Hi=Ci
1,Hi~Ci
,
is the proportion of subjects with falsely classified haplotypes. Another definition is the error rate restricted to the subjects with ambiguous reconstruction,ERamb, whereNambreplaces the N in the
denominator [8].ERalland ERamb are ‘‘overall measures’’ of the
errorHRC* (class 1a,2b,3b).
Proportion of explained variance,R2m. Rm2, defined as the
squared correlation betweenHimandHim*[25],m= 1, ...,M, is a
haplotype-specific measure for the errorHRH*(class 1b,2b,3a). It
is computed as the ratio of the haplotype variance explained by the genotypes, Var(Him*), to the variance of theBin(2, fm)-distributed
(true haplotype frequency), 2fˆm*(12fˆm*), assuming no error in the
haplotype frequency from reconstruction (fm=fm*).
Sensitivity and specificity. In the context of haplotypes,
sensitivity and specificity are defined as ‘‘the probability that a true carrier of a certain haplotype is classified as such’’ (sensitivity) and ‘‘the probability that a true non-carrier is classified as such’’ (specificity), respectively, form= 1, ..,M,
Snm~P C imw0jHimw0andSpm~P C im~0jHim~0:
Thus, 12Snm and 12Spmmeasure the ‘‘haplotype-specific error’’
HRC*(1b,2b,3b).
Misclassification probabilities. The error resulting from the
transition HRC* is a pure misclassification problem for a
tri-chotomous variable, which is described by a 363 misclassi-fication matrix consisting of the misclassimisclassi-fication probabilities pkl=P(Cim* =k|Him=l),k,l= 0,1,2. Assuming no genotyping error,
the subjects truly having two copies of a haplotype (true homozygous) as well as subjects with two copies of a haplotype in the reconstruction (observed homozygous) have always homozygous genotypes for all loci. These haplotypes can be reconstructed unambiguously and the misclassification probabilitiesp20,p21,p02,
andp12equal zero. The misclassification matrix is then completely
determined by sensitivity, specificity and the true haplotype probabilities or the observed haplotype probabilities (see Table 2).
Data
SNP data on numerous genes in a subsample of the population-based KORA study were available as examples. This sample of
704 individuals aged 55 to 74 years was a subset of the fourth survey (S4) of the KORA (Cooperative Research in the Region of Augsburg) study from 1999–2001 [26]. Genotypes were obtained via mass spectrometry (MALDI-TOF MS). The 8 genes in this investigation had been discussed as possible risk factors for diabetes, but had shown no or only a small association [27,28] : IL-18,IL-13,MIP1A,INS,IL-6,MCP1,TNFA, andCAPN10. We Table 1.Classification of measures for the haplotype reconstruction error.
Error in haplotype frequency Error in subject-specific haplotype Hi1
Overall measure Discrepancy (D) Error rate among all subjects (ERall)
Error rate among ambiguous subjects (ERamb)
Haplotype-specific measure Discrepancy per haplotype (Dm) Correlation between true and reconstructed haplotypes (Rm2)
Sensitivity (Snm) and Specificity (Spm)
Misclassification probabilities
1
Hidenotes the vector of lengthMcoding the number of copies of true haplotypes of subjecti,i= 1, ...,Nfor them= 1, ...,Mpossible haplotypes. doi:10.1371/journal.pone.0001853.t001
Table 2.Misclassification matrices for haplotype reconstruction error.
Misclassification matrix in its most general form
ReconstructedCim*
0 1 2 g
True Him
0 p00(m) p10(m) p20(m) 1
1 p01(m) p11(m) p21(m) 1
2 p02(m) p12(m) p22(m) 1
Misclassification probabilities for haplotype reconstruction error expressed by sensitivity, specificity, and true genotype probabilities
ReconstructedCim*
0 1 2 g
True Him
0 Sp 1-Sp 0 1
1 pð Þ1mzpð Þ2m{Snðpð Þ1mzpð Þ2mÞ
pð Þ1m
Snðpð Þ1mzpð Þ2mÞ{pð Þ2m pð Þ1m
1 1
2 0 0 1 1
Misclassification probabilities for haplotype reconstruction error expressed by sensitivity, specificity, and observed genotype probabilities
ReconstructedCim*
0 1 2 g
True Him
0 Sp 1-Sp 0 1
1 {p0{Spðp0{p1{p2Þ{Snp0
p2{p0zSpðp1zp0Þ{Snp2
p2{Spp2{Snðp0zp2Þ
p2{p0zSpðp1zp0Þ{Snp2
0 1
2 0 0 1 1
Misclassification probabilities:pkl(m)=P(Cim* =K|Him=l),k,l= 0,1,2,m= 1,...,M, for subjecti; sensitivity:Snm=P(Cim*.0|Him.0); specificity:Spm=P(Cim* = 0|Him= 0); true or reconstructed haplotypes’ probabilities (i.e. probabilities that a subjects hasknumber of copies of haplotypehm):pk(m)=P(Him=k),k= 0,1,2; pk(m)* =P(Cim* =k); true or reconstructed number of copies ofhm:HimorCim*, respectively.
reconstructed haplotypes by the EM algorithm and derived haplotype frequencies. Depending on the gene, 2–7 loci were involved. Additionally, haplotype frequencies were derived by PHASE, but the differences to EM-derived haplotype frequencies were very small and had no impact on our results, and thus results using PHASE-derived input haplotype frequencies are not reported here.
Simulations and analytical approach to quantify haplotype reconstruction error
In the simulations, true haplotype frequencies were taken as input parameters. For each simulation run, 1000 haplotypes were randomly drawn given the haplotype frequency distribution thus creating two copies of the haplotypes for 500 subjects assuming Hardy-Weinberg equilibrium. Genotypes were deduced and haplotypes were reconstructed from these genotypes using the EM as well as the PHASE algorithm. The reconstructed haplotypes were compared with the true haplotypes using the various error measures. For 100 simulations, the mean and the standard deviation of the error measures were computed. These mean error measures from the simulations were compared with analytical computations, which we derived (Appendix S1).
To derive the true haplotype frequencies as input parameters, different scenarios were implemented for the simulations and the analytical computations:
Abstract scenariosincluded three types: (a) A two-locus scenario varying the frequency f1 of haplotype h1, while two other
frequencies f3 and f4 are set at 0.1 and 0.05. (b) Another
two-locus scenario varying the MAFs of two-locus 1 and two-locus 2, MAF1 and MAF2, and the correlation r. With DLD~
r ffiffiffiffiffiffiffiffiffiffiffiffiffiffiffiffiffiffiffiffiffiffiffiffiffiffiffiffiffiffiffiffiffiffiffiffiffiffiffiffiffiffiffiffiffiffiffiffiffiffiffiffiffiffiffiffiffiffiffiffiffiffiffiffiffiffiffiffiffiffiffiffiffiffiffiffiffiffi MAF1:ð1{MAF1Þ:MAF2:ð1{MAF2Þ
p
[29], the haplo-type frequencies were derived as f1=DLD2MAF1?MAF2,
f2=2DLD+(12MAF1)?MAF2, f3=2DLD+MAF1?(12MAF2), and
f4=DLD2(12MAF1)?(12MAF2). (c) Various multi-locus scenarios
assuming equal MAFs for 3–6 loci under the assumption ofr= 0. Real data scenariosused the sets of haplotype frequencies as they were observed in the KORA data described above.
Impact of haplotype reconstruction error on odds ratio estimates
To evaluate the impact of haplotype misclassification on association estimates, we constructed a case-control study with 500
controls and 500 cases, with a given ‘‘true’’ Odds Ratio (OR) and frequency of the risk haplotype assuming a dominant genetic model. With these specifications, a simple 262 contingency table can be constructed. Via the matrix method [30], we derived an analogous contingency table that could be expected to be observed under the given sensitivity and specificity specifications. From these, we can calculate the ‘‘observed’’ OR and compare it with the given OR.
Results
Discrepancy
Figure 1A illustrates that the discrepancy increases steadily with increasing frequency of one haplotype (other frequencies fixed, abstract scenarios type a) until it reaches a maximum of 0.00917 for f1= 0.46, and then, forf1.0.61, it decreases monotonically. The
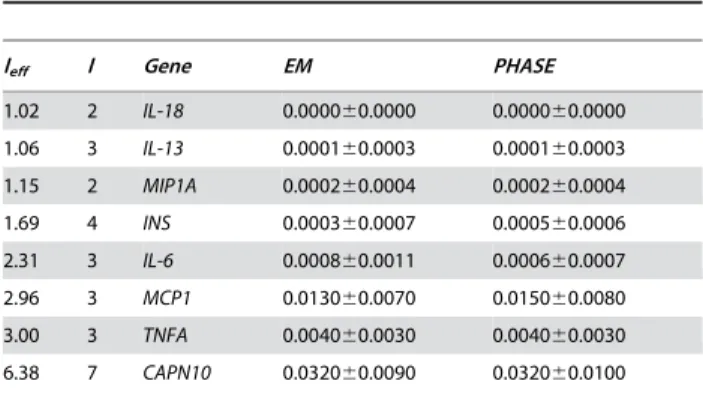
discrepancies inreal data scenarios(Table 3) show values below 0.005 indicating an average difference between true and reconstructed haplotype frequencies below 0.5%, except forMCP1andCAPN10. There is a small difference when comparing EM- or PHASE-derived haplotypes yielding a smaller discrepancy using the EM forINSand MCP1, and a smaller discrepancy using PHASE forIL-6.
Figure 1. Discrepancy and error rate depending on haplotype frequency:A) Discrepancy (from simulations) and error rate (analytically derived), B) ambiguity fraction and correlation coefficient r (Abstract type a scenarios: two loci varying frequency f1of haplotype h1= 00 with f3= 0.1
and f4= 0.05 for h3= 01 and h4= 11).
doi:10.1371/journal.pone.0001853.g001
Table 3.Discrepancy for real data scenarios.
leff l Gene EM PHASE
1.02 2 IL-18 0.000060.0000 0.000060.0000
1.06 3 IL-13 0.000160.0003 0.000160.0003
1.15 2 MIP1A 0.000260.0004 0.000260.0004
1.69 4 INS 0.000360.0007 0.000560.0006
2.31 3 IL-6 0.000860.0011 0.000660.0007
2.96 3 MCP1 0.013060.0070 0.015060.0080
3.00 3 TNFA 0.004060.0030 0.004060.0030
6.38 7 CAPN10 0.032060.0090 0.032060.0100
Values given are discrepancy D6standard deviation using the EM- or PHASE-reconstruction, stating the number of effective loci,leff, and the number of loci, l.
Error rate
For the two-locus scenario varying one haplotype frequency (abstract scenarios type a), the error rate (see Figure 1A) reaches a maximum of 0.056 forf1= 0.57 and is minimal for smallf1or for
large f1. To understand the location of this maximum, the
ambiguity and the correlation coefficient r are displayed in Figure 1B: At the maximum, the alleles show zero correlation. It also becomes apparent that the correlation has a stronger influence on the error rate than the ambiguity in this 2-locus case.
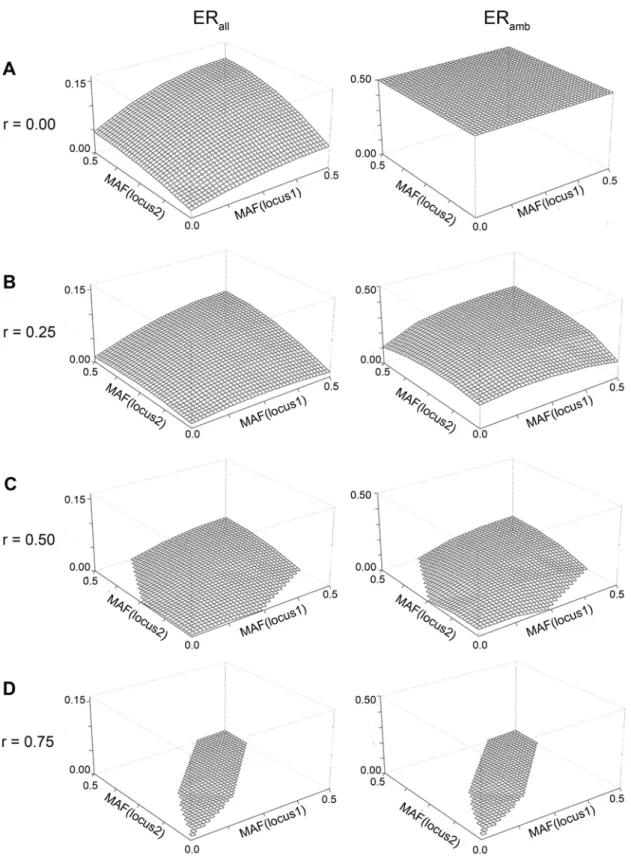
Figure 2. Error rate for varying MAF and correlations for two loci:Analytically derived error rate for A) r = 0, B) r = 0.25, C) r = 0.5, D) r = 0.75 (Abstract type b scenarios)
Figure 2 depicts the dependency of the error rate on the MAFs and r (abstract scenario type b): the smaller the MAF, the smaller the error. The error is minimal, when both MAFs are small. This is due to the fact that the ambiguity is smaller for lower MAF as there are fewer genotypes deviating from the wildtype and thus fewer heterozygotes. Furthermore, the error decreases for increasingr. Note that high correlation imposes strong restrictions on the possible MAF combinations, as the MAF of the second locus can only slightly deviate from the MAF of the first locus and thus the parameter space is reduced (Figure 2D). When r= 0, ERambis 0.5, which is like flipping a coin (Figure 2A) for assigning
haplotypes to ambiguous subjects.
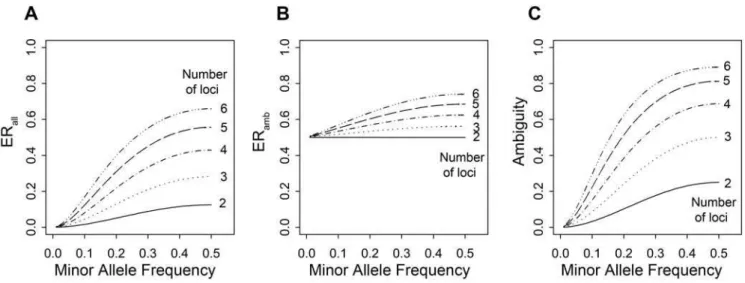
In Figure 3A, which depicts the multi-locus scenarios under no LD (abstract scenarios type c), it can be seen that the error rate increases with the number of loci. This is due to the fact that the probability of a subject being heterozygous in at least two loci increases with the number of loci involved, which is depicted by the increasing ambiguity fraction (Figure 3C). But this is not the sole reason as it can be seen that also ERamb increases with the
number of loci (Figure 3B): The number of haplotypes increases
and thus the pool for misclassification enlarges. It can further be seen, that in the case of MAF = 0.5 when all alleles and consequently all haplotypes are equally frequent, theERambis as
large as when a die was rolled for haplotype assignment of ambiguous subjects. This is due to the fact that then the haploptype inference is guided by neither the correlation nor the haplotype frequency. When MAF,0.5 and haplotypes occur with different frequencies, the reconstruction can improve by preferring haplotype pairs containing more frequent haplotypes. Note that Figure 3 shows a worst-case scenario indicating the maximum possible error due to the no-LD assumption. As it is unreasonable to infer haplotypes in such a situation in the first place, these error rates remain unmatched in real data scenarios. It should further be noted that the error rate derived from simulations instead of using the analytical approach was practically the same, but slightly lower (data not shown).
Table 4 shows that the error rates for real data scenarios vary substantially between genes: The error rate is large for genes with low LD between loci, which are the genes showing a small difference between the number of loci and the effective number
Figure 3. Error rate for varying number of loci and MAF under no correlation:A) ERalland B) ERamband C) ambiguity analytically derived for
abstract type c scenarios (2-6 loci, r = 0, equal MAF at each locus). doi:10.1371/journal.pone.0001853.g003
Table 4.Error rate for real data scenarios.
leff l gene Simulations using EM Simulations using PHASE Analytical Approach
ERamb ERall ERamb ERall ERamb ERall
1.023 2 IL-18 0.0000 0.0000 0.0000 0.0000 0.0000 0.0000
1.064 3 IL-13 0.000160.0008 0.000060.0003 0.000160.0008 0.000060.0003 0.0001 0.0000
1.149 2 MIP1A 0.000260.001 0.000160.0004 0.000060.0010 0.000160.0004 0.0002 0.0001
1.687 4 INS 0.000760.0019 0.000360.0008 0.000660.0017 0.000360.0007 0.0002 0.0001
2.313 3 IL-6 0.002060.003 0.000860.0015 0.000560.0014 0.000360.0007 0.0003 0.0001
2.959 3 MCP1 0.256060.046 0.04860.01 0.258060.051 0.4860.10 0.2460 0.0460
2.999 3 TNFA 0.45660.166 0.0160.0040 0.42860.1670 0.1060.004 0.3900 0.0090
6.384 7 CAPN10 0.19960.024 0.12560.015 0.19760.0240 0.12360.015 0.1870 0.1170
Values given are overall error rate (ERall) and the error rate among ambiguous subjects (ERamb)6standard deviation derived from simulations with EM-reconstruction, PHASE-reconstruction, as well as the error rate computed by the analytical approach given in Appendix S1.
of loci (e.g. forMCP1,TNFa,CAPN10). For most genes, the error rate is well below 1%, which indicates that for 99% of the subjects the haplotypes are perfectly reconstructed. In these real data scenarios, the error rate of PHASE-reconstructed haplotypes is very similar to EM-based haplotypes; the analytical approach yields similar results as the simulation approach, but slightly lower.
Haplotype-specific error measures: R2, sensitivity and specificity
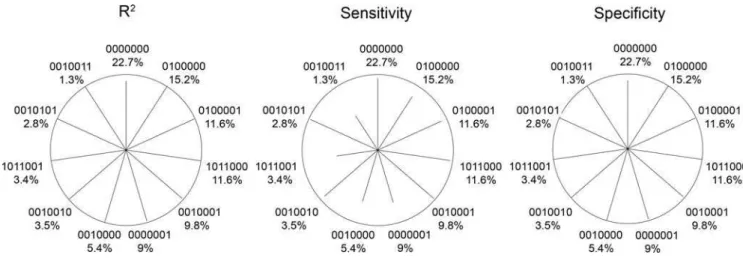
We developed a star plot to summarize the haplotype-specific errors: Figure 4 and 5 show star plots for three selected genes with
,5 loci and for the CAPN10 gene involving 7 loci (real data scenarios). The measures were derived analytically (Appendix S1 and S2), but were very similar in the simulations. Comparing Figure 4 with Table 4 shows that high R2appears together with high sensitivity, and that low error rate occurs with high R2and high sensitivity.
Furthermore, it can be seen that the specificity is reduced rather for common haplotypes (e.g. 98% for haplotype 000 forTNFa, 97% for 0000000 ofCAPN10). On the other side, the sensitivity is reduced rather for rare haplotypes (e.g. 101 ofMCP1). However, there are also rare haplotypes which show almost perfect sensitivity (e.g. 0010101 forCAPN10).
Figure 4. Haplotype-specific error measures:Star plots for various genes displaying R2, sensitivity and specificity (analytically derived) as the length of the line for each common haplotype (frequency31%). A line reaching the circle indicates a value of 100% (no error). Haplotypes are labelled
using 0/1 coding for major/minor allele and stating the haplotype frequency. Lines are sorted clockwise by haplotype frequency beginning at the top with the most frequent haplotype. The angle between lines is given by the number of possible haplotypes, i.e. 360u/2L, where L is the number of loci. The proportion without lines thus indicates the proportion of rare or non-existing haplotypes (,1% frequency).
Impact of haplotype error on Odds Ratio estimates
Figure 6 illustrates how the observed odds ratio (OR) for a specific risk haplotype decreases with decreasing sensitivity and specificity of reconstructing this risk haplotype, here shown for a given OR of 2 and frequency of risk haplotype of 0.2. Note the different scales for sensitivity and specificity. For example, if the risk haplotype is reconstructed with specificity 0.995 and sensitivity 0.500, an OR of 1.8 will be observed, although the true OR is 2.0. The same bias can be expected for a specificity of 0.960 and sensitivity 0.995. Therefore, only a very small decrease in specificity from 1 can result in the same bias as a high decrease in sensitivity.
Discussion
We provide a classification of the various error measures of haplotype reconstruction error. We introduced sensitivity and specificity well-known from other areas of biomedical research to the context of haplotypes and present an analytical computational approach. We illustrated the quantity of the various error measures and their dependencies upon haplotype frequency, minor allele frequency, correlation, number of loci and ambiguity in a systematic way. Our data emphasize the dependence of the haplotype reconstruction error on the specific situation, the importance of haplotype-specific error measures and the possible impact on association analyses.
Overall error measure based on haplotype frequencies or on individuals’ haplotypes (discrepancy versus error rate)
While the discrepancy measures the error in the haplotype frequencies, the error rate depicts the error in the individual’s haplotype assignment. Both measures summarize across all the different haplotypes in the sample. Fallin and Schork [13] stated that the discrepancy was small. This is supported by our data, as we observed discrepancies less than 0.005. However, we found that this observation of small discrepancies could not be transferred to individuals’ haplotype error, for example the error rate.
The overall error rate is the most reported error measure [8–12] and indicates the percentage of subjects with either of the two haplotypes wrongly assigned. Our data showed that the overall error rate depended heavily on the specific setting: The error rate was generally increasing with decreasing correlation between the alleles and increasing ambiguity fraction. The latter also explains the increasing error rate with increasing number of loci and increasing minor allele frequency due to the enlarging proportion of subjects with ambiguous genotypes (heterozygous genotypes for at least two loci). While the error rate was small well below 1% -in some real data examples (e.g.IL-18,INS), which indicates that 99% of subjects have perfectly reconstructed haplotypes, it was substantial in others (CAPN10,TNFA) with error rate up to 12%.
Overall or haplotype specific error measures (error rate versus R2and misclassification probabilities)
The error rate is useful as a measure to summarize across all the different haplotypes in a sample. However, an investigator is
Figure 5. Haplotype-specific error measures:Star plots for theCAPN10displaying the R2, the sensitivity or the specificity as in Figure 4. The
angle between lines is given by 360udivided by the number of frequent haplotypes (frequency31%) to accommodate for the large number of loci
(L = 7).
doi:10.1371/journal.pone.0001853.g005
Figure 6. Impact of decreased sensitivity and specificity on a true odds ratio of 2.0 for a specific risk haplotype (fh= 0.2) in a
case-control study (500 cases, 500 controls).The shades of grey code for the observed OR with contour lines given for specific observed ORs as derived by the matrix method.
usually interested in a specific risk haplotype and in how to interpret this haplotype’s association estimate. Then the question arises whether this specific haplotype is reconstructed with great error, and the error rate averaging across all haplotypes is not of much help.
A known haplotype-specific measure for haplotype reconstruc-tion error is Rm2, which indicates the proportion of haplotype
variance explained by the genotypes. It captures the haplotype-specific error HmRHm*, which is the error from using the
individual’s expected instead of the true number of copies of a haplotype. This is a very complex error model, as it moves from the discrete space {0,1,2} to the continuous space [0,2] with the distribution of Hm* being three-modal at 0,1, and 2. This error
measure can only be applied when using the expected number of haplotypes Hm* as explaining variables in the haplotype
association analysis.
An alternative is a haplotype-specific measure for the error HmRCm*, that is the error from using the individual’s most likely
number of copies of the haplotype instead of the true number of copies. This is an error model from the discrete space {0,1,2} into the discrete space {0,1,2} and thus a classical misclassification problem, which is represented by the 363 misclassification matrix.
This is very appealing as the full concept of misclassification is then available. When the misclassification matrix is known, methods are available to account for the error, e.g. by means of the matrix method [30] or the MC-SIMEX [23].
Sensitivity and Specificity
As new notions of haplotype-specific error measures, we introduced the sensitivity and the specificity to the context of haplotypes and we illustrated that they complemented the R2and differentiated between two reasons for haplotype reconstruction error:
Firstly, the specificity is an issue for common haplotypes: If the specificity is reduced, it is reduced rather for a common haplotype (Figure 4 and 5). This is plausible due to the fact that if any haplotype is misclassified, it is rather misclassified as a common haplotype by pure chance. Therefore, a common haplotype is more likely falsely assigned than a rare haplotype.
Secondly, the sensitivity is an issue for rare haplotypes: If the sensitivity is reduced, it is reduced more likely for a rare haplotype. For example, the rather low sensitivity of the haplotype 101 of MCP1(Figure 4) was due to the fact, that this haplotype most likely paired with the most common haplotype 000 given Hardy-Weinberg equilibrium (haplotype pair 101/000) and that the alternative haplotype pair 001/100 contained two rather frequent haplotypes (001 and 100 with frequencies 5.4% and 17.5%). Thus, the haplotype pair 101/000 would often be falsely reconstructed as 001/100. Generally speaking, the haplotype pair containing a rare haplotype - and thus the rare haploptype itself - is more likely falsely classified. On the other side, there are also rare haplotypes that are perfectly reconstructed, which occurs when there is no likely alternative haplotype pair. For example, the haplotype 0010101 of CAPN10(Figure 5) showed almost 100% sensitivity: Besides the haplotype pair consisting of this rare haplotype and the most common haplotype, 0010101/0000000, an alternative would have been 0010001/0000100 or 0010000/0000101. However, for both alternatives, none of the two haplotypes did exist with frequency.1%. Thus the probability of such a pair was negligible, the pair 0010101/0000000 was assigned with great certainty, and the rare haplotype 0010101 was very well reconstructed.
We also illustrated that sensitivity and specificity completely describe the misclassification matrix (Table 2) and thus provide the prerequisite for methods accounting for misclassification.
Impact on Odds Ratio Estimates
We elucidated the magnitude of bias for a case-control study assuming a dominant model of the risk haplotype. The OR is substantially biased, if the haplotype is reconstructed with either small sensitivity and a specificity of 1, or a sensitivity of 1 and only a very small deviation with respect to the specificity, or with a reduction of both, sensitivity and specificity. In our real data examples, we observed a somewhat small specificity for the most common haplotype ofTNFA and a small sensitivity for the rare MCP1haplotypes (Figure 4). For these haplotypes, one has to think about potentially biased estimates. For all other haplotypes, specificity is 100% and sensitivity so high, that a remarkable bias is not expected. If interest lies in a certain risk haplotype, for example haplotype 0010101 ofCAPN10(Figure 5), one does not have to worry about biased estimates since it is reconstructed with certainty although it is rather rare.
Star plot for haplotype-specific error measures
The quantity of reconstruction error is hard to predict intuitively as the reconstruction depends on the full constellation of the other haplotypes. To better judge whether the haplotype association estimate is biased due to substantial reconstruction error, looking at the haplotype-specific error measures would greatly enhance the knowledge about the reliability of haplotype association estimates. We have thus developed a graphical tool to comprehensively display the haplotype-specific error measures Rm
2
, sensitivity or specificity, which is available as R-function in Appendix S2.
Computational considerations
The analytical derivations of error rate, sensitivity and specificity complement the computational formula ofRm2[25]. The simulations
validated the analytical approach also comparing EM- versus PHASE-reconstruction. It should be noted that the error measures in the simulations included the sampling error and were thus slightly higher than the analytically derived measures, but the difference was not substantial due to sufficient sample size. Comparing EM- with the PHASE-reconstruction, we found that both methods worked equally well when applyingreal data scenarios. Theabstract scenarios, while being useful to make extreme examples and to understand mechanisms, included situations such as the no-LD scenario under which no haplotypes should be reconstructed in the first place.
Strengths and Limitations
We consider the classification and systematic investigation of error measures a useful guidance for researchers interested in haplotypes and haplotype association estimates. This was strength-ened by applying both analytical and simulation approaches for numerous scenarios, by exemplifying the measures to real data and by utilizing the two main reconstruction methods. Finally, this is the first work investigating the sensitivity and specificity of haplotype reconstruction and illustrating their impact on haplo-type association analyses.
the Likelihood Ratio test for it in the setting of case-control studies. However, due to the absence of high throughput procedures for molecular haplotyping, this method is too time- and money-consuming in most cases. Furthermore, even haplotypes assessed in the laboratory are subject to error and can thus also not be taken as a gold standard procedure.
It might also be a limitation that we investigated an extensive, but not universal set of scenarios. For example, our scenarios were restricted to haplotypes across 2 to 7 loci, while in practice there are up to 20 loci. The restriction was made for the sake of limiting the complexity, hypothesizing that the general findings can be transferred to longer haplotypes. Finally, we assumed Hardy-Weinberg equilibrium (HWE) for the haplotype pairs and did not evaluate the impact of violation of this assumption as other work has already focused on this issue (e.g. [10]).
It might be argued that inferring individual haplotypes at all is not an appropriate approach and thus there is no reason for looking at haplotype uncertainties. In the light of numerous methods, which have been developed to simultaneously estimate haplotype probabilities together with association estimates, this argument seems to have a big relevance. These methods do not infer individual haplotypes but use the expected values of haplotypes given the observed genotypes in association analysis within a likelihood framework [16–18,20] or with estimating equations [32]. These approaches involve a very complex error model from the true haplotype as a trichotomous variable into the continuous space of the expected number of haplotype copies. They are often limited to case-control studies, can not incorporate environmental variables or assume additive effects, which is often not the case [33]. Individually inferred haplotypes, on the contrary, can easily be incorporated into generalized linear models (GLM), which provides wide flexibility in the modelling of underlying inheritance assumptions, the study type, the type of outcome variable and gene-environment interactions. Due to the ease of computation in each standard statistical software, this method is quite popular in practice. Furthermore, if some haplotypes can be expected to be inferred correctly or with only small error with respect to sensitivity and specificity as in the example of theCAPN10haplotype mentioned, analyses based on individually inferred haplotype are most powerful. However, association estimates can be biased substantially, if high haplotype misclassification is involved [34,35]. In these cases, information of the misclassification probabilities can be used to correct association estimates (e.g. using the MC-SIMEX method [23]) and still stay in the flexible GLM framework.
Summary and Conclusion
In this work, we provide a classification and systematic quantifi-cation of haplotype reconstruction error measures. Our results under-score the value of haplotype-specific error measures. We introduce the well-known and easily communicated concept of sensitivity and specificity to the context of haplotypes. We provide an analytical computational approach, and a graphical tool for a summary presentation, which allows to routinely quantify sensitivity and specificity next to haplotype frequencies and haplotype association estimates to provide a sense of certainty into the haplotype reconstruction, especially if interest lies in one specific risk haplotype. This has the advantage that then the misclassification matrix is known thus providing the necessary prerequisite for methods to account for misclassification for example via the Matrix Method or the MC-SIMEX. We conclude that haplotype association analyses can greatly benefit from quantifying haplotype-specific error on a routine basis.
Supporting Information
Appendix S1 Analytical approach to quantify the error rate,
sensitivity and specificity
Found at: doi:10.1371/journal.pone.0001853.s001 (0.12 MB DOC)
Appendix S2 Function ‘Sensitivity’ calculates sensitivity,
speci-ficity and efficiency for each haplotype and Function ‘Starplot’ draws sensitivity, specificity or R-square-values for each haplotype (R-programs)
Found at: doi:10.1371/journal.pone.0001853.s002 (0.01 MB TXT)
Acknowledgments
We thank the KORA group for providing the study data, Prof. Dr. Dr. H.-E. Wichmann and T. Illig from the GSF-Institute of Epidemiology and Prof. Dr. F. Kronenberg from the Medical University Innsbruck, Division of Genetic Epidemiology for the SNP data and the support in the grant application.
Author Contributions
Conceived and designed the experiments: IH HK. Performed the experiments: CL FB. Analyzed the data: CL FB. Contributed reagents/ materials/analysis tools: IH. Wrote the paper: IH CL. Other: Consulted in methodology and manuscript writing: HK. Wrote the grant for research position: IH.
References
1. Daly MJ, Rioux JD, Schaffner SF, Hudson TJ, Lander ES (2001) High-resolution haplotype structure in the human genome. Nat Genet 29: 229–232. 2. Johnson GCL, Esposito L, Barratt BJ, Smith AN, Heward J, et al. (2001) Haplotype tagging for the identification of common disease genes. Nature Genetics 29: 233–237.
3. Akey J, Jin L, Xiong M (2001) Haplotypes vs single marker linkage disequilibrium tests: what do we gain? Eur J Hum Genet 9: 291–300. 4. Clark AG (2004) The role of haplotypes in candidate gene studies. Genet
Epidemiol 27: 321–333.
5. Martin ER, Lai EH, Gilbert JR, Rogala AR, Afshari AJ, et al. (2000) SNPing away at complex diseases: analysis of single-nucleotide polymorphisms around APOE in Alzheimer disease. Am J Hum Genet 67: 383–394.
6. Morris RW, Kaplan NL (2002) On the advantage of haplotype analysis in the presence of multiple disease susceptibility alleles. Genet Epidemiol 23: 221–233. 7. Excoffier L, Slatkin M (1995) Maximum-likelihood estimation of molecular
haplotype frequencies in a diploid population. Mol Biol Evol 12: 921–927. 8. Stephens M, Smith NJ, Donnelly P (2001) A new statistical method for haplotype
reconstruction from population data. Am J Hum Genet 68: 978–989. 9. Stephens M, Donnelly P (2003) A comparison of bayesian methods for haplotype
reconstruction from population genotype data. Am J Hum Genet 73: 1162–1169.
10. Niu T, Qin ZS, Xu X, Liu JS (2002) Bayesian haplotype inference for multiple linked single-nucleotide polymorphisms. Am J Hum Genet 70: 157–169. 11. Adkins RM (2004) Comparison of the accuracy of methods of computational
haplotype inference using a large empirical dataset. BMC Genet 5: 22. 12. Xu H, Wu X, Spitz MR, Shete S (2004) Comparison of haplotype inference
methods using genotypic data from unrelated individuals. Hum Hered 58: 63–68.
13. Fallin D, Schork NJ (2000) Accuracy of haplotype frequency estimation for biallelic loci, via the expectation-maximization algorithm for unphased diploid genotype data. Am J Hum Genet 67: 947–959.
14. Carroll RJ, Ruppert D, Stefanski LA (2006) Measurement Error in Nonlinear Models. Chapman&Hall.
15. Thomas D, Stram D, Dwyer J (1993) Exposure measurement error: Influence on exposure-disease relationships and methods of correction. Annu Rev Public Health 14: 69–93.
16. Zaykin DV, Westfall PH, Young SS, Karnoub MA, Wagner MJ, et al. (2002) Testing association of statistically inferred haplotypes with discrete and continuous traits in samples of unrelated individuals. Hum Hered 53: 79–91.
18. Spinka C, Carroll RJ, Chatterjee N (2005) Analysis of case-control studies of genetic and environmental factors with missing genetic information and haplotype-phase ambiguity. Genet Epidemiol 29: 108–127.
19. Schaid DJ, Rowland CM, Tines DE, Jacobson RM, Poland GA (2002) Score tests for association between traits and haplotypes when linkage phase is ambiguous. Am J Hum Genet 70: 425–434.
20. Lake SL, Lyon H, Tantisira K, Silverman EK, Weiss ST, et al. (2003) Estimation and tests of haplotype-environment interaction when linkage phase is ambiguous. Hum Hered 55: 56–65.
21. Lin DY, Zeng D (2006) Likelihood-based inference on haplotype effects in genetic association studies. J Am Stat Assoc 101: 89–104.
22. Little RJA, Rubin DB (2002) Statistical Analysis with Missing Data. Wiley. 23. Kuchenhoff H, Mwalili SM, Lesaffre E (2006) A General Method for Dealing with
Misclassification in Regression: The Misclassification SIMEX. Biometrics 62: 85–96. 24. Nyholt DR (2004) A simple correction for multiple testing for single-nucleotide polymorphisms in linkage disequilibrium with each other. Am J Hum Genet 74: 765–769.
25. Stram DO, Leigh PC, Bretsky P, Freedman M, Hirschhorn JN, et al. (2003) Modeling and E-M estimation of haplotype-specific relative risks from genotype data for a case-control study of unrelated individuals. Hum Hered 55: 179–190. 26. Wichmann HE, Gieger C, Illig T (2005) KORA-gen–resource for population genetics, controls and a broad spectrum of disease phenotypes. Gesundheitswe-sen 67 Suppl 1: S26–S30.
27. Illig T, Bongardt F, Schopfer A, Holle R, Muller S, et al. (2003) The endotoxin receptor TLR4 polymorphism is not associated with diabetes or components of the metabolic syndrome. Diabetes 52: 2861–2864.
28. Illig T, Bongardt F, Schopfer A, Muller-Scholze S, Rathmann W, et al. (2004) Significant association of the interleukin-6 gene polymorphisms C-174G and A-598G with type 2 diabetes. J Clin Endocrinol Metab 89: 5053–5058. 29. Devlin B, Risch N (1995) A comparison of linkage disequilibrium measures for
fine-scale mapping. Genomics 29: 311–322.
30. Morrissey MJ, Spiegelman D (1999) Matrix methods for estimating odds ratios with misclassified exposure data: extensions and comparisons. Biometrics 55: 338–344.
31. Levenstien MA, Ott J, Gordon D (2006) Are molecular haplotypes worth the time and expense? A cost-effective method for applying molecular haplotypes. PLoS Genet 2: e127.
32. Zhao LP, Li SS, Khalid N (2003) A method for the assessment of disease associations with single-nucleotide polymorphism haplotypes and environmental variables in case-control studies. Am J Hum Genet 72: 1231–1250.
33. Heid IM, Wagner SA, Gohlke H, Iglseder B, Mueller JC, et al. (2006) Genetic architecture of the APM1 gene and its influence on adiponectin plasma levels and parameters of the metabolic syndrome in 1,727 healthy caucasians. Diabetes 55: 375–384.
34. Kraft P, Cox DG, Paynter RA, Hunter D, De Vivo I (2005) Accounting for haplotype uncertainty in matched association studies: a comparison of simple and flexible techniques. Genet Epidemiol 28: 261–272.