Melting (HRM) Analysis in Multiple Cancers
Jesus Gonzalez-Bosquet1, Jacob Calcei1, Jun S. Wei2, Montserrat Garcia-Closas3, Mark E. Sherman3, Stephen Hewitt4, Joseph Vockley5, Jolanta Lissowska6, Hannah P. Yang3, Javed Khan2, Stephen Chanock1*
1Laboratory of Translational Genomics, Department of Health and Human Services (DHHS), National Cancer Institute (NCI), National Institutes of Health (NIH), Bethesda, Maryland, United States of America,2Advanced Technology Center, Pediatric Oncology Branch, Center for Cancer Research, DHHS, NCI, NIH, Bethesda, Maryland, United States of America,3Hormonal and Reproductive Epidemiology Branch, Division of Cancer Epidemiology and Genetics, DHHS, NCI, NIH, Bethesda, Maryland, United States of America,4Tissue Array Research Program, DHHS, NCI, NIH, Bethesda, Maryland, United States of America,5Office of Cancer Genomics, DHHS, NCI, NIH, Bethesda, Maryland, United States of America,6Department of Cancer Epidemiology and Prevention, M. Sklodowska-Curie Institute of Oncology and Cancer Center, Warsaw, Poland
Abstract
Identification of somatic mutations in cancer is a major goal for understanding and monitoring the events related to cancer initiation and progression. High resolution melting (HRM) curve analysis represents a fast, post-PCR high-throughput method for scanning somatic sequence alterations in target genes. The aim of this study was to assess the sensitivity and specificity of HRM analysis for tumor mutation screening in a range of tumor samples, which included 216 frozen pediatric small rounded blue-cell tumors as well as 180 paraffin-embedded tumors from breast, endometrial and ovarian cancers (60 of each). HRM analysis was performed in exons of the following candidate genes known to harbor established commonly observed mutations:PIK3CA,ERBB2,KRAS,TP53,EGFR,BRAF,GATA3, andFGFR3. Bi-directional sequencing analysis was used to determine the accuracy of the HRM analysis. For the 39 mutations observed in frozen samples, the sensitivity and specificity of HRM analysis were 97% and 87%, respectively. There were 67 mutation/variants in the paraffin-embedded samples, and the sensitivity and specificity for the HRM analysis were 88% and 80%, respectively. Paraffin-embedded samples require higher quantity of purified DNA for high performance. In summary, HRM analysis is a promising moderate-throughput screening test for mutations among known candidate genomic regions. Although the overall accuracy appears to be better in frozen specimens, somatic alterations were detected in DNA extracted from paraffin-embedded samples.
Citation:Gonzalez-Bosquet J, Calcei J, Wei JS, Garcia-Closas M, Sherman ME, et al. (2011) Detection of Somatic Mutations by High-Resolution DNA Melting (HRM) Analysis in Multiple Cancers. PLoS ONE 6(1): e14522. doi:10.1371/journal.pone.0014522
Editor:Philip Awadalla, University of Montreal, Canada
ReceivedMarch 2, 2010;AcceptedDecember 8, 2010;PublishedJanuary 17, 2011
This is an open-access article distributed under the terms of the Creative Commons Public Domain declaration which stipulates that, once placed in the public domain, this work may be freely reproduced, distributed, transmitted, modified, built upon, or otherwise used by anyone for any lawful purpose.
Funding:These authors have no support or funding to report.
Competing Interests:The authors have declared that no competing interests exist.
* E-mail: [email protected]
Introduction
Recently, the first cancer genomes to be completely sequenced have revealed an unanticiapted breadth and complexity of somatic alterations [1,2,3]. The discovery of somatic sequence alterations, has accelerated the investigation of ir underlying mechanisms in carcinogenesis. Somatic alterations implicated in cancer develop-ment and growth advantage are calleddrivermutations. However, the majority of somatic alterations in cancer genomes are a consequence of genomci instability and appear to be passenger or bystander mutations that are unlikely to be involved in oncogenesis [4,5]. Large-scale sequencing studies have shown that the prevalence and signature of somatic mutations in human cancers are highly variable [5,6,7,8]. Based on these studies, we can estimate that the majority of somatic mutations in cancer cells are likely to be passenger mutations, whereas a minority are estimated to be driver mutations [5,7]. The full landscape of the prevalence of mutations as well as their functional consequences will not be appreciated until thousands of cancer genomes have been sequenced.
Sequencing cancer genomes is a formidable task that requires expensive technologies and computational support to assemble
large portions of the genome. Because of the intense interest in identifying key somatic alterations, investigation has focused on techniques for screening or analyzing regions of interest. Most studies have concentrated on coding regions and adjacent intronic or putative regulatory regions [9]. One of those techniques is the high resolution melting (HRM) curve analysis, a polymerase chain reaction (PCR) based high-throughput assay for detecting DNA sequence variation by measuring changes in the melting of a DNA duplex, that has been used successfully with DNA extracted from both frozen and paraffin-embedded tissue [10,11,12].
pre-scan candidate genes suspicious of harboring mutations, reducing significantly the amount of DNA sequencing to be performed [15,16,17,18,19,20].
The aim of this study was to assess the sensitivity and specificity of an inexpensive HRM analysis platform for mutation scanning of single-base variation in a range of tumor samples: frozen pediatric small rounded blue-cell tumors and paraffin-embedded tumors from breast, endometrium and ovarian cancers. Bi-directional sequence analysis was performed to determine the accuracy of this DNA HRM technology.
Methods
Ethics Statement
The Institutional Review Board for the Polish Breast, Ovarian, and Endometrial Cancer Study were approved by the National Cancer Institute (NCI), at Bethesda, MD, the M. Sklodowska Institute of Oncology and Cancer Center in Warsaw, and the Institute of Occupational Medicine (IOM) in Lodz, both in Poland [21]. Written informed consent for participation on the studies was obtained at the participating institutions from all participants involved.
All frozen samples from pediatric small rounded blue-cell tumors and obtained from Cooperative Human Tissue Network (http://chtn.nci.nih.gov/), were anonymized, and our protocol was reviewed by the Office of Human Subjects Research at National Institutes of Health, Bethesda, MD, and deemed exempt.
DNA samples
Frozen tissue samples. Snap frozen tumor samples were obtained from Cooperative Human Tissue Network (http://chtn. nci.nih.gov/). Neuroblastoma cell lines and their culture con-ditions are described elsewhere [22]. Genomic DNA was extracted from frozen primary tumor samples (neuroblastoma, n = 140; rhabdomyosarcoma, n = 63) and neuroblastoma cell lines (n = 13) using a published protocol [23]. DNA concentration was quanti-fied using NanoDrop (Thermo Fisher Scientific, Wilmington, DE), and then adjusted to the same concentration, 10 ng/mL, for the 12 assays. Matched control genomic DNA was available from peripheral blood for 43 cancers.
Paraffin-embedded tissue samples. The Polish Breast, Ovarian, and Endometrial Cancer Study is part of a collaborative study between the U.S. National Cancer Institute (NCI), the M. Sklodowska Institute of Oncology and Cancer Center in Warsaw, and the Institute of Occupational Medicine (IOM) in Lodz [21] designed to study risk factors for breast, endometrial and ovarian cancer [24,25,26]. Paraffin blocks of tumor tissue from partici-pants of this study that underwent surgery were collected. In total, we included tissue from 60 participants with breast cancer, 60 with endometrial cancer and 60 with ovarian cancer.
Single 0.6 mm tissue cores targeted to areas with tumor that had been identified and marked by a pathologist (MES) were obtained from each tumor block for DNA extraction, using a tissue microarray coring needle for each sample. Microdissection was performed for a small proportion of the samples, making it difficult to accurately assess the percentage of tumor material. Nucleic acid extraction was performed with the AgencourtHFormaPureTMkit (Agencourt Bioscience Corporation, Beverly, MA) according to the manufacturer’s instructions. To avoid interferences with the PCR we removed RNA from purified total nucleic acid during the extraction method. After extraction and purification, DNA concentration and purity were quantified using NanoDrop (Thermo Fisher Scientific, Wilmington, DE). Total genomic DNA extracted with this method yielded an averaged of 2.07mg
(range 0.03 to 7.69mg). The purity of DNA for each extraction method was assessed by measuring the intensity of absorbance of the DNA solution at wavelengths 260 nm (A260) and 280 nm (A280).
Selection of exons for screening
The set of exons selected for this mutation scanning analysis were drawn from cancer genes frequently mutated (PIK3CA, ERBB2, KRAS, TP53, EGFR, BRAF, GATA3, and FGFR3) in published reports, with a particular emphasis on breast, ovarian and endometrium cancers [5,9,27,28,29,30,31,32]. Also, HRM analysis for these particular genomic regions had already been optimized.
Primers and pre-HRM PCR
Primers of the exons, as well as the size of the amplicons, used for the pre-HRM PCR are listed in Table 1. On average, 40 bp of the proximal - or 59- intronic region flanking the target exon and 41 bp of the 39 intronic region flanking the target exon were covered by the amplicon. The only exception was exon 6 of GATA3, which measures 1462 bp, of which 284 bp correspond to coding nucleotides. In this particular case, the amplicon did not extend over the 39side of the intron (Table 1 for details).
Attention to detail in pre-HRM PCR conditions is paramount for optimization: 1) design of PCR primers to keep GC content under or as close as 60% as possible, product size around 200 bp and avoid known variants within the primer region; 2) selection of optimal annealing temperatures with gradient PCR; 3) and design of PCR experiments in a consistent manner: same assay, with same sample batch and same machine run.
PCR-based analyses for the different genes were performed in 96-well format with 10mL volumes and included 10 ng of genomic DNA for frozen samples, and 1mL of solution containing genomic DNA for paraffin-embedded tissue samples, with mean concentration of 25.8 ng/mL (SD = 21.7), and ranging from 2 to over 55 ng/mL (first quartile 8.4 ng/mL, and third quartile 36.3 ng/mL). Master Mix that included all deoxynucleoside triphosphates, Taq polymerase, and the LCGreenHPLUS (Idaho Technology, Salt Lake City, UT) was used for the pre-HRM PCR. PCR was performed using a MJ Research PTC 225 Thermal Cycler (MJ Research, GMI Inc., Ramsey, MN) with an initial denaturation at 95uC for 2 minutes, followed by 45 cycles of 2 step temperature cycling of 95uC for 30 seconds, and 66 to 70uC for 30 seconds (PIK3CA, ERBB2,KRASat 66uC;TP53,EGFR,BRAFat 68uC; GATA3, FGFR3 at 70uC). After PCR, the samples were heated to 93uC for 30 seconds and then cooled to 25uC before HRM.
Sample handling
curve underwent a repeated HRM analysis, and were also sequenced.
Paraffin-embedded.We analyzed 60 breast cancer samples, 60 endometrial cancer samples and 60 ovarian cancer samples. The quality of the extracted DNA was measured by the presence of pre-HRM PCR product in the HRM analysis and by the presence of a single band on a 1.5% agarose gel [33]. In this set, all samples were bi-directionally sequenced.
HRM Curve Analysis
Samples were amplified in 96-well plates, and HRM curves acquisition was performed on a prototype version of the HRM instrument, LightScannerTM, using LCGreenHPlus+ Dye (Idaho Technology, Salt Lake City, UT). Depending on the assay combination on the plate, HRM range was set to accommodate each assay individual profile with at least 4uC prior to the first melt transition on the plate, with a slope of 0.3uC/s, and at least 3 degrees after the last fragment has completely melted.
Since HRM was performed in this study as the screening technology, the curves were analyzed using custom LightScan-nerTMsoftware (Idaho Technology, Salt Lake City, UT). Normali-zation and background subtraction were first performed by fitting an exponential to the background surrounding the HRM trans-itions of interest. The normalized HRM curves were temperature-overlaid, to eliminate slight temperature errors between wells
or runs. Difference plots of these normalized and temperature-overlaid curves were obtained by taking the fluorescence difference of each curve from the average wild-type curve at all temperature points [13,14]. HRM curves with a plot interpreted by the software to be different from the averaged wild-type curve were considered to be suspicious of harboring a nucleotide change or a mutation/variant (Figure S1). These analytical methods have been applied previously to mutation scanning [34,35].
Bi-directional Sequence Analysis
Bi-directional sequence analysis was performed with primers that were designed by extending each oligonucleotide used in the pre-HRM PCR with a universal sequencing primer: M13 forward (TGTAAAACGACGGCCAGT) or M13 reverse (CAGGAAA-CAGCTATGACC). PCR conditions for sequencing analysis were performed in 96-well format with 10mL volumes and included 1mL of amplified DNA from the pre-HRM PCR reaction. Genomic DNA was used only when the sequence reaction failed with amplified DNA. PCR products were sequenced using a modified ABI PrismH BigDye Terminator protocol (Applied Biosystems, Foster City, CA). Unincorporated dyes terminators and salts were removed utilizing a Sephadex G-50 (Sigma, St Louis, MO) spin columns in a MultiScreenH-HV 96-well filter plate (Millipore, Billerica, MA). The reactions were run on an ABI Table 1.Primers for pre-HRM DNA amplification.
Gene Exon Size (bp)
Direction
primer Primer
Intron 59 coverage (bp)
Intron 39 coverage (bp)
PIK3CA 10 258 Forward ATCCAGAGGGGAAAAATATGAC 58
-Reverse TGAGATCAGCCAAATTCAGTTAT - 74
FGFR3 13 195 Forward TGCCTCCCACCCCTTCC 21
-Reverse AGGCGTCCTACTGGCAT - 51
ERBB2 25 200 Forward ACATGGGTGCTTCCCATTC 22
-Reverse GCTCCTTGGTCCTTCACCTA - 22
TP53 51 186 Forward GCCCTGACTTTCAACTCTG 39
-Reverse CCTCACAACCTCCGTCAT -
-TP53 52 115 Forward TGGCCATCTACAAGCAGTC -
-Reverse CAGCCCTGTCGTCTCTC - 34
TP53 7 200 Forward GGCGCACTGGCCTCATCT 39
-Reverse AGAGGCTGGGGCACAGCA - 51
EGFR 23 213 Forward CAGCAGGGTCTTCTCTGTTTC 23
-Reverse GAAAATGCTGGCTGACCTAAAG - 34
KRAS 2 208 Forward GTGACATGTTCTAATATAGTCACATTTTC 46
-Reverse GGTCCTGCACCAGTAATATG - 40
BRAF 15 184 Forward AGATCTACTGTTTTCCTTTACTTACTACACC 35
-Reverse AATCAGTGGAAAAATAGCCTCAATTCT - 30
GATA3 5 190 Forward GATTTCACCCTCTCCTCTCTCCC 32
-Reverse AGCCCTGTTCTTGCTGATCC - 32
GATA3 61 194 Forward GTGGAACCCTTCTTGGTGTG 88
-Reverse AGTCCTCCAGTGAGTCATGC -
-GATA3 62 154 Forward AAATGTCTAGCAAATCCAAAAAGTGCAA -
-Reverse GTGGTCAGCATGTGGCTGGA - -79
1Proximal region. 2Distal region.
3730XL (Applied Biosystems, Foster City, CA). Sequence traces were analyzed and compared using two software packages (SeqScapeTM v2.5 and Variant ReporterTM v1.0, both from Applied Biosystems, Foster City, CA) and reviewed by two independent reviewers [9]. When the software was unable to align and assemble the forward and the reverse sequences the sample was considered to have failed the sequencing process for the purpose of this study. For the paraffin-embedded assays that did not performed as well as their frozen counterparts (specifically exons from genesTP53and GATA3), PCR conditions as well as their primers were modified to improve sequencing. This included generating primers that extended across more of the genomic regions or slide 20–30 bp up or down stream. But we noted that the new, specific assays failed to optimize while testing different regions would alter the purpose of the study. In summary, sequencing error rate was 2.5% for frozen specimens and 20.0% for paraffin-embedded.
Nucleotide changes detected by sequencing were classified as novel alterations or known SNPs (or Single Nucleotide Polymor-phisms) if found in dbSNP, Build 130, from the NCBI (www.ncbi. nlm.nih.gov/projects/SNP/), using Genewindow (genewindow. nci.nih.gov) [36].
Statistical Analysis
The association between the quantity of DNA extracted from the paraffin-embedded tissue (levels: #10 ng/mL, 11–20 ng/mL, 21–30 ng/mL, and.30 ng/mL) and a successful pre-HRM PCR assay, measured either by the presence of a single amplicon in agarose gel or the presence of a DNA product at the HRM analysis, was performed by logistic regression analysis. Agreement between 2 variables (or reliability) was determined by a Kappa test. Kappa values less than 0.40 indicate low association, between 0.40 and 0.75 indicate medium association, and values greater than 0.75 indicate high association between two measures. Screening capabilities of HRM and the consistency of the analysis were measure using classical metrics, such as sensitivity, specificity, false negative and positive rates, considering sequencing analysis as the standard measurement for both frozen and paraffin-embedded extracted samples.
Statistical analyses were conducted using MicrosoftH Excel (Redmond, WA) and R statistical package (www.r-project.org/).
Results
Frozen samples
Mutation screening was performed on 12 amplicons for each of 216 frozen samples during the initial HRM analysis (2,592 different determinations). We observed 59 HRM positive samples, 2510 HRM negative, and only 23 of these measurements were not evaluable (less than 1%). For the repeat HRM experiments, 47 were positive, 156 negative, and only 1 out of 204 was not evaluable. In total, 2,772 out of 2,796 (2,592 in first HRM round, and 204 in the second HRM round), or 99.1%, experiments were evaluable for screening of mutations/variants by HRM analysis.
In the initial round of analysis, 4 assays had no mutation detected: ERBB2 exon 25, the distal region of TP53 exon 5, GATA3exon 5, and the proximal region ofGATA3exon 6. For the remainder tested exons, between 1 to 9 putative nucleotide substitutions were detected; notably exon 13 of FGFR3 had the highest number, 30. The results of mutation screening by HRM technology in both experiments, initial and repeat, as well as the validation with sequencing for frozen samples are displayed in Table 2.
HRM experiments were repeated on all the samples with evidence of a putative mutation on the HRM curve, and also in a subset of negative samples. The agreement between the initial and repeat screen of HRM experiments was 91%, with a kappa test value of 0.77, or high concordance between both. In general, HRM curves presented similar shapes in both independent analyses (Figure S2). The majority of disagreements resided in samples called abnormal in the initial screen and normal, or without mutation, in the repeat HRM experiment (n = 12), that were confirmed normal by sequencing. Only 1 repeated HRM analysis failed to detect a nucleotide substitution in a sample with respect to the initial screen. Later sequencing of this sample detected a substitution of reference GG alleles, at position 7518234 of chromosome 17 (exon 7 of geneTP53), by AA.
The sensitivity and specificity for mutation/variant screening were 97% and 87% respectively when compared to bi-directional sequencing, with a false negative rate of 3%. The overall accuracy of the test was 89% (Table 3). When the second, repeated HRM analysis was compared to sequencing results, specificity increased to 94%, as well as the accuracy, 94% (kappa of 0.82); but the false negative rate also increased to 5%. Details of sequencing results for mutations are described in Table 4. One false negative was detected when comparing HRM experiments with sequencing, failing to detect a nucleotide change, from AA to AG, in both the initial and repeat screens. This variant turned out to be a known SNP in exon 13 of FGFR3, rs7688609 (Table 4). Notably, comprehensive public databases (dbSNP and Ensembl) indicated G as the ancestral, reference allele in the DNA sequence for this locus, but the majority of sequenced samples in our study, 63 out of 67 (or 94%), were homozygous for AA, and only 6% were heterozygous for G (GA). Given this disparity on allele frequencies with available public data, we decided to sequence all 3 populations of HapMap as well as the SNP500 population for this particular amplicon (n = 366) [37,38]. Overall, allele A frequency was 94%, and allele G frequency was 6%. Yoruba population presented the highest G frequency with 17%. At the same time, we sequenced this region for 43 available germ line DNA from the patients suffering from these pediatric tumors; all of them were homozygous for AA. After sequencing all paraffin-embedded samples, we found similar allele frequencies.
Paraffin-embedded samples
The A260/A280 ratio, a measure of the purity of the paraffin-embedded extracted DNA, had a mean of 1.92 (SD = 0.45) for all breast cancer samples, a mean of 1.82 (SD = 0.12) for endometrial cancer samples, and a mean of 2.0 (SD = 0.27) for ovarian cancer samples. There was a direct association between the concentration of DNA (in ng/mL) extracted from the paraffin-embedded samples, the DNA amount used for the pre-HRM PCR, and the presence of a single band in the agarose gel (p,0.001). Also there was an association between extracted DNA concentration and the presence of an adequate HRM curve for analysis (p,0.001). HRM was successful 96% of the time when the quantity of paraffin-embedded extracted DNA used for this technique was more than 30 ng in comparison with 92% when the quantity was #30 ng (Table 5).
Overall, 93% (2,008 out of 2,153) of the measurements of paraffin-embedded samples by HRM analysis were evaluable. This technique was more successful when frozen DNA specimens were analyzed than when DNA extracted from paraffin-embedded samples was used, 99.1% versus 93.3% (p,0.001).
of these results is portrayed in Figure S3. The overall sensitivity and specificity for the samples suspicious for mutation in the HRM analysis were 88% and 80% respectively when compared to sequencing, with a false negative rate of 12% (Table 7). However, a relatively small percentage of DNA extracted from paraffin-embedded samples was difficult to sequence. As we mentioned, the sequence reaction was undertaken using amplified DNA from the pre-HRM PCR. When sequencing of a particular assay failed, genomic DNA was utilized and sequencing repeated. With this strategy, confirmatory sequence in frozen samples could be performed over 97% of the time. This was not the case with DNA extracted from paraffin-embedded tissue, where sequencing was achieved 80% of the time using the same strategy. In particular, the success rate of DNA sequencing from paraffin-embedded tissue was less than 50% for exons from genesTP53 (distal region of exon 5, and exon 7) andGATA3(proximal region of exon 6), affecting the comparison between sequence analysis and HRM curves. Sequencing of these amplicons failed in 341 out of 397 reactions, which accounted for 86% of all failed sequencing. When these failed assays were excluded from the comparison between HRM curves and sequencing, sensitivity increased to 92%, with an accuracy of 80%. Paraffin-embedded sequencing details are described in Table S1. All new nucleotides changes
found on the study samples were submitted to dbSNP (build 131) and displayed in Table S2.
Discussion
HRM analysis using the LightScannerTM represents a moder-ate-throughput screening test for mutations among candidate genomic regions. The comparison with bi-directional sequencing analysis provides strong evidence for its accuracy despite the low prevalence mutation/variant rate, particularly since selected exons harbored no mutations. Our results are consistent with earlier reports [28,39]. The observed rate was 39 for 2,569 (or 1.5%) mutation/variant for all analyzed exons within the 216 frozen pediatric small rounded blue-cell tumors, and 67 for 1,586 (or 4.2%) mutation/variant for all analyzed exons in the 180 gynecological solid tumors (Tables 4 and S1, respectively).
Sensitivity and specificity of HRM analysis was higher in frozen samples compared to paraffin-embedded samples, with an observed sensitivity of 97% for DNA extracted from frozen samples whereas it is 88% for DNA extracted from paraffin-embedded tissue. Lower performance of some assays when comparing DNA from paraffin-embedded specimens versus frozen samples has also been described in previous studies forKRASand EGFR[12]. These differences are due, at least to some extent, to sequence alterations in DNA related to cross-linking between proteins and DNA, and inversely correlated with the number of cells within the samples [40,41,42]. Also, the presence of multiple mutations and point deletions may alter the efficiency of the assay, possibly the reason for low performance inTP53assays [16,43]. The majority of HRM studies performed to date have concluded that, with some limitations, this is a relatively simple, rapid and inexpensive technique for detecting genomic variation in paraffin-embedded tissue samples [43]; with consistent reports on some of the genes screened on our study [11,16,40,44]. Its limitations are related to a lower efficiency on regions with deletions (or insertions), on detecting homozygous variations (when compared to heterozigous), on specific assays, and the lack of agreement on the optimal length of PCR product or melting domains per amplicon [12,13,16].
In order to eliminate the subtle differences in the reagent components between the final elution buffers from multiple Table 2.Results of mutation screening by HRM (initial screen and repeat) and sequencing from frozen samples.
HRM positive
HRM negative
Sequencing positive
Sequencing negative
Repeated HRM positive
Repeated HRM negative
PIK3CA610 2 213 2 5 2 5
ERBB2625 0 215 0 8 0 8
KRAS62 3 213 5 5 3 5
TP5365(1) 5 206 3 7 5 7
TP5365(2) 0 215 0 15 1 14
TP5367 9 207 5 15 7 13
EGFR623 6 210 6 8 6 8
BRAF615 3 213 1 13 2 12
GATA365 0 216 0 8 0 8
GATA366(1) 0 216 0 10 0 10
GATA366(2) 1 215 1 16 1 16
FGFR3613 30 171 16 54 20 50
Total 59 2,510 39 164 47 156
doi:10.1371/journal.pone.0014522.t002
Table 3.Comparison between HRM mutation screening (initial screen) and sequencing of frozen samples.
+Sequencing 2Sequencing Total
+HRM 38 21 59
2HRM 1 143 144
Total 39 164 203
Sensibility: 0.97. Specificity: 0.87. False positive: 0.13. False negative: 0.03. Accuracy: 0.89.
Note: These calculations are based uniquely on samples successfully sequenced.
extraction platforms and to minimize variability within samples our approach was to perform the DNA extraction using a common extraction platform, conditions and protocol. With optimized sample handling and standardized DNA extraction, it is possible to screen paraffin-embedded samples with higher sensitivity [40,41]. Despite the increased fragmentation of DNA extracted from paraffin-embedded tissue, it is possible to reliably screen shorter amplification products up to 250 bp in length. In addition, the extent of DNA fragmentation correlates with tissue type [12,45,46]. Success on both, HRM curve and sequencing analyses, is over 97% when 10 ng of DNA is used from frozen samples. But those results could not be achieved with the same quantity of paraffin-embedded extracted DNA (successful HRM analysis in 84%). By increasing the quantity of purified DNA added to the pre-HRM PCR #30 ng performance improved, partially overcoming the challenge posed by sub-optimal double stranded DNA. Optimization of pre-HRM PCR can also mitigate reduced sensitivity, especially while using special dye chemistry [46].
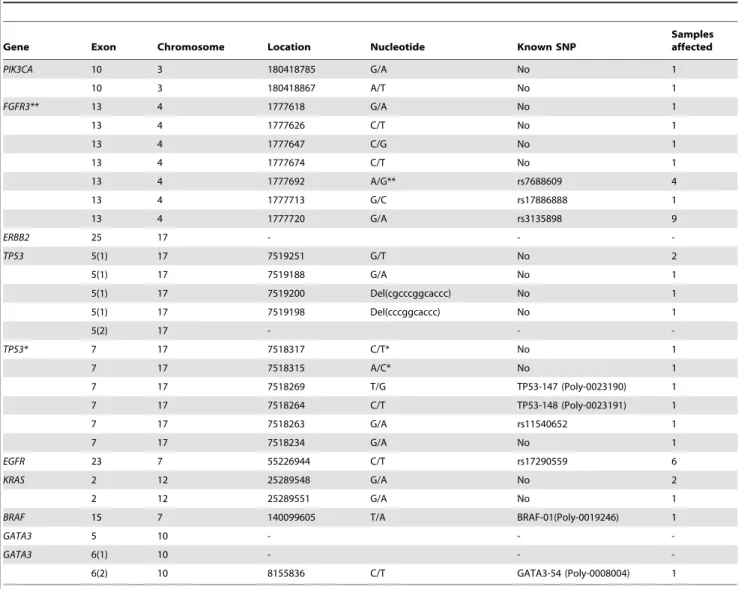
DNA extracted from paraffin-embedded tissues was also more difficult to sequence than DNA from frozen tissue [47,48]. Table 4.Mutation details from the sequencing analysis of frozen samples.
Gene Exon Chromosome Location Nucleotide Known SNP
Samples affected
PIK3CA 10 3 180418785 G/A No 1
10 3 180418867 A/T No 1
FGFR3** 13 4 1777618 G/A No 1
13 4 1777626 C/T No 1
13 4 1777647 C/G No 1
13 4 1777674 C/T No 1
13 4 1777692 A/G** rs7688609 4
13 4 1777713 G/C rs17886888 1
13 4 1777720 G/A rs3135898 9
ERBB2 25 17 - -
-TP53 5(1) 17 7519251 G/T No 2
5(1) 17 7519188 G/A No 1
5(1) 17 7519200 Del(cgcccggcaccc) No 1
5(1) 17 7519198 Del(cccggcaccc) No 1
5(2) 17 - -
-TP53* 7 17 7518317 C/T* No 1
7 17 7518315 A/C* No 1
7 17 7518269 T/G TP53-147 (Poly-0023190) 1
7 17 7518264 C/T TP53-148 (Poly-0023191) 1
7 17 7518263 G/A rs11540652 1
7 17 7518234 G/A No 1
EGFR 23 7 55226944 C/T rs17290559 6
KRAS 2 12 25289548 G/A No 2
2 12 25289551 G/A No 1
BRAF 15 7 140099605 T/A BRAF-01(Poly-0019246) 1
GATA3 5 10 - -
-GATA3 6(1) 10 - -
-6(2) 10 8155836 C/T GATA3-54 (Poly-0008004) 1
*One sample had 2 mutation/variants.
**Both, dbSNP and Ensembl, appoint G as the ancestral allele; but the overall allele frequency in both reports was 96% for A and 4% for G. doi:10.1371/journal.pone.0014522.t004
Table 5.Correlation between the quantity of DNA extracted from the paraffin-embedded tissue, used for pre-HRM PCR, and a band in the gel (p,0.001). Also, correlation between DNA quantity and the presence of a HRM curve (p,0.001).
Band in gel
DNA (ng/mL) Yes No Total %
0–30 444 72 516 0.86
.30 196 8 204 0.96
Total 640 80 720 0.89
HRM curve
DNA (ng/mL) Yes No Total %
0–30 1,272 114 1,386 0.92
.30 736 31 767 0.96
Total 2,008 145 2,153 0.93
However, the objective of this study was not to establish an optimized protocol for sequencing of DNA extracted from paraffin-embedded tissue, but to assess the screening capabilities of the HRM analysis. Once optimal experimental conditions for HRM and sequencing analyses on the frozen samples were determined, we applied them to the paraffin-embedded set, to attain a fair comparison between both sets of samples. Protocol modifications of sequencing experiments could modestly improve performance, such as the use of whole genome amplification [49,50], but this can introduce loss of heterozygosity. Steps to optimize sequencing can also include alternative primers or denaturation conditions.
Based on these considerations, our recommendations to maintain and, perhaps, enhance the screening capabilities of HRM analysis for paraffin-embedded extracted samples with a LightScannerTMwould include the following:
N
Inclusion of$30 ng total genomic DNA may increase HRM analysis success rate up to 96%.N
Pre-HRM PCR optimization should include careful primer selection to reduce GC content, adequate amplicon size, and optimal annealing temperature.N
Amplicons that failed sequencing over 50% of the times also performed poorly during HRM analysis. So it may be worthwhile to test the selected amplicons by sequencing a few samples at the beginning of the experiment.The false positive rate of HRM analysis in paraffin embedded samples was approximately 20%, which implies that additional sequencing is needed to improve accuracy in the subset of samples with a putative mutation [12]. HRM analysis on frozen samples only considered 59 of them abnormal, for 39 with real mutation/ variants. Thus, it would be necessary to sequence fewer samples for each mutation. Therefore, not only the performance is better in frozen samples with respect to paraffin-embedded samples, but also cost-efficiency.
In conclusion, HRM analysis with the LightScannerTMis a promising screening tool for mutation/variant in somatic DNA extracted from either frozen or paraffin-embedded sam-ples, although overall accuracy is better in frozen specimens, probably related to DNA quality. This method is able to detect mutations as well as known SNPs, even in genomic regions with a low mutation prevalence rate in the range of 5% or perhaps lower.
Supporting Information
Figure S1 Representation of HRM curve ofBRAFexon 15 from genomic DNA extracted from frozen samples. Red arrow: HRM curves with a plot interpreted by the software to be suspicious of harboring a nucleotide change or a mutation/variant. HRM was repeated for all these samples, and all of them were sequenced. Green arrows: HRM curves with minimal variations with respect to the averaged wild-type curve. All these samples also were sequenced and HRM was repeated. Black arrow: All normalized HRM curves considered to have a wild-type sequence. 20% of these samples were randomly chosen to be repeated and sequenced as negative controls.
Found at: doi:10.1371/journal.pone.0014522.s001 (2.49 MB TIF)
Figure S2 Example of HRM output from genomic DNA from tumor frozen samples set. A. Output of one of the 3 plates used for the initial analysis of exon 2 ofKRAS. Each square represents a well: brown squares are negative controls; grey squares represent samples with no mutation/variant; red squares represent possible mutation/variant; and green are unknown for mutation/variant. B. Normalized HRM curve from the same samples in the exon 2 of KRAS initial analysis. C. Normalized HRM curve of the repeated KRAS analysis.
Found at: doi:10.1371/journal.pone.0014522.s002 (0.68 MB TIF)
Figure S3 Samples of mutation screening with HRM technology and its validation with sequencing from paraffin-embedded samples. A. One of the assays (EGFR) performed in paraffin-embedded samples from breast cancer: 1. Normalized HRM curves of the assay; 2. Segment of sample assembled trace after sequencing, with the presence of a variant, where AA has replaced both alleles GG. B. Endometrial paraffin-embedded samples for KRAS. 1. Normalized HRM curves of the assay with elevated number of positives samples observed in the HRM curves from paraffin specimens compare to frozen samples; 2. Genotype GG has been substituted by GA.
Found at: doi:10.1371/journal.pone.0014522.s003 (9.83 MB TIF)
Table S1 Mutation details from the sequencing analysis of paraffin-embedded samples.
Found at: doi:10.1371/journal.pone.0014522.s004 (0.09 MB DOC)
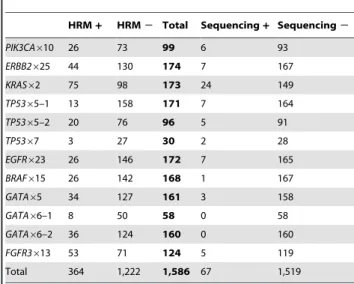
Table 6.Results of mutation screening by HRM and sequencing from the paraffin-embedded samples.
HRM+ HRM2 Total Sequencing+ Sequencing2
PIK3CA610 26 73 99 6 93
ERBB2625 44 130 174 7 167
KRAS62 75 98 173 24 149
TP5365–1 13 158 171 7 164
TP5365–2 20 76 96 5 91
TP5367 3 27 30 2 28
EGFR623 26 146 172 7 165
BRAF615 26 142 168 1 167
GATA65 34 127 161 3 158
GATA66–1 8 50 58 0 58
GATA66–2 36 124 160 0 160
FGFR3613 53 71 124 5 119
Total 364 1,222 1,586 67 1,519
doi:10.1371/journal.pone.0014522.t006
Table 7.Comparison between HRM mutation screening and sequencing of paraffin-embedded samples.
+Sequencing 2Sequencing Total
+HRM 59 305 364
2HRM 8 1,214 1,222
Total 67 1,519 1,586
Sensibility: 0.88. Specificity: 0.80. False positive: 0.20. False negative: 0.12. Accuracy: 0.80.
Note: These calculations are based uniquely on samples successfully sequenced.
Table S2 New nucleotides changes found on the study samples submitted to dbSNP (build 131).
Found at: doi:10.1371/journal.pone.0014522.s005 (0.09 MB DOC)
Author Contributions
Conceived and designed the experiments: JGB MGC MES HY JK SJC. Performed the experiments: JGB JC. Analyzed the data: JGB JC SJC. Contributed reagents/materials/analysis tools: JSW MGC MES SMH JV JL JK. Wrote the paper: JGB JSW SJC.
References
1. Ley TJ, Mardis ER, Ding L, Fulton B, McLellan MD, et al. (2008) DNA sequencing of a cytogenetically normal acute myeloid leukaemia genome. Nature 456: 66–72.
2. Pleasance ED, Stephens PJ, O’Meara S, McBride DJ, Meynert A, et al. (2010) A small-cell lung cancer genome with complex signatures of tobacco exposure. Nature 463: 184–190.
3. Stephens PJ, McBride DJ, Lin ML, Varela I, Pleasance ED, et al. (2009) Complex landscapes of somatic rearrangement in human breast cancer genomes. Nature 462: 1005–1010.
4. Futreal PA, Coin L, Marshall M, Down T, Hubbard T, et al. (2004) A census of human cancer genes. Nat Rev Cancer 4: 177–183.
5. Greenman C, Stephens P, Smith R, Dalgliesh GL, Hunter C, et al. (2007) Patterns of somatic mutation in human cancer genomes. Nature 446: 153–158. 6. Network CGAR (2008) Comprehensive genomic characterization defines
human glioblastoma genes and core pathways. Nature 455: 1061–1068. 7. Sjoblom T, Jones S, Wood LD, Parsons DW, Lin J, et al. (2006) The Consensus
Coding Sequences of Human Breast and Colorectal Cancers. Science 314: 268–274.
8. Wang TL, Rago C, Silliman N, Ptak J, Markowitz S, et al. (2002) Prevalence of somatic alterations in the colorectal cancer cell genome. Proc Natl Acad Sci U S A 99: 3076–3080.
9. Chanock S, Burdett L, Yeager M, Llaca V, Langerod A, et al. (2007) Somatic sequence alterations in twenty-one genes selected by expression profile analysis of breast carcinomas. Breast Cancer Res 9: R5.
10. Taylor CF (2009) Mutation scanning using high-resolution melting. Biochem Soc Trans 37: 433–437.
11. Fadhil W, Ibrahem S, Seth R, Ilyas M (2010) Quick-multiplex-consensus (QMC)-PCR followed by high-resolution melting: a simple and robust method for mutation detection in formalin-fixed paraffin-embedded tissue. J Clin Pathol 63: 134–140.
12. Gallegos Ruiz MI, Floor K, Rijmen F, Grunberg K, Rodriguez JA, et al. (2007) EGFR and K-ras mutation analysis in non-small cell lung cancer: comparison of paraffin embedded versus frozen specimens. Cell Oncol 29: 257–264. 13. Wittwer CT, Reed GH, Gundry CN, Vandersteen JG, Pryor RJ (2003)
High-Resolution Genotyping by Amplicon Melting Analysis Using LCGreen. Clin Chem 49: 853–860.
14. Zhou L, Wang L, Palais R, Pryor R, Wittwer CT (2005) High-resolution DNA melting analysis for simultaneous mutation scanning and genotyping in solution. Clin Chem 51: 1770–1777.
15. Do H, Krypuy M, Mitchell PL, Fox SB, Dobrovic A (2008) High resolution melting analysis for rapid and sensitive EGFR and KRAS mutation detection in formalin fixed paraffin embedded biopsies. BMC Cancer 8: 142.
16. Krypuy M, Ahmed AA, Etemadmoghadam D, Hyland SJ, DeFazio A, et al. (2007) High resolution melting for mutation scanning of TP53 exons 5-8. BMC Cancer 7: 168.
17. Lonie L, Porter DE, Fraser M, Cole T, Wise C, et al. (2006) Determination of the mutation spectrum of the EXT1/EXT2 genes in British Caucasian patients with multiple osteochondromas, and exclusion of six candidate genes in EXT negative cases. Hum Mutat 27: 1160.
18. Takano EA, Mitchell G, Fox SB, Dobrovic A (2008) Rapid detection of carriers with BRCA1 and BRCA2 mutations using high resolution melting analysis. BMC Cancer 8: 59.
19. Smith GD, Chadwick BE, Willmore-Payne C, Bentz JS (2008) Detection of epidermal growth factor receptor gene mutations in cytology specimens from patients with non-small cell lung cancer utilising high-resolution melting amplicon analysis. J Clin Pathol 61: 487–493.
20. Willmore-Payne C, Holden JA, Layfield LJ (2006) Detection of EGFR- and HER2-activating mutations in squamous cell carcinoma involving the head and neck. Mod Pathol 19: 634–640.
21. Garcia-Closas M, Egan KM, Newcomb PA, Brinton LA, Titus-Ernstoff L, et al. (2006) Polymorphisms in DNA double-strand break repair genes and risk of breast cancer: two population-based studies in USA and Poland, and meta-analyses. Hum Genet 119: 376–388.
22. Khan J, Wei JS, Ringner M, Saal LH, Ladanyi M, et al. (2001) Classification and diagnostic prediction of cancers using gene expression profiling and artificial neural networks. Nat Med 7: 673–679.
23. Chen QR, Bilke S, Wei JS, Whiteford CC, Cenacchi N, et al. (2004) cDNA array-CGH profiling identifies genomic alterations specific to stage and MYCN-amplification in neuroblastoma. BMC Genomics 5: 70.
24. Garcia-Closas M, Brinton LA, Lissowska J, Chatterjee N, Peplonska B, et al. (2006) Established breast cancer risk factors by clinically important tumour characteristics. Br J Cancer 95: 123–129.
25. Brinton LA, Sakoda LC, Lissowska J, Sherman ME, Chatterjee N, et al. (2007) Reproductive risk factors for endometrial cancer among Polish women. Br J Cancer 96: 1450–1456.
26. Garcia-Closas M, Brinton LA, Lissowska J, Richesson D, Sherman ME, et al. (2007) Ovarian cancer risk and common variation in the sex hormone-binding globulin gene: a population-based case-control study. BMC Cancer 7: 60. 27. Usary J, Llaca V, Karaca G, Presswala S, Karaca M, et al. (2004) Mutation of
GATA3 in human breast tumors. Oncogene 23: 7669–7678.
28. Thomas RK, Baker AC, DeBiasi RM, Winckler W, LaFramboise T, et al. (2007) High-throughput oncogene mutation profiling in human cancer. Nat Genet 39: 347–351.
29. Olivier M, Langerod A, Carrieri P, Bergh J, Klaar S, et al. (2006) The Clinical Value of Somatic TP53 Gene Mutations in 1,794 Patients with Breast Cancer. Clin Cancer Res 12: 1157–1167.
30. Lax SF, Kendall B, Tashiro H, Slebos RJ, Hedrick L (2000) The frequency of p53, K-ras mutations, and microsatellite instability differs in uterine endome-trioid and serous carcinoma: evidence of distinct molecular genetic pathways. Cancer 88: 814–824.
31. Ikediobi ON, Davies H, Bignell G, Edkins S, Stevens C, et al. (2006) Mutation analysis of 24 known cancer genes in the NCI-60 cell line set. Mol Cancer Ther 5: 2606–2612.
32. Marks JL, McLellan MD, Zakowski MF, Lash AE, Kasai Y, et al. (2007) Mutational analysis of EGFR and related signaling pathway genes in lung Adenocarcinomas identifies a novel somatic kinase domain mutation in FGFR4. PLoS ONE 2: e426.
33. Haque KA, Pfeiffer RM, Beerman MB, Struewing JP, Chanock SJ, et al. (2003) Performance of high-throughput DNA quantification methods. BMC Biotechnol 3: 20.
34. Dobrowolski SF, McKinney JT, Amat di San Filippo C, Giak Sim K, Wilcken B, et al. (2005) Validation of dye-binding/high-resolution thermal denaturation for the identification of mutations in the SLC22A5 gene. Hum Mutat 25: 306–313. 35. Willmore C, Holden JA, Zhou L, Tripp S, Wittwer CT, et al. (2004) Detection of c-kit-activating mutations in gastrointestinal stromal tumors by high-resolution amplicon melting analysis. Am J Clin Pathol 122: 206–216.
36. Staats B, Qi L, Beerman M, Sicotte H, Burdett LA, et al. (2005) Genewindow: an interactive tool for visualization of genomic variation. Nat Genet 37: 109–110.
37. Frazer KA, Ballinger DG, Cox DR, Hinds DA, Stuve LL, et al. (2007) A second generation human haplotype map of over 3.1 million SNPs. Nature 449: 851–861.
38. Packer BR, Yeager M, Burdett L, Welch R, Beerman M, et al. (2006) SNP500Cancer: a public resource for sequence validation, assay development, and frequency analysis for genetic variation in candidate genes. Nucleic Acids Res 34: D617–621.
39. Chanock SJ, Thomas G (2007) The devil is in the DNA. Nat Genet 39: 283–284. 40. Franklin WA, Haney J, Sugita M, Bemis L, Jimeno A, et al. (2010) KRAS mutation: comparison of testing methods and tissue sampling techniques in colon cancer. J Mol Diagn 12: 43–50.
41. Rivero ER, Neves AC, Silva-Valenzuela MG, Sousa SO, Nunes FD (2006) Simple salting-out method for DNA extraction from formalin-fixed, paraffin-embedded tissues. Pathol Res Pract 202: 523–529.
42. Williams C, Ponten F, Moberg C, Soderkvist P, Uhlen M, et al. (1999) A high frequency of sequence alterations is due to formalin fixation of archival specimens. Am J Pathol 155: 1467–1471.
43. Wittwer CT (2009) High-resolution DNA melting analysis: advancements and limitations. Hum Mutat 30: 857–859.
44. Garritano S, Gemignani F, Voegele C, Nguyen-Dumont T, Le Calvez-Kelm F, et al. (2009) Determining the effectiveness of High Resolution Melting analysis for SNP genotyping and mutation scanning at the TP53 locus. BMC Genet 10: 5.
45. Lehmann U, Kreipe H (2001) Real-time PCR analysis of DNA and RNA extracted from formalin-fixed and paraffin-embedded biopsies. Methods 25: 409–418.
46. Dedhia P, Tarale S, Dhongde G, Khadapkar R, Das B (2007) Evaluation of DNA extraction methods and real time PCR optimization on formalin-fixed paraffin-embedded tissues. Asian Pac J Cancer Prev 8: 55–59.
47. Wen L (2001) Two-step cycle sequencing improves base ambiguities and signal dropouts in DNA sequencing reactions using energy-transfer-based fluorescent dye terminators. Mol Biotechnol 17: 135–142.
49. Geigl JB, Speicher MR (2007) Single-cell isolation from cell suspensions and whole genome amplification from single cells to provide templates for CGH analysis. Nat Protoc 2: 3173–3184.