ACPD
12, 14363–14392, 2012Estimation of lifetime of carbonaceous
aerosol
X. L. Pan et al.
Title Page
Abstract Introduction
Conclusions References
Tables Figures
◭ ◮
◭ ◮
Back Close
Full Screen / Esc
Printer-friendly Version Interactive Discussion
Discussion
P
a
per
|
Dis
cussion
P
a
per
|
Discussion
P
a
per
|
Discussio
n
P
a
per
|
Atmos. Chem. Phys. Discuss., 12, 14363–14392, 2012 www.atmos-chem-phys-discuss.net/12/14363/2012/ doi:10.5194/acpd-12-14363-2012
© Author(s) 2012. CC Attribution 3.0 License.
Atmospheric Chemistry and Physics Discussions
This discussion paper is/has been under review for the journal Atmospheric Chemistry and Physics (ACP). Please refer to the corresponding final paper in ACP if available.
Estimation of lifetime of carbonaceous
aerosol from open crop residue burning
during Mount Tai Experiment 2006
(MTX2006)
X. L. Pan1,2, Y. Kanaya1, Z. F. Wang2, Y. Komazaki1, F. Taketani1, H. Akimoto3, P. Pochanart4, and Y. Liu2
1
Research Institute for Global Change, Japan Agency for Marine-Earth Science and Technology, Japan
2
State Key Laboratory of Atmospheric Boundary Layer Physics and Atmospheric Chemistry, Institutes of Atmospheric Physics, Chinese Academy of Sciences, Beijing, China
3
Acid Depositions and Oxidant Research Center, Asia Center for Air Pollution Research, Japan
4
School of Social and Environmental Development, National Institute of Development Administration, Bangkok, Thailand
ACPD
12, 14363–14392, 2012Estimation of lifetime of carbonaceous
aerosol
X. L. Pan et al.
Title Page
Abstract Introduction
Conclusions References
Tables Figures
◭ ◮
◭ ◮
Back Close
Full Screen / Esc
Printer-friendly Version Interactive Discussion
Discussion
P
a
per
|
Dis
cussion
P
a
per
|
Discussion
P
a
per
|
Discussio
n
P
a
per
|
Received: 1 May 2012 – Accepted: 12 May 2012 – Published: 7 June 2012
Correspondence to: X. L. Pan ([email protected])
ACPD
12, 14363–14392, 2012Estimation of lifetime of carbonaceous
aerosol
X. L. Pan et al.
Title Page
Abstract Introduction
Conclusions References
Tables Figures
◭ ◮
◭ ◮
Back Close
Full Screen / Esc
Printer-friendly Version Interactive Discussion
Discussion
P
a
per
|
Dis
cussion
P
a
per
|
Discussion
P
a
per
|
Discussio
n
P
a
per
|
Abstract
Studying the emission ratios of carbonaceous aerosols (element carbon, EC, and organic carbon, OC) from open biomass burning helps to reduce uncertainties in emission inventories and provides necessary constraints for model simulations. We
measured apparent elemental carbon (ECa) and OC concentrations at the summit of
5
Mount Tai (Mt. Tai) during intensive open crop residue burning (OCRB) episodes us-ing a Sunset OCEC analyzer. Equivalent black carbon (BCe) concentrations were de-termined using a Multiple Angle Absorption Photometer (MAAP). In the fine particle mode, OC and EC showed strong correlations (r >0.9) with carbon monoxide (CO). Footprint analysis using the FLEXPART WRF model indicated that OCRB in central
10
east China (CEC) had a significant influence on ambient carbonaceous aerosol load-ings at the summit of Mt. Tai. ∆ECa/∆CO ratios resulting from OCRB plumes were 14.3±1.0 ng m−3ppbv−1 at Mt. Tai. This ratio was more than three times those
result-ing from urban pollution in CEC, demonstratresult-ing that significant concentrations of soot
particles were released from OCRB. ∆OC/∆CO ratio from fresh OCRB plumes was
15
found to be 41.9±2.6 ng m−3ppbv−1 in PM1. The transport time of smoke particles was estimated using the FLEXPART WRF tracer model by releasing inert particles from the ground layer inside geographical regions where large numbers of hotspots were detected by a MODIS satellite sensor. Fitting regressions using the e-folding ex-ponential function indicated that the removal efficiency of OC (normalized to CO) was
20
much larger than that of ECa mass, with mean lifetimes of 27 h (1.1 days) for OC and 105 h (4.3 days) for ECa, respectively. The lifetime of black carbon estimated for the OCRB events in east China was comparably lower than the values normally adopted in the transport models. Short lifetime of organic carbon highlighted the vulnerability of OC to cloud scavenging in the presence of water-soluble organic species from biomass
25
combustion.
ACPD
12, 14363–14392, 2012Estimation of lifetime of carbonaceous
aerosol
X. L. Pan et al.
Title Page
Abstract Introduction
Conclusions References
Tables Figures
◭ ◮
◭ ◮
Back Close
Full Screen / Esc
Printer-friendly Version Interactive Discussion
Discussion
P
a
per
|
Dis
cussion
P
a
per
|
Discussion
P
a
per
|
Discussio
n
P
a
per
|
1 Introduction
Open biomass burning (OBB, including disposal of crop residues and wild fires in grassland/forest areas) has significant impacts on regional air quality (Crounse et al., 2009), including increased atmospheric turbidity (Badarinath et al., 2004), tropospheric ozone variability (Kondo et al., 2004) and respiratory disease morbidity (Arbex et al.,
5
2007). Carbonaceous aerosol particles (such as black carbon (BC) and organic car-bon (OC)) released from burning can be incorporated into cloud processes, eventually influencing regional climate changes (Jourdain et al., 2007; Tosca et al., 2010). In-tensive open crop residue burning (OCRB) during the harvest season in east China has recently become a significant concern. It has been reported that approximately
10
30–80 % of agricultural residues were used as biomass fuels, and that approximately one third of crop biomass was openly combusted in fields (Yamaji et al., 2010). In studies of Asian regional pollution transport and ozone photochemistry, discrepancies between observations and model simulations were partly attributed to biases in esti-mated open biomass burning emissions (uncertainties>450 % at the 95 % confidence
15
interval) (Streets et al., 2003).
Emissions characteristics of trace gases and aerosol particles from biomass burn-ing have been compiled in the literature (Andreae and Merlet, 2001). For corrobora-tion, emission ratios of aerosols to carbon monoxide obtained from in-situ observa-tions and laboratory experiments could serve as excellent constraints for improving
20
their emission inventories. Previous studies indicated that emission ratios of black carbon to CO from OBB were 25 ng m−3ppbv−1 in India (Badarinath et al., 2007), 2.3±2.2 ng m−3ppbv−1in North America (Kondo et al., 2011) and∼11 µg m3ppbv−1in
eastern China (Pan et al., 2011). Differences among biofuel types, combustion phases, diffusion conditions and dry deposition processes likely resulted in the large variations
25
ACPD
12, 14363–14392, 2012Estimation of lifetime of carbonaceous
aerosol
X. L. Pan et al.
Title Page
Abstract Introduction
Conclusions References
Tables Figures
◭ ◮
◭ ◮
Back Close
Full Screen / Esc
Printer-friendly Version Interactive Discussion
Discussion
P
a
per
|
Dis
cussion
P
a
per
|
Discussion
P
a
per
|
Discussio
n
P
a
per
|
among studies due to different emission scenarios, condensation or formation of sec-ondary organic species and removal processes (Maria et al., 2003). Better estimation of its lifetime, especially for BC, is crucial for regional/global transport model. Investiga-tions on basis of theoretical BC modules have been performed for decade, and different hypotheses of mixing state, size distribution and hydrophilic properties of BC could lead
5
to significant varieties in the lifetime, ranging from 4.7 to 98 days (Croft et al., 2005; Stier et al., 2005). In quantifying climate effect of BC, employing different aging parameters from region to region was much reasonable than using a global unique value. Unfortu-nately investigation of lifetime of BC from perspective of field measurements was still limited, especially in the East Asia region. In the present study, we examined variations
10
in the carbonaceous aerosol correlations of smoke particles observed at the summit of Mount Tai (Mt. Tai) in Central East China (CEC) during the harvest season, in relation to the transport time from the burned area. It should be noted that soot particles in this study were determined using a Sunset Laboratory semi-continuous OCEC analyzer and the term “apparent elemental carbon” (ECa, operationally defined as the fraction
15
of refractory carbon compounds in the presence of oxygen) was adopted in this context because of uncertainties arising from artificial temperature control protocols (Andreae and Gelencser, 2006). Black carbon mass was determined using optical techniques and was defined as “equivalent black carbon” (BCe).
2 Experimental
20
Carbonaceous aerosol concentration measurements were performed on the summit of Mt. Tai (36.26◦N, 117.11◦E, 1534 m a.s.l.) during a field campaign termed MTX2006 (Fig. 1). Mt. Tai is an isolated peak in the middle of central east China (CEC) where open biomass burning in the surrounding areas was active during the harvest season (June). Carbonaceous aerosol emissions from biomass burning and their impact on the
25
regional environment have been reported (Fu et al., 2008; Li et al., 2008; Inomata et al., 2009; Yamaji et al., 2010). Concentrations of ECaand OC were determined using
ACPD
12, 14363–14392, 2012Estimation of lifetime of carbonaceous
aerosol
X. L. Pan et al.
Title Page
Abstract Introduction
Conclusions References
Tables Figures
◭ ◮
◭ ◮
Back Close
Full Screen / Esc
Printer-friendly Version Interactive Discussion
Discussion
P
a
per
|
Dis
cussion
P
a
per
|
Discussion
P
a
per
|
Discussio
n
P
a
per
|
an OCEC analyzer (Sunset Lab) equipped with a PM1cyclone (1 µm diameter cutoff,
URG-2000-30EHB, URG Inc.) with a time resolution of 1 h. The NIOSH temperature protocol (600◦C (holding 80 s), 840◦C (holding 90 s), oven off (holding 55 s) in pure He; afterward 550◦C (holding 30 s), 850◦C (holding 110 s) and oven off (85 s) in an O2/He environment) was used from 2 June, 13:00 LST to 20 June, 04:00 LST.
Calibra-5
tion using standard CH4gas was performed for 120 s at the end of each analysis.
Com-parisons between ECameasurements using the IMPROVE and NIOSH protocols at Mt.
Tai suggested a systematic bias of 31 %. Uncertainties in OC measurements were less than±25 %. A detailed description of instrumentation and temperature program used
has previously been reported (Kanaya et al., 2008). BCe mass was measured using
10
a multiple angle absorption photometer (MAAP5012, Thermo) whose uncertainty was estimated to be less than 15 %. A fixed mass-specific aerosol absorption coefficient (MAC) of 6.6 m2g−1at a wavelength (λ) of 637 nm was adopted to convert the absorp-tion coefficient to mass concentrations. Sampling was alternated between PM1 and
PM2.5using an automated valve switch between two cyclones (URG-2000-30EHB and
15
URG-2000-30EH, URG Inc.) every 30 min.
CO mixing ratios were measured using a gas filter non-dispersive infrared carbon monoxide gas analyzer (Thermo Electron Co., Model 48C). Zero calibrations were per-formed during the first 10 min of each hour using purified air (Thermo Electron Co., Model 111). Span calibrations were performed using a standard CO gas (1.59 ppmv,
20
produced by Taiyo Nissan Corp., Japan). Uncertainties were less than 5 %.
3 Results and discussion
3.1 Identification of OCRB episodes and supporting observations
At Mt. Tai, OCRB-dominated pollution episodes were determined from measurements of biomass burning tracers. Two discrete OCRB plumes (6 June, 00:00–7 June,
25
ACPD
12, 14363–14392, 2012Estimation of lifetime of carbonaceous
aerosol
X. L. Pan et al.
Title Page
Abstract Introduction
Conclusions References
Tables Figures
◭ ◮
◭ ◮
Back Close
Full Screen / Esc
Printer-friendly Version Interactive Discussion
Discussion
P
a
per
|
Dis
cussion
P
a
per
|
Discussion
P
a
per
|
Discussio
n
P
a
per
|
elevated concentrations of levoglucosan (459 ng m−3) and galactosan (12.8 ng m−3),
measured using GC-MS (Fu et al., 2008). High ∆NMVOCs/∆CO ratios (acetonitrile,
formaldehyde, acetaldehyde, etc.) were also reported by Inomata et al. (2010) using
PTR-MS during OCRB pollution episodes. Smoke tracer such as CH3Cl and CH3Br
also have been reported to have higher∆CH3Cl/∆CO and∆CH3Br/∆CO ratios during
5
OCRB episodes, with mean values of 1.88 (r =0.82) and 0.012 (r=0.72), respectively (Suthawaree et al., 2010). OCRB emissions accounted for 26 %, 62 %, 79 % and 80 %
of O3, CO, BC and OC concentrations, respectively, at the summit of Mt. Tai based
on simulations using the models-3 community multi-scale air quality modeling system (CMAQ) (Yamaji et al., 2010).
10
In this study, footprint regions (<100 m height) for the air masses sampled at Mt. Tai were determined using the FLEXPART WRF model (Version 6.2), running in a backward mode, simulating the transport of 30000 tracer particles released from the measurement site. Detailed specifications of the FLEXPART model have been re-ported (Stohl et al., 1998). The 3D-meteorological field was calculated using WRF
15
(Version 3.3) with spatial resolution of 75 km×75 km. The initial input
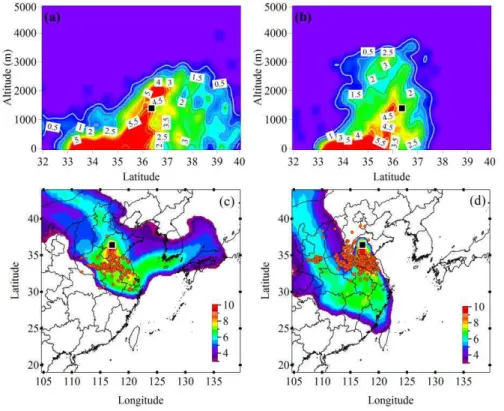
meteorologi-cal NCEP/FNL data were obtained from the Global Data Assimilation System (GDAS, http://dss.ucar.edu/datasets/ds083.2/). As shown in Fig. 2c and d, the footprint regions covered nearly all the hotspots detected by the Aqua/Terra MODIS satellite, providing evidence of the potential influence from ground-based OCRB emissions.
20
3.2 Carbonaceous aerosol mass loadings
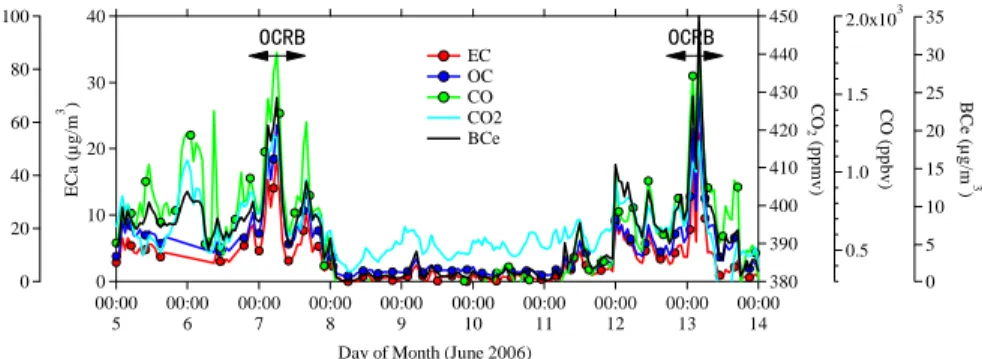
Time-series of carbonaceous aerosol measurements at Mt. Tai are presented in
Fig. 3. It was noted that during OCRB-dominated episodes ECaconcentrations peaked
twice (7 June, 06:00 LST and 13 June, 04:00 LST), with hourly mean values of 18.9 and 22.4 µg m−3, respectively. The corresponding OC concentrations were 58.9 and
25
76.7 µg m−3, respectively. From 8 June–11 June, ambient carbonaceous aerosol con-centrations were low because the air masses were largely transported from the
ACPD
12, 14363–14392, 2012Estimation of lifetime of carbonaceous
aerosol
X. L. Pan et al.
Title Page
Abstract Introduction
Conclusions References
Tables Figures
◭ ◮
◭ ◮
Back Close
Full Screen / Esc
Printer-friendly Version Interactive Discussion
Discussion
P
a
per
|
Dis
cussion
P
a
per
|
Discussion
P
a
per
|
Discussio
n
P
a
per
|
Mongolian Plateau region and the impacts from ground emissions on these air masses were weak. Concentrations of CO, CO2and BCeshowed similar temporal variations. At
the summit of Mt. Tai, mean ECaand OC concentrations during OCRB episodes were
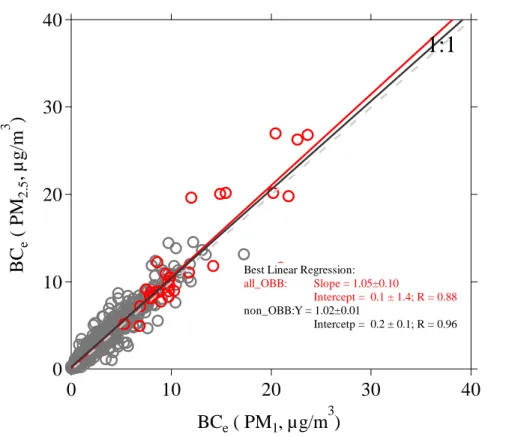
7.3 and 30.1 µg m−3, respectively, 5–6 times higher than those (ECa: 1.6 µg m−3 and OC: 5.3 µg m−3) during non-OCRB episodes. BCe concentrations in PM1 and PM2.5
5
were alternately measured using an automated switching valve. Good consistencies
between PM1and PM2.5 were observed during OCRB-dominant and non-OCRB
pe-riods (Fig. 4). Linear regression fitting indicated that the BCe(PM2.5)/BCe(PM1) ratio was 1.05 (r=0.88) during OCRB episodes, slightly higher than that (1.02,r=0.96) for
non-OCRB episodes, suggesting that mass concentration of ECa in PM1 contributed
10
to over 95 % ECamass in PM2.5. This result is consistent with past studies suggesting that the volume equivalent median diameters of smoke particles ranged from 100 to 300 nm (Reid et al., 2005; Schwarz et al., 2008; Hosseini et al., 2010).
3.3 Carbonaceous aerosol correlations
Carbonaceous aerosol relationships during OCRB episodes were characterized using
15
linear regressions of concentrations of the species of interest versus the reference gas, described as∆(x)/∆CO=((x)ORCB-(x)baseline)/(COORCB-CObaseline). CO was selected as the reference gas because of its incomplete combustion origins and relatively long lifetime in the atmosphere. In this study, x represented ECa and OC (in ng m−
3 ). The impact of CO production from the oxidation of volatile organic compounds (VOCs) was
20
ACPD
12, 14363–14392, 2012Estimation of lifetime of carbonaceous
aerosol
X. L. Pan et al.
Title Page
Abstract Introduction
Conclusions References
Tables Figures
◭ ◮
◭ ◮
Back Close
Full Screen / Esc
Printer-friendly Version Interactive Discussion
Discussion
P
a
per
|
Dis
cussion
P
a
per
|
Discussion
P
a
per
|
Discussio
n
P
a
per
|
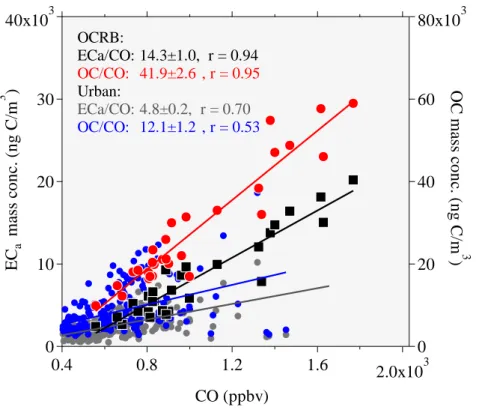
3.3.1 ∆ECa/∆CO ratios
Strong ECa-CO correlations were found during the identified OCRB episodes.
Over-all, the average ∆ECa/∆CO ratios in OCRB plume was 14.3 ng m−3ppbv−1 at Mt. Tai (Fig. 5). Detailed descriptions of mass concentrations of carbonaceous aerosols and its correlations are listed in Table 2. The values measured at Mt. Tai were
com-5
parable with airborne measurements made using a single particle soot photometer (SP2) during the 2006 TexAQS campaign (average∆BC/∆CO of 13.8 ng m−3ppbv−1, converted from a ∆CO/∆CO2 ratio of 102±25 ppbv ppmv−
1
and a ∆BC/∆CO2 ratio of 1770±400 ng BC kg−1 air ppmv−1) in fresh OBB plumes. The ratios in this study
were approximately 50 % higher than those reported by Andreae and Merlet (2001)
10
(∆ECa/∆CO ratios of 9.4 ng m− 3
ppbv−1for agricultural residue burning, converted from units of g(EC)/g(CO), assuming a molar volume of 22.4 L under STP conditions for CO) and measurements (10.3–11.6 ng m−3ppbv−1for open biomass burning plumes) at Mt. Huang in eastern China (Pan et al., 2011). The∆ECa/∆CO ratio at Mt. Tai was similar to those reported for emissions from residential wood burning stoves commonly used in
15
some rural communities (Roden et al., 2006; Shen et al., 2010). This result was reason-able because OCRB was normally characterized by fixed-size biomass piles with early intense flaming combustion and later smoldering combustion with lower temperature that produce larger condensation nuclei and un-combusted condensate (Reid et al., 1998, 2005). It is worthy to note that aerosol particles from OCRB sampled at the
sum-20
mit of Mt. Tai generally had transport times of more than 10 h after being released. The average relative humidity of the air mass over the 3-day back-trajectories was found to be∼50 % based on ensemble calculations using the Hysplit model (version 4.9), which
indicating that aging processes and consequent cloud scavenging likely affected.
3.3.2 ∆OC/∆CO ratios
25
Previous studies have demonstrated that the carbon/oxygen content of biofuels, com-bustion phase, atmospheric photochemistry and removal processes can lead to large
ACPD
12, 14363–14392, 2012Estimation of lifetime of carbonaceous
aerosol
X. L. Pan et al.
Title Page
Abstract Introduction
Conclusions References
Tables Figures
◭ ◮
◭ ◮
Back Close
Full Screen / Esc
Printer-friendly Version Interactive Discussion
Discussion
P
a
per
|
Dis
cussion
P
a
per
|
Discussion
P
a
per
|
Discussio
n
P
a
per
|
variations in observed∆OC/∆CO ratios for biomass burning plumes. At the summit of Mt. Tai, apparent increases in∆OC/∆CO ratios were observed during OCRB episodes (Fig. 5). The average∆OC/∆CO ratio was found to be 41.9±2.6 ng m−3ppbv−1, similar
with that (44.8 ng m−3ppbv−1) reported by Andreae and Merlet (2001) for the burning of agricultural residues. However, our result was lower than the values for pine-savanna
5
fires ranging from 70.5 to 105.8 ng m−3ppbv−1 (Yokelson et al., 2007), derived from
∆OA(organic aerosols)/∆CO ratio of 148 ng m−3ppbv−1 assuming ∆OA/∆OC=1.4– 2.1, and aircraft measurement of the∆OA/∆CO ratio (165 ng m−3ppbv−1) for OBB
dur-ing the MILAGRO campaign (DeCarlo et al., 2010), assumdur-ing the similar ∆OA/∆OC
range. Measurements in Guangzhou demonstrated that the mass size distribution of
10
OC had a peak diameter between 1–1.8 µm in biomass burning smoke (Yu, 2009). At
Mt. Tai, OC concentrations were measured using a cutoff of PM1 and the exclusion
of OC with aerodynamic diameters larger than 1 µm might have led to an
underesti-mation of the ambient∆OC/∆CO ratio. However, airborne sampling of biomass
burn-ing plumes in North America (Clarke et al., 2007) found that the submicron fraction
15
of OC may also be substantial, and ∆volatile OC (fraction of OC lost by heating to 400◦C)/
∆CO and ∆ refractory OC (fraction of OC not lost by heating to 400◦C)/
∆CO ratios were 91±3 and 34±3 ng m−3ppbv−1, respectively, much higher than the
obser-vation at summit of Mt. Tai. The preferential loss of OC during its upward transport could provide a plausible explanation for this. In the next section, we study the features
20
as time evolution of the∆OC/∆CO ratio, using the transport time.
3.4 Impact of transport on carbonaceous aerosol relationships
3.4.1 Definition of transport time
The transport times of smoke particles sampled at each site were calculated based on forward simulations using the FLEXPART-WRF model by releasing specific numbers of
25
ACPD
12, 14363–14392, 2012Estimation of lifetime of carbonaceous
aerosol
X. L. Pan et al.
Title Page
Abstract Introduction
Conclusions References
Tables Figures
◭ ◮
◭ ◮
Back Close
Full Screen / Esc
Printer-friendly Version Interactive Discussion
Discussion
P
a
per
|
Dis
cussion
P
a
per
|
Discussion
P
a
per
|
Discussio
n
P
a
per
|
of OCRB episodes in the CEC. We estimated the locations of OCRB activities accord-ing to hotspot data derived from MODIS satellite remote sensaccord-ing. Tracer particles were released from identified geographical regions (latitude 33◦N–34◦N; longitude 116◦E–
118◦E) at heights between 5–10 m from 4 June, 18:00 LST–18 June, 23:00 LST at a
fixed time interval (1 h). As shown in Fig. 2a and b, the upward transport pattern of
5
OCRB plumes was excellently captured by the model. The transport time (T) of a sin-gle smoke particle (i), released at local time (t0) and sampled at local time (t) was expressed as:
Ttransport time (i)=T(i)−T0(i) (1)
The characteristic transport time of a set of particles (N) sampled at the site at time
10
twas defined as its arithmetic average:
¯T= 1 N
XN
i=1T(i) (2)
Uncertainties were estimated as their standard deviations:
σ=
r
1 N−1
XN
i=1(Ti−T)
2 (3)
In the Mt. Tai campaign, we calculated the∆ECa/∆CO,∆OC/∆CO and∆OC/∆ECa
ra-15
tios over a time window of 6 h and moved the analysis time window from 6 June, 10:00 to 7 June, 09:00 LST and from 12 June, 18:00 to 13 June, 09:00 LST at a time step of 3 h. The corresponding transport times of tracer particles sampled at the site were estimated according to Eqs. (2) and (3). Sensitivity tests with different time windows (ranging from 5 to 7 h) only caused∼10 % variation in∆ECa/∆CO ratios and less than
20
ACPD
12, 14363–14392, 2012Estimation of lifetime of carbonaceous
aerosol
X. L. Pan et al.
Title Page
Abstract Introduction
Conclusions References
Tables Figures
◭ ◮
◭ ◮
Back Close
Full Screen / Esc
Printer-friendly Version Interactive Discussion
Discussion
P
a
per
|
Dis
cussion
P
a
per
|
Discussion
P
a
per
|
Discussio
n
P
a
per
|
3.4.2 Estimated loss rate of ECaand OC
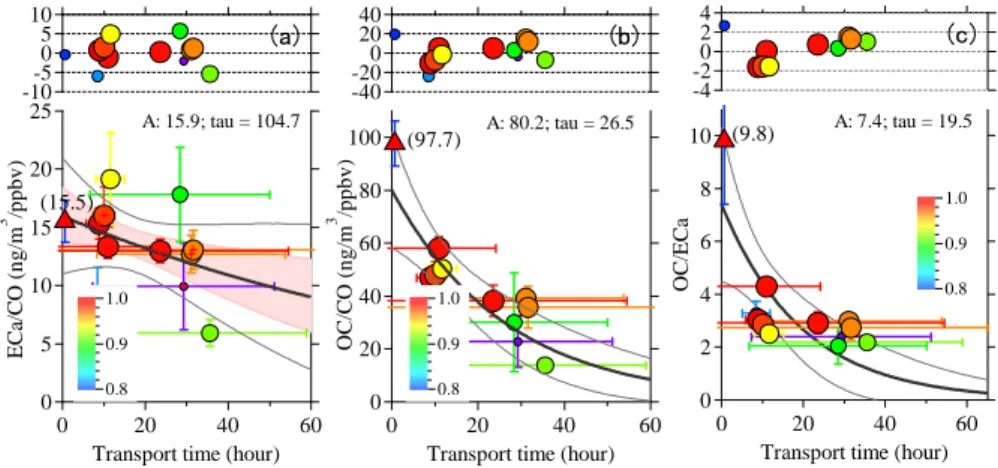
The relationship between carbonaceous aerosol ratios and transport time at Mt. Tai
is presented in Fig. 6. Generally, we found that the ∆ECa/∆CO, ∆OC/∆CO and
∆OC/∆ECa ratios declined with increasing transport time from T<1 h to T>40 h. For clarification, we classified the transport time into three subgroups (T<15 h,
5
20<T30 h and >30 h). As shown in Table 3, ∆ECa/∆CO ratios decreased from 14.5 to 10.5 µg m3ppbv−1 when the transport time increased from 10 h to 32.7 h (∼40 %
decrease). Our recent field measurement at Rudong (in East China, on June 2010) in-dicated that smoke particles had∆ECa/∆CO, ∆OC/∆CO ratios of 15.5 ng m−3ppbv−1 and 97.7 ng m−3ppbv−1respectively when observation was in the proximity of OCRB
10
sources (Pan et al., 2012). The age of smoke particles (∼0.7 h) from OCRB were only
roughly determined by dividing the maximum geographic distance (10 km) by the lo-cal wind speed, since FLEXPART-WRF model was unable to estimate the exact age of tracer particles sampled due to the coarse spatial resolution (75 km×75 km) of the
simulations. Herein the results at Rudong (only one point, the filled-triangle in Fig. 6)
15
were also included in the following curve fitting regressions. The fitting equation is as following:
f(x)=A×exp(−1·xτ), (4)
Where the independent variable x corresponds to transport time and τ indicates
the lifetime of carbonaceous aerosols. Relationships between ∆ECa/∆CO ratios and
20
OCRB smoke transport time are presented in Fig. 6a. The fitting curve suggested that the emission ratio of ECafrom OCRB under the initial conditions (y-intercept of fitting curve) was 15.9 ng m−3ppbv−1. The lifetime of ECa was determined to be 105 h (4.3 days) with extreme large uncertainty (seen the gray line in Fig. 6a). Fitting result only with the data (correlations efficient greater than 0.95) indicated that ECa lifetime was
25
ACPD
12, 14363–14392, 2012Estimation of lifetime of carbonaceous
aerosol
X. L. Pan et al.
Title Page
Abstract Introduction
Conclusions References
Tables Figures
◭ ◮
◭ ◮
Back Close
Full Screen / Esc
Printer-friendly Version Interactive Discussion
Discussion
P
a
per
|
Dis
cussion
P
a
per
|
Discussion
P
a
per
|
Discussio
n
P
a
per
|
been estimated in the past model-based studies (Table 4). Our value is lower than esti-mations (6–10 days) derived from simulations of the global black carbon model (Cooke and Wilson, 1996). Simulations of the TRACE-P period using the GEOS-chem model indicated that black carbon outflowing from East Asia had a lifetime of 5.8±1.8 days
(Park et al., 2005), comparable to our results. A sensitivity test with an off-line global
5
transport chemistry model (TM5) indicated that lifetime of BC was 4.7 days under the presumption that BC was externally mixed in the accumulation mode and did not ex-perience any changes in the hygroscopic properties due to aging; however, a longer BC lifetime (6.2 days) was expected if aging processes (condensation of H2SO4 and coagulation with soluble particles) and size distribution of BC masses were taken into
10
considerations (Vignati et al., 2010). Furthermore, Croft et al. (2005) suggested that the BC lifetime can vary with the processes (condensation, coagulation, and oxidation) we take into account, suggesting that better understanding of chemical processes in different atmospheric environment is essential, rather than estimating a single lifetime of BC over a global scale. In the present study we have just reported the overall
life-15
time of OCRB-derived black carbon without specifying the explicit processes involved. Additional uncertainty might be introduced from systematic bias inherent to the mea-surement method. However we found very similar estimations by using∆ECa/∆CO2,
∆BCe/∆CO and ∆BCe/∆CO2 ratios with means of 113 h (4.7 days), 116 h (4.8 days) and 104 h (4.3 days), and thus the additional uncertainty is not large.
20
Regression fitting (Fig. 6b) illustrated that OC from OCRB had a much faster loss rate than that of ECa. The net lifetime of OC in OCRB smoke was estimated to be 27 h
(1.1 days). Based on filter-based sampling,∼64 % of OC in PM2.5from OCRB smoke
was identified to be water-soluble (Fu et al., 2008), suggesting that OC is susceptible to cloud scavenging processes. Field studies of OBB smoke in the Yucatan indicated
25
rapid secondary organic aerosol formation could lead to OA/CO ratios more than dou-bling in 1.4±0.7 h (Yokelson et al., 2007). Conceptual models have also demonstrated
that∆OA/∆CO ratios can double within photochemical ages of less than 50 h because of oxidation and the formation of less volatile organics (Dunlea et al., 2009) while the
ACPD
12, 14363–14392, 2012Estimation of lifetime of carbonaceous
aerosol
X. L. Pan et al.
Title Page
Abstract Introduction
Conclusions References
Tables Figures
◭ ◮
◭ ◮
Back Close
Full Screen / Esc
Printer-friendly Version Interactive Discussion
Discussion
P
a
per
|
Dis
cussion
P
a
per
|
Discussion
P
a
per
|
Discussio
n
P
a
per
|
ratio can also decrease dramatically from scavenging processes of organics. Here we
should note the difference between OC and OA; as opposed to OC, OA can be
in-creased by the acquisition of oxygen atoms in the particles. Therefore the OC might be influenced more strongly by the loss. In the present study we did observe a gradual de-creasing trend. The y-intercept from linear fitting was found to be 80.3 ng m−3
ppbv−1 ;
5
approximately 20 % lower than the∆OC/∆CO ratio measured in the fresh plumes dur-ing the Rudong campaign mentioned earlier.
The ∆OC/∆ECa ratios also decreased with increasing transport time (Fig. 6c). Ac-cording to fitting results, the∆OC/∆ECa ratio for fresh smoke in the submicron mode was 7.7 (y-intercept) and the∆OC/∆ECaratio in PM2.5was estimated to be 12.8,
as-10
suming that the OC mass in PM1 accounted for 60 % of the OC mass in PM2.5 (Yu,
2009). Our result was 64 % higher than the values reported by Andreae and Mer-let (2001) (4.7) and airborne measurements (OC/ECa=6.25) in southern Africa during the dry biomass burning season (Kirchstetter et al., 2003). In India, the∆OC/∆ECa ra-tios of indoor biomass burning (Rehman et al., 2011) and outdoor wood-fuel/agricultural
15
waste burning (Ram and Sarin, 2010) were reported to be 5.3±1.6 and 7.8±2.4,
re-spectively, considerably less than the value in this study. These differences could result from the variety of biomass burned and different combustion conditions. During OCRB episodes in CEC, crop residues to be burnt were normally piled up or bundled together. These conditions easily produce oxygen-limited conditions in the interior flaming zone
20
and lower external temperatures during the later smoldering stages, which tends to produce more organic particles because of the condensation of volatilized matter on any available nuclei or un-combusted condensate (Reid et al., 2005).
4 Conclusions
In the present study, we analyzed ambient concentrations of carbonaceous aerosols
25
(including ECa, OC, BCe, CO, CO2) measured during the intensive OCRB season
ACPD
12, 14363–14392, 2012Estimation of lifetime of carbonaceous
aerosol
X. L. Pan et al.
Title Page
Abstract Introduction
Conclusions References
Tables Figures
◭ ◮
◭ ◮
Back Close
Full Screen / Esc
Printer-friendly Version Interactive Discussion
Discussion
P
a
per
|
Dis
cussion
P
a
per
|
Discussion
P
a
per
|
Discussio
n
P
a
per
|
determined using a Sunset OCEC analyzer with the NIOSH temperature control pro-tocol and BCeconcentrations were determined using a multiple angle absorption pho-tometer. The impact of OCRB on ambient carbonaceous aerosol correlations was de-termined using ∆ECa/∆CO and ∆OC/∆CO ratios. As expected, strong positive
cor-relations between ambient ECaand OC masses and CO mixing ratios were observed
5
during OCRB-dominant episodes. The average∆ECa/∆CO and∆OC/∆CO ratios were 14.3±1.0 ng m−3ppbv−1and 41.9±2.6 ng m−3ppbv−1, respectively. Based on forward
simulations using the FLEXPART WRF tracer model, we estimated the transport time of smoke particles by releasing specific numbers of inert particles from areas where OCRB occurred according to geographical hotspot distributions observed by a MODIS
10
satellite sensor. The dependences of∆ECa/∆CO and ∆OC/∆CO ratios on transport time were also presented. An e-folding equation fitting demonstrated that ECa (normal-ized to CO) had a mean lifetime of∼4.3 days. The lifetime of OC estimated in the same
way was shorter, 1.1 days, suggesting a faster net loss process of OC including cloud scavenging. The lifetime of black carbon estimated by means of different carbonaceous
15
aerosol correlation (∆ECa/∆CO2,∆BCe/∆CO and∆BCe/∆CO2) was similar (4.2–4.8 days). Our study suggested that it was necessary to use the regional-specific aging parameters of carbonaceous aerosols when studying the transport of biomass burning plumes.
Acknowledgements. The authors would like to thank Hiroshi Tanimoto (National Institute of
20
Environmental Studies) and Yele Sun (State Key Laboratory of Atmospheric Boundary Layer Physics and Atmospheric Chemistry, Institute of Atmospheric Physics) for valuable comments. We gratefully acknowledge the anonymous reviewers for their helpful comments and sugges-tions. This work was supported by the Global Environment Research Fund (S-7, C-081, B-051) from the Ministry of the Environment, Japan.
25
ACPD
12, 14363–14392, 2012Estimation of lifetime of carbonaceous
aerosol
X. L. Pan et al.
Title Page
Abstract Introduction
Conclusions References
Tables Figures
◭ ◮
◭ ◮
Back Close
Full Screen / Esc
Printer-friendly Version Interactive Discussion
Discussion
P
a
per
|
Dis
cussion
P
a
per
|
Discussion
P
a
per
|
Discussio
n
P
a
per
|
References
Andreae, M. O. and Gelencs ´er, A.: Black carbon or brown carbon? The nature of light-absorbing carbonaceous aerosols, Atmos. Chem. Phys., 6, 3131–3148, doi:10.5194/acp-6-3131-2006, 2006.
Andreae, M. O. and Merlet, P.: Emission of trace gases and aerosols from biomass burning,
5
Global Biogeochem Cy., 15, 955–966, 2001.
Arbex, M. A., Martins, L. C., de Oliveira, R. C., Pereira, L. A. A., Arbex, F. F., Canc¸ado, J. E. D., Saldiva, P. H. N., and Braga, A. L. F.: Air pollution from biomass burning and asthma hospital admissions in a sugar cane plantation area in Brazil, J. Epidemiol. Commun. H., 61, 395–400, doi:10.1136/jech.2005.044743, 2007.
10
Badarinath, K. V. S., Madhavi Latha, K., Kiran Chand, T. R., Gupta, P. K., Ghosh, A. B., Jain, S. L., Gera, B. S., Singh, R., Sarkar, A. K., Singh, N., Parmar, R. S., Koul, S., Kohli, R., Nath, S., Ojha, V. K., and Singh, G.: Characterization of aerosols from biomass burning – a case study from Mizoram (Northeast), India, Chemosphere, 54, 167–175, doi:10.1016/j.chemosphere.2003.08.032, 2004.
15
Badarinath, K. V. S., Kharol, S. K., Chand, T. R. K., Parvathi, Y. G., Anasuya, T., and Jyothsna, A. N.: Variations in black carbon aerosol, carbon monoxide and ozone over an urban area of Hyderabad, India, during the forest fire season, Atmos. Res., 85, 18–26, 2007.
Clarke, A., McNaughton, C., Kapustin, V., Shinozuka, Y., Howell, S., Dibb, J., Zhou, J., Ander-son, B., Brekhovskikh, V., and Turner, H.: Biomass burning and pollution aerosol over North
20
America: Organic components and their influence on spectral optical properties and humidi-fication response, J. Geophys. Res, 112, D12S18, doi:10.1029/2006JD007777, 2007. Cooke, W. F. and Wilson, J. J. N.: A global black carbon aerosol model, J. Geophys.
Res.-Atmos., 101, 19395–19409, 1996.
Croft, B., Lohmann, U., and von Salzen, K.: Black carbon ageing in the Canadian Centre for
25
Climate modelling and analysis atmospheric general circulation model, Atmos. Chem. Phys., 5, 1931–1949, doi:10.5194/acp-5-1931-2005, 2005.
Crounse, J. D., DeCarlo, P. F., Blake, D. R., Emmons, L. K., Campos, T. L., Apel, E. C., Clarke, A. D., Weinheimer, A. J., McCabe, D. C., Yokelson, R. J., Jimenez, J. L., and Wennberg, P. O.: Biomass burning and urban air pollution over the Central Mexican Plateau, Atmos. Chem.
30
ACPD
12, 14363–14392, 2012Estimation of lifetime of carbonaceous
aerosol
X. L. Pan et al.
Title Page
Abstract Introduction
Conclusions References
Tables Figures
◭ ◮
◭ ◮
Back Close
Full Screen / Esc
Printer-friendly Version Interactive Discussion
Discussion
P
a
per
|
Dis
cussion
P
a
per
|
Discussion
P
a
per
|
Discussio
n
P
a
per
|
DeCarlo, P. F., Ulbrich, I. M., Crounse, J., de Foy, B., Dunlea, E. J., Aiken, A. C., Knapp, D., Weinheimer, A. J., Campos, T., Wennberg, P. O., and Jimenez, J. L.: Investigation of the sources and processing of organic aerosol over the Central Mexican Plateau from aircraft measurements during MILAGRO, Atmos. Chem. Phys., 10, 5257–5280, doi:10.5194/acp-10-5257-2010, 2010.
5
Dunlea, E. J., DeCarlo, P. F., Aiken, A. C., Kimmel, J. R., Peltier, R. E., Weber, R. J., Tomlinson, J., Collins, D. R., Shinozuka, Y., McNaughton, C. S., Howell, S. G., Clarke, A. D., Emmons, L. K., Apel, E. C., Pfister, G. G., van Donkelaar, A., Martin, R. V., Millet, D. B., Heald, C. L., and Jimenez, J. L.: Evolution of Asian aerosols during transpacific transport in INTEX-B, Atmos. Chem. Phys., 9, 7257–7287, doi:10.5194/acp-9-7257-2009, 2009.
10
Fu, P., Kawamura, K., Okuzawa, K., Aggarwal, S. G., Wang, G., Kanaya, Y., and Wang, Z.: Organic molecular compositions and temporal variations of summertime mountain aerosols over Mt. Tai, North China Plain, J. Geophys. Res, 113, D19107, doi:10.1029/2008JD009900, 2008.
Inomata, S., Tanimoto, H., Kato, S., Suthawaree, J., Kanaya, Y., Pochanart, P., Liu, Y., and
15
Wang, Z.: PTR-MS measurements of non-methane volatile organic compounds during an intensive field campaign at the summit of Mount Tai, China, in June 2006, Atmos. Chem. Phys., 10, 7085–7099, doi:10.5194/acp-10-7085-2010, 2010.
Jourdain, L., Worden, H., Worden, J., Bowman K., Q. Li, A. Eldering, S. Kulawik, G. Osterman, K. Boersma, and B. Fisher, Tropospheric vertical distribution of tropical Atlantic ozone
ob-20
served by TES during the northern African biomass burning season, Geophys. Res. Lett., 34, L04810, doi:10.1029/2006GL028284, 2007.
Kanaya, Y., Komazaki, Y., Pochanart, P., Liu, Y., Akimoto, H., Gao, J., Wang, T., and Wang, Z.: Mass concentrations of black carbon measured by four instruments in the middle of Central East China in June 2006, Atmos. Chem. Phys., 8, 7637–7649, doi:10.5194/acp-8-7637-2008,
25
2008.
Kirchstetter, T. W., Novakov, T., Hobbs, P. V., and Magi, B.: Airborne measurements of carbona-ceous aerosols in southern Africa during the dry biomass burning season, J. Geophys. Res, 108, 1783–1784, 2003.
Kondo, Y., Morino, Y., Takegawa, N., Koike, M., Kita, K., Miyazaki, Y., Sachse, G., Vay,
30
S., Avery, M., and Flocke, F.: Impacts of biomass burning in Southeast Asia on ozone and reactive nitrogen over the western Pacific in spring, J. Geophys. Res, 109, D15S12, doi:10.1029/2003JD004203, 2004.
ACPD
12, 14363–14392, 2012Estimation of lifetime of carbonaceous
aerosol
X. L. Pan et al.
Title Page
Abstract Introduction
Conclusions References
Tables Figures
◭ ◮
◭ ◮
Back Close
Full Screen / Esc
Printer-friendly Version Interactive Discussion
Discussion
P
a
per
|
Dis
cussion
P
a
per
|
Discussion
P
a
per
|
Discussio
n
P
a
per
|
Kondo, Y., Matsui, H., Moteki, N., Sahu, L., Takegawa, N., Kajino, M., Zhao, Y., Cubison, M. J., Jimenez, J. L., Vay, S., Diskin, G. S., Anderson, B., Wisthaler, A., Mikoviny, T., Fuelberg, H. E., Blake, D. R., Huey, G., Weinheimer, A. J., Knapp, D. J., and Brune, W. H.: Emissions of black carbon, organic, and inorganic aerosols from biomass burning in North America and Asia in 2008, J. Geophys. Res.-Atmos., 116, D08204, doi:10.1029/2010jd015152, 2011.
5
Li, J., Wang, Z., Akimoto, H., Yamaji, K., Takigawa, M., Pochanart, P., Liu, Y., Tanimoto, H., and Kanaya, Y.: Near-ground ozone source attributions and outflow in central eastern China during MTX2006, Atmos. Chem. Phys., 8, 7335–7351, doi:10.5194/acp-8-7335-2008, 2008. Maria, S. F., Russell, L. M., Turpin, B. J., Porcja, R. J., Campos, T. L., Weber, R. J., and
Hue-bert, B. J.: Source signatures of carbon monoxide and organic functional groups in Asian
10
Pacific Regional Aerosol Characterization Experiment (ACE-Asia) submicron aerosol types, J. Geophys. Res.-Atmos., 108, 8637, doi:10.1029/2003jd003703, 2003.
Pan, X. L., Kanaya, Y., Wang, Z. F., Liu, Y., Pochanart, P., Akimoto, H., Sun, Y. L., Dong, H. B., Li, J., Irie, H., and Takigawa, M.: Correlation of black carbon aerosol and carbon monoxide in the high-altitude environment of Mt. Huang in Eastern China, Atmos. Chem. Phys., 11,
15
9735–9747, doi:10.5194/acp-11-9735-2011, 2011.
Park, R. J., Jacob, D. J., Palmer, P. I., Clarke, A. D., Weber, R. J., Zondlo, M. A., Eisele, F. L., Bandy, A. R., Thornton, D. C., and Sachse, G. W.: Export efficiency of black carbon aerosol in continental outflow: Global implications, J. Geophys. Res., 110, 1–7, 2005.
Ram, K. and Sarin, M.: Spatio-temporal variability in atmospheric abundances of EC, OC and
20
WSOC over Northern India, J. Aerosol Sci., 41, 88–98, 2010.
Rehman, I. H., Ahmed, T., Praveen, P. S., Kar, A., and Ramanathan, V.: Black carbon emis-sions from biomass and fossil fuels in rural India, Atmos. Chem. Phys., 11, 7289–7299, doi:10.5194/acp-11-7289-2011, 2011.
Reid, J. S., Hobbs, P. V., Liousse, C., Martins, J. V., Weiss, R. E., and Eck, T. F.: Comparisons of
25
techniques for measuring shortwave absorption and black carbon content of aerosols from biomass burning in Brazil, J. Geophys. Res.-Atmos., 103, 32031–32040, 1998.
Reid, J. S., Koppmann, R., Eck, T. F., and Eleuterio, D. P.: A review of biomass burning emis-sions part II: intensive physical properties of biomass burning particles, Atmos. Chem. Phys., 5, 799–825, doi:10.5194/acp-5-799-2005, 2005.
30
ACPD
12, 14363–14392, 2012Estimation of lifetime of carbonaceous
aerosol
X. L. Pan et al.
Title Page
Abstract Introduction
Conclusions References
Tables Figures
◭ ◮
◭ ◮
Back Close
Full Screen / Esc
Printer-friendly Version Interactive Discussion
Discussion
P
a
per
|
Dis
cussion
P
a
per
|
Discussion
P
a
per
|
Discussio
n
P
a
per
|
Shen, G., Yang, Y., Wang, W., Tao, S., Zhu, C., Min, Y., Xue, M., Ding, J., Wang, B., and Wang, R.: Emission factors of particulate matter and elemental carbon for crop residues and coals burned in typical household stoves in China, Environ. Sci. Technol., 44, 7157–7162, 2010. Stier, P., Feichter, J., Kinne, S., Kloster, S., Vignati, E., Wilson, J., Ganzeveld, L., Tegen, I.,
Werner, M., Balkanski, Y., Schulz, M., Boucher, O., Minikin, A., and Petzold, A.: The
aerosol-5
climate model ECHAM5-HAM, Atmos. Chem. Phys., 5, 1125–1156, doi:10.5194/acp-5-1125-2005, 2005.
Stohl, A., Hittenberger, M., and Wotawa, G.: Validation of the Lagrangian particle dispersion model FLEXPART against large-scale tracer experiment data, Atmos. Environ., 32, 4245– 4264, 1998.
10
Streets, D., Yarber, K., Woo, J., and Carmichael, G.: Biomass burning in Asia: Annual and seasonal estimates and atmospheric emissions, Global Biogeochem. Cy., 17, 1099, doi:10.1029/2003GB002040, 2003.
Suthawaree, J., Kato, S., Okuzawa, K., Kanaya, Y., Pochanart, P., Akimoto, H., Wang, Z., and Kajii, Y.: Measurements of volatile organic compounds in the middle of Central East China
15
during Mount Tai Experiment 2006 (MTX2006): observation of regional background and im-pact of biomass burning, Atmos. Chem. Phys., 10, 1269–1285, doi:10.5194/acp-10-1269-2010, 2010.
Tosca, M. G., Randerson, J. T., Zender, C. S., Flanner, M. G., and Rasch, P. J.: Do biomass burning aerosols intensify drought in equatorial Asia during El Ni ˜no?, Atmos. Chem. Phys.,
20
10, 3515–3528, doi:10.5194/acp-10-3515-2010, 2010.
Vignati, E., Karl, M., Krol, M., Wilson, J., Stier, P., and Cavalli, F.: Sources of uncertain-ties in modelling black carbon at the global scale, Atmos. Chem. Phys., 10, 2595–2611, doi:10.5194/acp-10-2595-2010, 2010.
Yamaji, K., Li, J., Uno, I., Kanaya, Y., Irie, H., Takigawa, M., Komazaki, Y., Pochanart, P., Liu,
25
Y., Tanimoto, H., Ohara, T., Yan, X., Wang, Z., and Akimoto, H.: Impact of open crop residual burning on air quality over Central Eastern China during the Mount Tai Experiment 2006 (MTX2006), Atmos. Chem. Phys., 10, 7353–7368, doi:10.5194/acp-10-7353-2010, 2010. Yokelson, R. J., Urbanski, S. P., Atlas, E. L., Toohey, D. W., Alvarado, E. C., Crounse, J. D.,
Wennberg, P. O., Fisher, M. E., Wold, C. E., Campos, T. L., Adachi, K., Buseck, P. R., and
30
Hao, W. M.: Emissions from forest fires near Mexico City, Atmos. Chem. Phys., 7, 5569–5584, doi:10.5194/acp-7-5569-2007, 2007.
ACPD
12, 14363–14392, 2012Estimation of lifetime of carbonaceous
aerosol
X. L. Pan et al.
Title Page
Abstract Introduction
Conclusions References
Tables Figures
◭ ◮
◭ ◮
Back Close
Full Screen / Esc
Printer-friendly Version Interactive Discussion
Discussion
P
a
per
|
Dis
cussion
P
a
per
|
Discussion
P
a
per
|
Discussio
n
P
a
per
|
Table 1.Description of the instrumentation at Mt Tai site.
Site & Period Species Instruments
BCe(PM1) Multiple Angle Absorption Photometer (MAAP)
Mt. Tai (2006 June) ECa, OC (PM1) Sunset ECOC analyzer with NIOSH temperature protocol
36.26◦N, 117.11◦E CO non-dispersive infrared CO analyzer (Thermo Model 48C)
1534 m a.s.l CO2 NDIR Li-840 CO2/H20 Gas analyzer
ACPD
12, 14363–14392, 2012Estimation of lifetime of carbonaceous
aerosol
X. L. Pan et al.
Title Page
Abstract Introduction
Conclusions References
Tables Figures
◭ ◮
◭ ◮
Back Close
Full Screen / Esc
Printer-friendly Version Interactive Discussion
Discussion
P
a
per
|
Dis
cussion
P
a
per
|
Discussion
P
a
per
|
Discussio
n
P
a
per
|
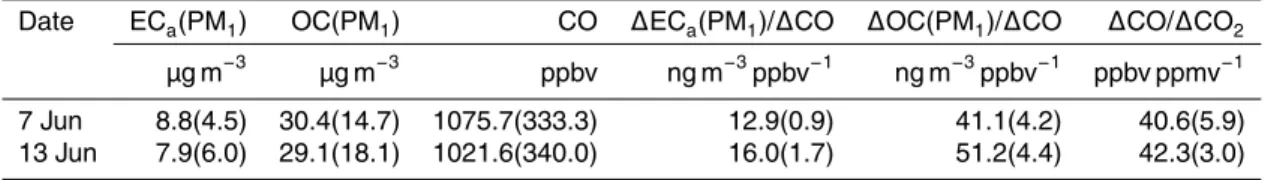
Table 2.Detailed information on the biomass burning plumes measured at Mt. Tai.
Date ECa(PM1) OC(PM1) CO ∆ECa(PM1)/∆CO ∆OC(PM1)/∆CO ∆CO/∆CO2 µg m−3
µg m−3
ppbv ng m−3 ppbv−1
ng m−3 ppbv−1
ppbv ppmv−1
7 Jun 8.8(4.5) 30.4(14.7) 1075.7(333.3) 12.9(0.9) 41.1(4.2) 40.6(5.9)
ACPD
12, 14363–14392, 2012Estimation of lifetime of carbonaceous
aerosol
X. L. Pan et al.
Title Page
Abstract Introduction
Conclusions References
Tables Figures
◭ ◮
◭ ◮
Back Close
Full Screen / Esc
Printer-friendly Version Interactive Discussion
Discussion
P
a
per
|
Dis
cussion
P
a
per
|
Discussion
P
a
per
|
Discussio
n
P
a
per
|
Table 3.Statistical results for the dependence of OCRB carbonaceous aerosol correlations on transport time.
group Transport time ∆ECa/∆CO ∆OC/∆CO ∆OC/∆ECa ∆CO/∆CO2
hours ng m−3
ppbv−1
ng m−3
ppbv−1
– ppbv ppmv−1
1 10±5.1 14.5±2.2 47.5±5.0 3.2±0.2 45±10.4
2 27.1±24.8 13.5±2.9 34±11.3 2.4±0.4 32.9±7.4
3 32.7±26.5 10.5±1.4 29.6±4.3 2.6±0.3 38.6±3.5
ACPD
12, 14363–14392, 2012Estimation of lifetime of carbonaceous
aerosol
X. L. Pan et al.
Title Page
Abstract Introduction
Conclusions References
Tables Figures
◭ ◮
◭ ◮
Back Close
Full Screen / Esc
Printer-friendly Version Interactive Discussion
Discussion
P
a
per
|
Dis
cussion
P
a
per
|
Discussion
P
a
per
|
Discussio
n
P
a
per
|
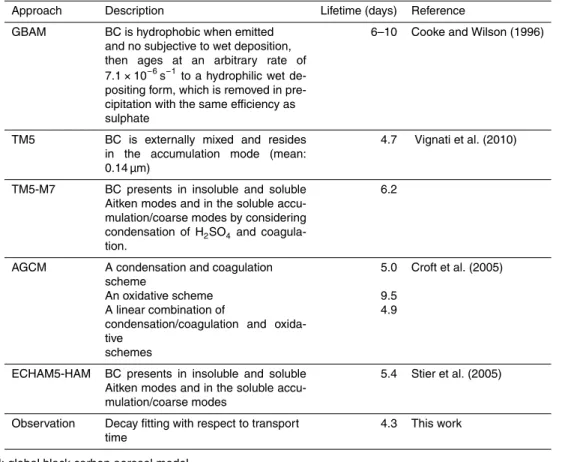
Table 4.Comparison of lifetime of black carbon aerosol from different studies.
Approach Description Lifetime (days) Reference
GBAM BC is hydrophobic when emitted and no subjective to wet deposition, then ages at an arbitrary rate of 7.1×10⁻⁶s−1to a hydrophilic wet
de-positing form, which is removed in pre-cipitation with the same efficiency as sulphate
6–10 Cooke and Wilson (1996)
TM5 BC is externally mixed and resides in the accumulation mode (mean: 0.14 µm)
4.7 Vignati et al. (2010)
TM5-M7 BC presents in insoluble and soluble Aitken modes and in the soluble accu-mulation/coarse modes by considering condensation of H2SO4and coagula-tion.
6.2
AGCM A condensation and coagulation scheme
5.0 Croft et al. (2005)
An oxidative scheme 9.5
A linear combination of
condensation/coagulation and oxida-tive
schemes
4.9
ECHAM5-HAM BC presents in insoluble and soluble Aitken modes and in the soluble accu-mulation/coarse modes
5.4 Stier et al. (2005)
Observation Decay fitting with respect to transport time
4.3 This work
GBAM: global black carbon aerosol model
TM5: off-line global transport chemistry model using ECMWF ERA-40 meteorological data
M7: a microphysical aerosol model that allows the resolution of particle masses and numbers in seven internally mixed classes.
AGCM: Atmospheric general circulation model
ACPD
12, 14363–14392, 2012Estimation of lifetime of carbonaceous
aerosol
X. L. Pan et al.
Title Page
Abstract Introduction
Conclusions References
Tables Figures
◭ ◮
◭ ◮
Back Close
Full Screen / Esc
Printer-friendly Version Interactive Discussion
Discussion
P
a
per
|
Dis
cussion
P
a
per
|
Discussion
P
a
per
|
Discussio
n
P
a
per
|
ation of the measurement site (Mt. Tai). The colore
–
–
–
40
35
30
25
La
ti
tu
d
e
130
125
120
115
Longitude
China
Japan
South Korea
Confidence of fire (%)
Beijing
Shanghai
Mt.Tai
100 95 90 85 80
Fig. 1. Geographical location of the measurement site (Mt. Tai). The colored dots represent hotspots on June 2006 detected by a MODIS satellite. The colored shading indicates the con-fidence in the open biomass burning signals.
ACPD
12, 14363–14392, 2012Estimation of lifetime of carbonaceous
aerosol
X. L. Pan et al.
Title Page
Abstract Introduction
Conclusions References
Tables Figures
◭ ◮
◭ ◮
Back Close
Full Screen / Esc
Printer-friendly Version Interactive Discussion
Discussion
P
a
per
|
Dis
cussion
P
a
per
|
Discussion
P
a
per
|
Discussio
n
P
a
per
|
–
– –
Fig. 2.Forward and backward simulations of convection movements of tracer particles using the FLEXPART WRF model. The upper two panels show the vertical distributions (in the 117◦E–
118◦E longitudinal band) of tracer concentrations during two OCRB episodes from forward
ACPD
12, 14363–14392, 2012Estimation of lifetime of carbonaceous
aerosol
X. L. Pan et al.
Title Page Abstract Introduction Conclusions References Tables Figures ◭ ◮ ◭ ◮ Back Close
Full Screen / Esc
Printer-friendly Version Interactive Discussion Discussion P a per | Dis cussion P a per | Discussion P a per | Discussio n P a per | 40 30 20 10 0 ECa ( µ g /m 3 ) 00:00 5 00:00 6 00:00 7 00:00 8 00:00 9 00:00 10 00:00 11 00:00 12 00:00 13 00:00 14 Day of Month (June 2006)
100 80 60 40 20 0 O C (µ g /m 3 ) 2.0x10³ 1.5 1.0 0.5 CO (p p b v ) 450 440 430 420 410 400 390 380 CO 2 (p p m v ) 35 30 25 20 15 10 5 0 BCe (µ g /m 3 ) OCRB OCRB EC OC CO CO2 BCe
Fig. 3.Time series of carbonaceous aerosols, CO, and CO2 concentrations measured at the summit of Mt. Tai.
ACPD
12, 14363–14392, 2012Estimation of lifetime of carbonaceous
aerosol
X. L. Pan et al.
Title Page
Abstract Introduction
Conclusions References
Tables Figures
◭ ◮
◭ ◮
Back Close
Full Screen / Esc
Printer-friendly Version Interactive Discussion
Discussion
P
a
per
|
Dis
cussion
P
a
per
|
Discussion
P
a
per
|
Discussio
n
P
a
per
|
40
30
20
10
0
BC
e
(
P
M
2
.5
,
µ
g
/m
3
)
40
30
20
10
0
BC
e( PM
1, µg/m
3)
1:1
Best Linear Regression:
all_OBB: Slope = 1.05±0.10
Intercept = 0.1 ± 1.4; R = 0.88
non_OBB:Y = 1.02±0.01
Intercetp = 0.2 ± 0.1; R = 0.96
ACPD
12, 14363–14392, 2012Estimation of lifetime of carbonaceous
aerosol
X. L. Pan et al.
Title Page
Abstract Introduction
Conclusions References
Tables Figures
◭ ◮
◭ ◮
Back Close
Full Screen / Esc
Printer-friendly Version Interactive Discussion
Discussion
P
a
per
|
Dis
cussion
P
a
per
|
Discussion
P
a
per
|
Discussio
n
P
a
per
|
best linear fitting of EC -CO and OC-CO correlations for
–
–
40x103
30
20
10
0
EC
a
m
ass
co
n
c.
(
n
g
C
/m
3 )
2.0x10³ 1.6
1.2 0.8
0.4
CO (ppbv)
80x103
60
40
20
0
O
C
m
ass
co
n
c.
(
n
g
C
/m
3
)
OCRB:
ECa/CO: 14.3±1.0, r = 0.94 OC/CO: 41.9±2.6 , r = 0.95 Urban:
ECa/CO: 4.8±0.2, r = 0.70
OC/CO: 12.1±1.2 , r = 0.53
Fig. 5. Scatter plot and best linear fitting of ECa-CO and OC-CO correlations for OCRB mea-sured at Mt. Tai.
ACPD
12, 14363–14392, 2012Estimation of lifetime of carbonaceous
aerosol
X. L. Pan et al.
Title Page Abstract Introduction Conclusions References Tables Figures ◭ ◮ ◭ ◮ Back Close
Full Screen / Esc
Printer-friendly Version Interactive Discussion Discussion P a per | Dis cussion P a per | Discussion P a per | Discussio n P a per | – – 10 8 6 4 2 0 O C /EC a 60 40 20 0
Transport time (hour) -4
-20
2 4
(9.8) A: 7.4; tau = 19.5
1.0 0.9 0.8 100 80 60 40 20 0 O C /C O ( n g /m 3 /p p b v ) 60 40 20 0
Transport time (hour) -40
-200
20 40
(97.7) A: 80.2; tau = 26.5
1.0 0.9 0.8 25 20 15 10 5 0 EC a/ C O ( n g /m 3 /p p b v ) 60 40 20 0
Transport time (hour)
-10-5
0 5 10
(15.5)
A: 15.9; tau = 104.7
1.0
0.9
0.8
(a) (b) (c)