www.atmos-meas-tech.net/9/6117/2016/ doi:10.5194/amt-9-6117-2016
© Author(s) 2016. CC Attribution 3.0 License.
Effect of secondary organic aerosol coating thickness on the
real-time detection and characterization of biomass-burning
soot by two particle mass spectrometers
Adam T. Ahern1, Ramachandran Subramanian1, Georges Saliba1, Eric M. Lipsky1,2, Neil M. Donahue1, and Ryan C. Sullivan1
1Center for Atmospheric Particle Studies, Carnegie Mellon University, Pittsburgh, PA, 15213, USA 2Penn State Greater Allegheny, 4000 University Drive, McKeesport, Pennsylvania 15132, USA Correspondence to:Ryan C. Sullivan ([email protected])
Received: 10 June 2016 – Published in Atmos. Meas. Tech. Discuss.: 15 July 2016
Revised: 31 October 2016 – Accepted: 18 November 2016 – Published: 22 December 2016
Abstract. Biomass burning is a large source of light-absorbing refractory black carbon (rBC) particles with a wide range of morphologies and sizes. The net radiative forcing from these particles is strongly dependent on the amount and composition of non-light-absorbing material internally mixed with the rBC and on the morphology of the mixed par-ticles. Understanding how the mixing state and morphology of biomass-burning aerosol evolves in the atmosphere is crit-ical for constraining the influence of these particles on radia-tive forcing and climate. We investigated the response of two commercial laser-based particle mass spectrometers, the vac-uum ultraviolet (VUV) ablation LAAPTOF and the IR vapor-ization SP-AMS, to monodisperse biomass-burning particles as we sequentially coated the particles with secondary or-ganic aerosol (SOA) fromα-pinene ozonolysis. We studied three mobility-selected soot core sizes, each with a number of successively thicker coatings of SOA applied. Using IR laser vaporization, the SP-AMS had different changes in sensitiv-ity to rBC compared to potassium as a function of applied SOA coatings. We show that this is due to different effective beam widths for the IR laser vaporization region of potas-sium versus black carbon. The SP-AMS’s sensitivity to black carbon (BC) mass was not observed to plateau following suc-cessive SOA coatings, despite achieving high OA : BC mass ratios greater than 9. We also measured the ion fragmenta-tion pattern of biomass-burning rBC and found it changed only slightly with increasing SOA mass. The average organic matter ion signal measured by the LAAPTOF demonstrated a positive correlation with the condensed SOA mass on
in-dividual particles, despite the inhomogeneity of the particle core compositions. This demonstrates that the LAAPTOF can obtain quantitative mass measurements of aged soot-particle composition from realistic biomass-burning soot-particles with complex morphologies and composition.
1 Introduction
Particles containing black carbon (BC) are largely anthro-pogenic and have the third largest warming effect on the planet, after CO2 and methane (Bond et al., 2013;
al., 2009; Moffet et al., 2008; Ramanathan and Carmichael, 2008).
The burning of non-fossil-fuel biomass, either as biofuel, agricultural refuse, or in wildfires, is the largest source of light-absorbing BC-containing particles globally. However, the effect of aging on the biomass-burning aerosol (BBA) is not well characterized (Bond et al., 2013). In some cases, co-emitted organic gases become oxidized and condense on the BBA, simultaneously reducing BBA atmospheric lifetime and increasing BBA light absorptivity (Lack et al., 2009; Mikhailov et al., 2006; Yokelson et al., 2009). In other smoke plumes, there has been no observed increase in organic mat-ter (OM) with aging, and in a few cases a decrease in OM has been reported, likely due to dilution-induced evaporation (Cubison et al., 2011; May et al., 2013). In order to identify the contribution of various chemical processes to the compo-sitional changes in BC-containing particles, measurements of particle composition must be carried out with a temporal res-olution similar to or faster than the timescale of the chemical processes. Improved mass measurements of BC and inter-nally mixed material will enable more accurate model simu-lations that constrain the climate forcing by black carbon and other aerosol components.
Particle mass spectrometers provide information about the chemical composition of atmospheric aerosols with a time resolution comparable to their transformation processes. In this paper we investigate the response of two commercial laser-based particle mass spectrometers to the systematic condensation of secondary organic aerosol (SOA) onto com-plex biomass-burning soot particles. One instrument is an infrared (IR) laser vaporization soot-particle aerosol mass spectrometer (SP-AMS, Aerodyne Research Inc.), while the other is a laser desorption–ionization single-particle mass spectrometer (LDI-SP-MS) known as the laser ablation aerosol particle time of flight mass spectrometer (LAAPTOF, AeroMegt GmbH). Both instruments provide compositional information regarding the core composition of BBA particles as well as secondary condensed components on a timescale of 10 min or less. However, each has quantitative challenges related to particle mixing state and morphology that are the subject of ongoing research (Corbin et al., 2014; Onasch et al., 2015; Spencer and Prather, 2006; Willis et al., 2014). Herein we evaluate the ability of the two instruments to mea-sure the composition of BBA composed of both a BC core and SOA coating, as we simulate atmospheric aging by coat-ing primary BBA particles with complex secondary organic material in a chamber reactor.
We confirm that significant SOA coatings on BC cause only small changes in the ion fragmentation patterns of el-emental carbon (EC) in the SP-AMS. EC is defined as ions detected by mass spectrometry that consist of only carbon atoms. We show that the infrared laser beam in the SP-AMS has a different effective beam width and therefore different detection efficiency for alkali metals versus BC. The feasi-bility of quantitative measurements of OM by the LAAPTOF
in complex and realistic particles containing inorganic salts, refractory black carbon (rBC), and SOA was also investi-gated. We demonstrate that there is a positive correlation be-tween the LAAPTOF-measured OM ion signal and the SOA mass condensed on BBA particles. This is significant given the especially complex composition of BBA and is highly encouraging for achieving mass quantitative single-particle measurements of other complex ambient particle matrices. In this work, we will use the term “SOA” to describe the condensed-phase organic material that was formed fromα -pinene ozonolysis. We will use “OM” to discuss all con-densed organic matter, including mass that is primary or sec-ondary in nature. Organic ions measured by mass spectrom-etry will be identified as OM because in this work we cannot strictly differentiate between primary and secondary organic material.
1.1 Characterization of carbonaceous aerosol by SP-AMS
The SP-AMS is a variant of the conventional aerosol mass spectrometer that includes an intracavity IR laser that can vaporize light-absorbing refractory material. A conventional AMS includes a 600◦C heater to vaporize aerosol particles in a vacuum before ionization (Decarlo et al., 2006; Jayne et al., 2000). Two species of interest are difficult and im-possible to detect, respectively, with a conventional AMS: potassium and rBC. Refractory is an operationally defined term describing any material not readily vaporized, such as by the 600◦C heater in a conventional AMS. Potassium and rBC are chemical species that are used as inert, nonvolatile tracers for biomass burning (Andreae, 1983; Hennigan et al., 2011; Lee et al., 2016). The sensitivity of the SP-AMS to rBC has been shown to increase with the addition of organic coat-ings to rBC-containing particles. Willis et al. (2014) showed that the increased sensitivity was due to increased overlap be-tween the particle beam and the IR beam that vaporizes the particles. The particles become more tightly focused by the aerodynamic lens inlet with increasing coating thickness and thus sphericity, causing a larger portion of the particle beam to intersect with the IR laser beam. The fraction of rBC-containing particles that are vaporized by the IR laser is de-fined by Onasch et al. (2012) as the shape-dependent collec-tion efficiency,EIR, and is the determining factor for the sen-sitivity of the SP-AMS to rBC. Willis et al. (2014) measured theEIRfor rBC using a beam-width probe with a rBC aerosol
calibration standard (Regal Black, Cabot) coated to varying degrees with dioctyl sebacate (DOS), a surrogate for primary or hydrocarbon-like OM. They observed that theEIRwas less
than unity for uncoated, collapsed rBC particles such as Re-gal Black but, for urban ambient particles and DOS-coated Regal Black, EIR was close to unity. However, real-world
exter-nally mixed with rBC (Huffman et al., 2005; Li et al., 2003; Onasch et al., 2012). We will show that as BBA is coated with OM, the SP-AMS ion signal response to the mass of potas-sium and rBC increases. Furthermore, we will show that the SP-AMS response to potassium increases more rapidly than that for rBC for equivalent amounts of OM coating, despite the species being internally mixed. We believe that this is in part due to the ability of components with low ionization energy to be ionized directly upon vaporization (Carbone et al., 2015; Drewnick et al., 2006). However, most chemical components in the SP-AMS undergo sequential vaporization followed by 70 eV electron ionization of the neutral vapors. This allows for extensive but reproducible molecular frag-mentation and subsequent classification and detection of the resulting ions in the high-resolution time-of-flight mass spec-trometer. The IR laser vaporization enables the subsequent ionization and thus detection of refractory material in par-ticles containing rBC that strongly absorbs the IR laser en-ergy. The vapors produced by the IR laser are ionized by the same electron source used when vaporization is performed only with the 600◦C heater. The reproducibility of the ion fragmentation by electron ionization has led researchers to investigate the possibility of using the ratios of the various detected EC fragments (C+x)to perform source apportion-ment of rBC. Corbin et al. (2014) showed that fullerene-rich particles produced a higher ratio of C+4 to C+3 than particles from higher temperature combustion did, which did not con-tain substantial fullerenes. Onasch et al. (2015) confirmed that fragmentation of larger graphitic molecules was a mi-nor source of C+4 cations in addition to the direct ionization of vaporized rBC. This suggests that the EC fragmentation pattern could be used to differentiate between rBC generated from different types of combustion (e.g., diesel vs. biomass combustion). Here we investigate the effect of atmospheric aging in the form of OM coatings on these EC ion ratios. 1.2 Characterization of carbonaceous aerosol by
LDI-SP-MS
The LAAPTOF is an LDI-SP-MS using a VUV excimer laser pulse to ablate and ionize individual particles simultaneously. This enables the analysis of a wider range of particle com-positions and types than is possible with the AMS, even when the IR laser is used. High-time-resolution measure-ments of individual particles are achieved; an aerodynamic size and bipolar mass spectrum can be obtained for each par-ticle. LDI-SP-MS also provides much greater mass sensitiv-ity compared to the less efficient electron ionization scheme because the laser ionization produces many more ions than electron ionization per mole of analyte (Farmer and Jimenez, 2010; Murphy, 2007; Pratt and Prather, 2012; Sullivan and Prather, 2005). However, the large number of ions produced per particle can result in poor MS resolution and/or ion plume chemistry after desorption–ionization. The molecular frag-mentation is also less reproducible compared to 70 eV
elec-tron ionization due to laser shot-to-shot variability, inhomo-geneity of the laser pulse, and varying optical properties of individual particles. Generation of ions directly from each particle introduces important matrix effects where the par-ticle’s composition and properties strongly dictate its inter-action with the VUV laser pulse, the distribution of laser en-ergy to the particle’s constituents, and the resulting ion signal and fragmentation (Gross et al., 2000; Mansoori et al., 1996; Reinard and Johnston, 2008; Steele et al., 2005; Thomson et al., 1997; Wenzel and Prather, 2004).
Despite these challenges, LDI-SP-MS can obtain quantita-tive measurements of individual particle composition and its evolution. Effective demonstrations of data analysis strate-gies for achieving quantitative LDI-SP-MS measurements in-clude restricting the analysis to particles of a similar parti-cle type based on their mass spectrum, normalization of ion peak areas to total ion signal, the use of ion peak area ra-tios, sensitivity calibration by comparison to co-located spe-ciated mass measurements, and signal averaging over numer-ous individual measurements (Bhave et al., 2002; Fergenson et al., 2001; Gross et al., 2000; Healy et al., 2013; Jeong et al., 2011; Pratt and Prather, 2012; Spencer and Prather, 2006; Sullivan et al., 2009; Sullivan and Prather, 2005). Although the ion plume chemistry can complicate analysis, the species known to cause ion plume effects (e.g., water, inorganic salts) are generally present in the mass spectra and can thereby in-form the analysis (Murphy, 2007; Murray and Russell, 1994; Neubauer et al., 1998). In this study, we account for laser shot-to-shot inconsistencies by averaging over particles of similar size and composition.
Figure 1. Experimental setup including size-selected biomass-burning aerosol generation, environmental aging chamber for se-quential coating withα-pinene SOA, and subsequent online charac-terization with particle instrumentation.
2 Experimental methods
2.1 Experimental particle generation and conditioning In Fig. 1 we display the experimental setup for the generation, coating, and characterization of monodisperse BBA particles. For these experiments, we burned Euro-pean white birch bark in a cookstove and sampled the smoke from the flaming phase 1 m above the fire through 1/2 in. o.d. stainless-steel tubing. We removed the gas-phase organics from the smoke by pulling polydisperse smoke through a 20◦C annular activated-carbon denuder with a di-aphragm pump. The same pump then pushed the denuded aerosol sample through a series of85Kr neutralizers and a
dif-ferential mobility analyzer (DMA; TSI, model 3081) with a sample flow of 4.0 L min−1and a non-circulating sheath flow
of 18 L min−1 to select a narrow range of mobility particle
diameters. We then injected the monodisperse soot particles into a 2 m3Teflon chamber at a rate of 4.0 L min−1until the concentration was between 2000 and 14 000 particles cm−3. This typically took less than 30 min. During this time, we continuously fueled the fire to maintain flaming conditions. Before soot injection, we partially filled the chamber with clean filtered dry air. Although the diaphragm pump gener-ated some small particles (with mobility diameters less than 50 nm), they were smaller than the selected soot particles (143 to 220 nm mobility diameter) and thus not transmitted through the DMA into the chamber.
We characterized the nascent soot particles with a suite of particle instruments described below and confirmed that the particles were nearly monodisperse; doubly charged parti-cles were always less than 10 % by number. We then injected precursor gases for SOA formation. We generated ozone by flowing oxygen through a corona-discharge ozone generator (Azco, HTU500AC) until the chamber concentration reached ∼300 ppb. We measured the ozone concentration with a UV photometric ozone monitor (Dasibi, 1008-PC). We injected 0.1 or 0.2 µL aliquots ofα-pinene (Sigma Aldrich, > 99 %) through an airtight heated septum flushed with clean air. We
used serial injections ofα-pinene to generate successively thicker SOA coatings on the soot cores. Chamber experi-ments with several steps of SOA production typically lasted 3–4 h, stopping after homogenous nucleation prevented ad-ditional coating of soot seeds.
2.2 Particle component mass measurements
We characterized the soot and the SOA coatings using a number of different methods. We used three instruments to measure the rBC: a Droplet Measurement Technologies single-particle soot photometer (SP2) (Schwarz et al., 2010; Stephens et al., 2003), the LAAPTOF mass spectrometer, and an Aerodyne SP-AMS (Onasch et al., 2012). Extensive de-scriptions of the SP2 and SP-AMS instruments are available elsewhere and thus we provide only a brief overview. For the LAAPTOF we describe the salient features below; a more detailed discussion of the LDI-SP-MS technique is available in the form of a review article by Murphy (2007) and litera-ture descriptions of other closely related instruments (Mars-den et al., 2016; Pratt et al., 2009; Sullivan and Prather, 2005; Thomson et al., 2000; Zelenyuk et al., 2009).
The LAAPTOF is a commercially available single-particle mass spectrometer (AeroMegt GmbH) that uses laser desorption–ionization to generate positive and negative ions from individual particles that are subsequently detected by a bipolar time-of-flight mass spectrometer (TOFWerk, AG) (Gemayel et al., 2016; Marsden et al., 2016). The particles are focused into the ionization region by an aerodynamic lens. Normally the particle time of flight is measured by light scattering between two 405 nm continuous-wave lasers (OBIS, Coherent Inc.) to determine the velocity of each ticle and thus its vacuum aerodynamic diameter. The par-ticle is then ablated and ionized with an 8 ns pulse from a VUV 193 nm excimer laser (EX5, GAM Laser, Inc.) that is triggered immediately by the second particle light scattering event. The VUV pulse travels coaxially up the particle beam and hits the particle in the ion extraction region, coincident with and orthogonal to the second light scattering laser beam. During these experiments, the 405 nm scattering lasers were not operational, and instead we free-fired the excimer laser at 10 Hz with an average laser pulse energy of 2.0 mJ and an average laser fluence of∼1.1×10⁵J m−2. We set and peri-odically confirmed the VUV laser power using a laser power meter (EnergyMax, Coherent, Inc.).
dur-ing these calibrations usdur-ing a condensation particle counter (TSI model 3772). Further details are provided by Saliba et al. (2016), where the optical properties of the coated rBC particles produced in these experiments are presented.
Both the SP-AMS and the LAAPTOF use the same aero-dynamic lens inlet design (Huffman et al., 2005; Liu et al., 2007). The aerodynamic lens these instruments use ef-ficiently transmit particles with vacuum aerodynamic diam-eters (dva)between 150 and 700 nm. Particles smaller than
150 nm tend to be removed with the excess gas, while parti-cles greater than 700 nm may be impacted on the lens’ critical orifices. For the measurements presented here, some particles start smaller than 150 nm dva and then grow into the ideal lens transmission regime. This is very important for mass-based measurements like the SP-AMS, but less so for indi-vidual particle analysis for the LAAPTOF. We will discuss how this affects our results in Sect. 3.3.
The aerodynamic lens focuses particles into a collimated beam for transmission into the SP-AMS detection region. The SP-AMS uses the same IR laser as the SP2 to vapor-ize rBC along with any internally mixed components; the vapors are then ionized by 70 eV electrons from a tungsten filament and the ions analyzed by time-of-flight mass spec-trometry (Canagaratna et al., 2015b; Onasch et al., 2012). The SP-AMS also contains a tungsten heater kept at 600◦C for particle thermal desorption, identical to the conventional AMS design. Unless stated otherwise, we operated the SP-AMS with both the IR laser and the conventional heater on for all experiments described here. The largest uncertainty in mass measurements of rBC by the SP-AMS is the parti-cle collection efficiency, which is determined by the partiparti-cle shape and size. The fraction of particles that pass through the laser beam and are vaporized (EIR)has been shown to be
the largest uncertainty for SP-AMS mass measurements us-ing the IR laser. It is caused by the incomplete overlap of the particle beam and the IR laser beam (Huffman et al., 2005; Onasch et al., 2012; Willis et al., 2014). A perfectly colli-mated particle beam would result in all of the rBC-containing particles passing through the center of the Gaussian IR laser beam energy profile, where it is most intense. However, the particle beam can spread because small and/or irregularly shaped particles diverge from an ideal beam profile. This di-vergence is due to Brownian diffusion or uneven drag dis-tribution on the particles as they leave the aerodynamic lens (Huffman et al., 2005; Liu et al., 1995). The collection effi-ciency for nonrefractory material not mixed with IR laser ab-sorbing rBC (components that promptly evaporate at 600◦C) is determined by the particle bounce off of the heater. Note that the cross-sectional area of the heater is much larger than that of the IR laser beam. Therefore, particle detection of re-fractory components such as rBC in the SP-AMS by IR va-porization is more sensitive to particle shape than is the de-tection of nonrefractory components vaporized by the 600◦C heater.
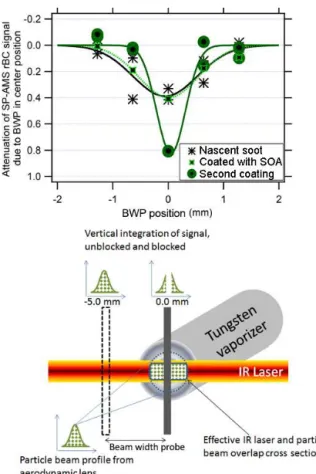
We determined the fraction of total particle mass unde-tected by the SP-AMS due to diverging, light-absorbing par-ticles missing the IR laser beam. We did this by measuring the ion signal from refractory species (elemental carbon or potassium) while sequentially blocking portions of the parti-cle beam with a thin piece of wire (∅=0.41 mm), called the width probe. We compared the signal with the beam-width probe in place to the signal observed when the wire was not obstructing any of the particle beam (Huffman et al., 2005; Willis et al., 2014). We show this schematically in Fig. 2 for the carbon cation signal, C+x (where x is a pos-itive integer). The ratio of the partially blocked signal to the unblocked signal, hereafter referred to as the attenuation with the beam-width probe, indicates how narrow the particle beam is. If the measured attenuation is high, then in the ab-sence of the beam-width probe most of the particles will pass through the most intense IR laser region and be vaporized. If the attenuation is low, then some of the particles will miss the laser and the refractory material will not be detected. The IR laser intensity was measured by Willis et al. (2014) to have a Gaussian distribution with aσ≈0.18 mm, although this may vary with IR laser power. As the beam-width probe is wider than the effective width of the IR laser for rBC, anything less than complete attenuation of the measured ion signal when the beam-width probe is at the center position indicates that some of the EC mass on particles containing rBC will not be detected. Therefore,EIRwill be < 1 (Willis et al., 2014). However, as we will show, vaporization of potassium occurs with a larger effective IR beam width, and thusEIRis larger for potassium than rBC.
2.3 Particle mobility measurements and calculations
During these experiments, there was evidence of subsam-pling in the aerosol samsubsam-pling lines, resulting in different par-ticle concentrations reaching some instruments. As a result, we do not compare the absolute concentration of aerosol species measured by the various instruments. Instead, we perform our analysis based on particle size measurements that are unaffected by the flow-splitting issues due to the monodisperse aerosol used here.
We classified the size distribution of the BBA with a scan-ning mobility particle sizer (SMPS; TSI Inc., model 3081 DMA and 3772 CPC) that measures particle mobility di-ameter (dmob)size distributions and with the SP-AMS that measures particle vacuum aerodynamic diameter (dva)in
ad-dition to composition. The SP-AMS measures the vacuum aerodynamic diameter by accelerating particles into a vac-uum and measuring the time to ion detection after a parti-cle passes through a rotating 2 % slit chopper. We calibrated the particle time of flight measurements using polystyrene la-tex spheres vaporized using the conventional tungsten heater in the SP-AMS (Jayne et al., 2000). It is important to note that for the fractal-like nascent soot particles, the termsdmob
Figure 2.The particle-beam width probe blocks a fraction of the particles that would have been vaporized by the IR laser and thus the probe attenuates the elemental carbon ion signal (C+x)for rBC-containing particles. We used six probe positions to establish the particle-beam width. The measured ion signal is the integrated Gaussian profile shown at the top of the schematic. The difference between the unblocked (x= −5.0 mm) and blocked (0.0 mm) green integrated Gaussian profile plots is the attenuation for that beam width probe blocking position, plotted as theyaxis on the top fig-ure. The top panel shows the attenuation of nascent uncoated soot (black asterisks), soot with a single coating of SOA (black and light green crosses), and soot with a second coating of SOA (black and dark green circles). A wider Gaussian particle-beam shape deter-mined by the beam-width probe analysis indicates the aerosol has a small diameter and thereforeEIR< 1.
Rather, they describe the relationship between the drag force on that particle compared to either a counterbalancing elec-trostatic force fordmobor the acceleration modulated by the
particle mass fordva(DeCarlo et al., 2004).
In Fig. 3 we show aerodynamic size distributions for parti-cles originally selected with a DMA at 143 nmdmob. Though
the nascent particles were monodisperse in mobility space, the dva distribution for the nascent soot particles was much
wider than the dmob distribution. This is probably due to
the range of particle masses and shapes that can exist at a given dmob for highly irregular nascent soot (Zelenyuk et
al., 2008). Thedva size range narrowed following the
addi-Figure 3.Normalized particle size distributions for coating experi-ments from two instruexperi-ments. Traces are mass distributions vs. vac-uum aerodynamic diameter (dva)for two refractory species mea-sured by the SP-AMS, potassium (purple circles), and rBC (black squares). The filled-in gray curve is the volume distribution (d3)
versus mobility diameter (dmob)measured by the SMPS.
Measure-ments of the original uncoated nascent biomass-burning soot parti-cles are shown in the top panel, while the middle and bottom panel show measurements after we applied the first and second SOA coat-ings, respectively. The uncoated particles had broad mass distribu-tions with modes well below the mobility volume mode, indicating fractal particles with a wide variability in particle shape. The mass distribution narrowed and overtook the volume distribution follow-ing condensation of SOA because the particles became more spher-ical and homogeneous with respect to shape and composition, with a density greater than 1.0 g cm−3.
tion of SOA coatings, likely reflecting the increasing unifor-mity as the irregularly shaped particles became coated with SOA. When measuring the mobility size distribution, we ad-justed the sheath flow of the SMPS to ensure that we cap-tured the complete aerosol size distribution, at times operat-ing at sheath-to-sample flow ratios as low as 5:1. Although the lower sheath-to-sample flow ratio reduces the SMPS size resolution, it does not affect the accuracy of the mode size determination.
As a nascent soot particle becomes coated with SOA, the particle grows and gains organic mass. Thusdmob,dva, and
the organic mass per particle all increase. We calculated the SOA mass per particle (mSOA)from mobility and mass
measurements following the method described in Slowik et al. (2004), with some differences as described here. In addi-tion todmobanddva, we measured the single-particle black
carbon mass (mrBC)with the SP2. The SP2 also confirmed
thickly coated particles, withmSOA≫mrBC, we assumed that
the particles were effectively spherical and determined the density of the SOA (ρSOA)to be 1.3 g cm−3by taking the
ra-tio ofdmobanddva. Knowing the two densities, we then
iter-atively solved for the particle dynamic shape factor (χ ), vol-ume equivalent diameter (dve), and the average mass of SOA
per particle (mSOA)using Eqs. (1), (2), and (3) below, taking
into account the Cunningham slip correction factor (Cc).
dmob=
dveCc(dmob) χ
Cc(dve)
(1)
dva=
dve
χ (ρ0)
mrBC+mSOA mrBC
ρrBC + mSOA ρSOA
!
(2)
mrBC
ρrBC
+mSOA
ρSOA = π
6 ·d
3
ve (3)
We neglected the contribution of ammonium, sulfate, and ni-trate to particle mass and volume as they are small (< 10 %) relative to rBC and SOA. Unless specified otherwise, SOA mass per particle is calculated in this manner. The combus-tion of solid biomass fuel generates particles with shapes and compositions that vary more widely than those pro-duced from controlled, well-mixed internal-combustion en-gines (Reid et al., 2005; Schwarz et al., 2008). Relative to engine exhaust soot, biomass-burning particles are typically larger and contain more non-carbonaceous components, such as inorganic salts (Bond et al., 2006; Li et al., 2003; Reid and Hobbs, 1998). Electron microscopy studies of aerosol particles have shown that biomass burning can result in a wide range of particle compositions and morphologies (Li et al., 2003; Pósfai and Buseck, 2010). For this work, based on our measurements it appears that most of the particles initially consisted of mostly rBC, with trace primary or-ganic material and inoror-ganic material, including potassium salts. The particles maintained their initial core composi-tion mass as SOA was condensed onto them. This made the particles increasingly homogeneous in terms of composition and shape. Single-particle measurements by the SP2 showed that > 97 % of the particles detected by light scattering con-tained > 0.7 fg of rBC. In cases where the uncoated, non-BC-containing particles were too small to be detected by the SP2 via light scattering, the fraction of rBC-containing parti-cles was monitored after the partiparti-cles were grown with SOA to detectable sizes. The fraction of rBC-containing particles did not change, except in cases where there was substan-tial and obvious new particle formation. We suspect that the largest variability in particles was with regard to the amount of potassium in a particle and with respect to particle shape. We do not have an estimate of variability in individual par-ticle potassium content. Variability in parpar-ticle shape is ob-served by the broad distribution in vacuum aerodynamic di-ameters. As the particles became coated, and therefore more uniform in shape and composition, the vacuum aerodynamic diameter distribution narrowed. The coating of fractal-like soot with organics has also been shown to cause structural
collapse of the particle, potentially affecting its light absorp-tion cross secabsorp-tion (Cross et al., 2010; Ghazi and Olfert, 2013; Zhang et al., 2008).
3 Results and discussion
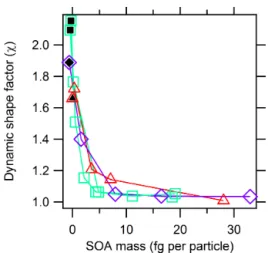
3.1 Effect of SOA condensation on soot-particle shape Figure 4 shows the calculated dynamic shape factor,χ, for particles as they were coated with SOA. Nascent soot par-ticles are very fractal-like, withχ > 1.6. This is within the range of previously observed soot from fuel-rich combus-tion (Slowik et al., 2004). For context, Schwarz et al. (2008) measured the thickness of coatings on ambient BBA using an SP2. The instrument was onboard an aircraft that transected a biomass-burning plume. They determined aged ambient par-ticles with a rBC core mass equivalent diameter of 200 nm (BC mass of 8.4 fg) had a coating thickness of 79 nm∼1 h after emission from the biomass-burning source. For compar-ison, we assume the BBA particles discussed in Schwarz et al. (2008) are coated with SOA with a density of 1.3 g cm−3. The SOA coating mass would then be 25.7 fg of OM mass per particle and would result in a mostly spherical particle. Although we cannot say the particle coating observed by Schwarz et al. (2008) consisted entirely of OM mass, the vol-ume equivalent of any secondary component such as sulfate would also result in a spherical particle shape, with a SOA to rBC mass ratio greater than > 3.2 (Ghazi and Olfert, 2013). As shown before, because the particle shape and size influ-ences the particle-beam profile and the beam width at the IR laser, the shape factor influences the total rBC signal detected by the SP-AMS.
3.2 Sequential coating of monodisperse soot in a smog chamber
In Fig. 5 we display a time series from a particle coating experiment for initially monodisperse particles withdmob=
143 nm. All of the experiments followed this general pat-tern. We show the particle mobility size distribution from the SMPS, the rBC mass from the SP2, and the SP-AMS sig-nal for both rBC and organic material (OM). Prior to coating (t< 0), the SP2 and SP-AMS rBC signals decreased as par-ticles were lost to the chamber walls. After eachα-pinene vapor injection, which drove SOA coating, the particle mo-bility diameter increased and there was also an increase in the SP-AMS OM signal. After the second injection (t=0.6 h), the SP-AMS rBC signal increased while the SP2-measured rBC mass concentration continued to decay, as expected due to particle wall loss. This difference demonstrates that the increase in SP-AMS rBC signal with thicker SOA coatings was almost certainly due to an increase in the IR laser beam particle collection efficiency (EIR)of the SP-AMS and not an
Figure 4.Dynamic shape factor (χ )of soot particles became more spherical (χ→1) with increasing SOA mass. Nascent particles (black) were coated sequentially, and after 5 fg of SOA per par-ticle had condensed the parpar-ticles were mostly spherical in shape. Additional coatings served to increase the diameter of the now ef-fectively spherical particles. Differently colored and shaped sym-bols indicate different initial selected soot core mobility diameters: red triangles were initially 142 nm, teal squares were 188 nm, and purple diamonds were 220 nm.
3.3 Particle composition from mass spectrometry
In Fig. 6 we show speciated high-resolution mass spectra from the SP-AMS for nascent and thickly coated biomass-burning particles, detected with the IR laser on. The coating was SOA formed fromα-pinene ozonolysis. High-resolution peak fitting was done using PIKA version 1.15 (Decarlo et al., 2006). Highly resolved ions were classified into a species and are displayed at unit mass resolution according to the fragmentation table therein. With respect to this dataset, the fragmentation table was only used to adjust the apportioning of CO+2 and C+1 ions. To account for CO+2 in the gas phase vs. particle phase, the fragmentation table was adjusted using HEPA filter gas-only measurements. To account for C+1 that may result from the fragmentation of nonrefractory OM com-ponents, the fragmentation table specifies that the amount of C+1 attributed to rBC is limited to 0.625·C+3, the ratio ob-served for the rBC calibrant, Regal Black (Onasch et al., 2012). Recent studies have begun to investigate the degree to which nonrefractory OM contributes to larger EC ion frag-ments (C+
x, wherex> 1) using IR laser vaporization. This has important implications for quantitative measurements of rBC using the SP-AMS and also for source apportionment based on the ion fragmentation pattern of rBC (Corbin et al., 2014). We measured refractory and nonrefractory material from nascent soot using the SP-AMS with the IR laser on. High-resolution analysis of nonrefractory organic material showed significant contribution from aliphatic ions, C4H+7 (m/z+
55), C4H+9 (m/z+57), C5H9+(m/z+69), and C6H+9 (m/z+
81). This is consistent with other AMS measurements of
fresh, flaming-phase biomass-burning emissions (Corbin et al., 2015; Cubison et al., 2011; Hennigan et al., 2011). We also observed the highly oxygenated ions C2H3O+2 (m/z+
60) and C3H5O+2 (m/z+73), which are common tracer ions
for biomass burning. However, C2H3O+2 was less than 0.5 %
of the total organic signal for nascent soot, much less than what has previously been reported in BBA measurements (Aiken et al., 2010; Corbin et al., 2015; Cubison et al., 2011; Hennigan et al., 2010, 2011; Lee et al., 2010). This is likely due to low cellulose content in the bark that we burned, re-sulting in less formation of the anhydrosugars including lev-oglucosan compared to burning wood (Branca et al., 2007). The average oxidation state of carbon (OSc=2O : C – H : C)
for the organic fragments (including HO+, H2O+, and CO+2)
was−0.56±0.25. This low oxidation state is consistent with primary organic aerosol (Canagaratna et al., 2015a; Kroll et al., 2011). We also observed refractory material, including elemental carbon series (C+1–C+9)and some metals includ-ing potassium, rubidium, and zinc. The alkali metals have very low ionization energies, and thus may become ionized by heating in the IR laser. This ionization mechanism is in-dependent of the 70 eV electrons that usually ionize neutral vapors in the SP-AMS. A broad abnormal ion peak shape of the metals indicates that they underwent single-step ther-mal ionization in the IR beam, rather than conventional two-step thermal vaporization with subsequent electron ioniza-tion (Allan et al., 2004; Carbone et al., 2015; Corbin et al., 2015; Drewnick et al., 2006). Condensation of SOA fromα -pinene ozonolysis increased the signal from most organic fragments. Especially notable was the signal increase for singly oxygenated organic fragments C2H3O+ (m/z+43),
C3H3O+ (m/z+55), C4H7O+ (m/z+71), and C5H7O+
(m/z+83). Reduced fragments such as C5H+9 (m/z+69)
also increased with SOA coating. After a thick coating (with an SOA : BC mass ratio of approximately 9) the average ox-idation state of carbon was 1.15±0.04. This is consistent with the α-pinene ozonolysis SOA formed in smog cham-bers (Chhabra et al., 2010; Shilling et al., 2008); however, the SOA mass spectra we obtain show relatively less frag-mentation than similarα-pinene SOA mass spectra obtained with a conventional AMS using the 600◦C heater. This sug-gests that a significant fraction of the particles were vapor-ized by the IR laser (> 97 % of the BBA contained sufficient black carbon that could be measured by the SP2) and that this produced marginally less fragmentation; the much lowerf44
(fraction of total ion signal atm/z+44) is also consistent with this hypothesis. Canagaratna et al. (2015b) used near-threshold VUV ionization with a SP-AMS to confirm that ionization via the IR laser resulted in significantly less frag-mentation for pure components, relative to when vaporized by the 600◦C heater.
Figure 5.Monodisperse biomass soot particles to which two successive additions of SOA were applied. Fractal-like, monodisperse soot particles with initial mobility diameter of 143 nm grew via condensation of successive SOA coatings following discrete injections ofα-pinene vapor (indicated by vertical lines) into a chamber containing ozone. Particle growth is evident in the volume-weighted SMPS mobility size distribution (blue-black, top) and the SP-AMS measured OM (green closed circles) and EC (black open squares) ion signal as a function of time. SP2 rBC mass measurements (red dotted line) reveal the steady decay of soot-particle mass concentration due to chamber wall loss, followed by greater loss when we purged the chamber att> 1.5 h.
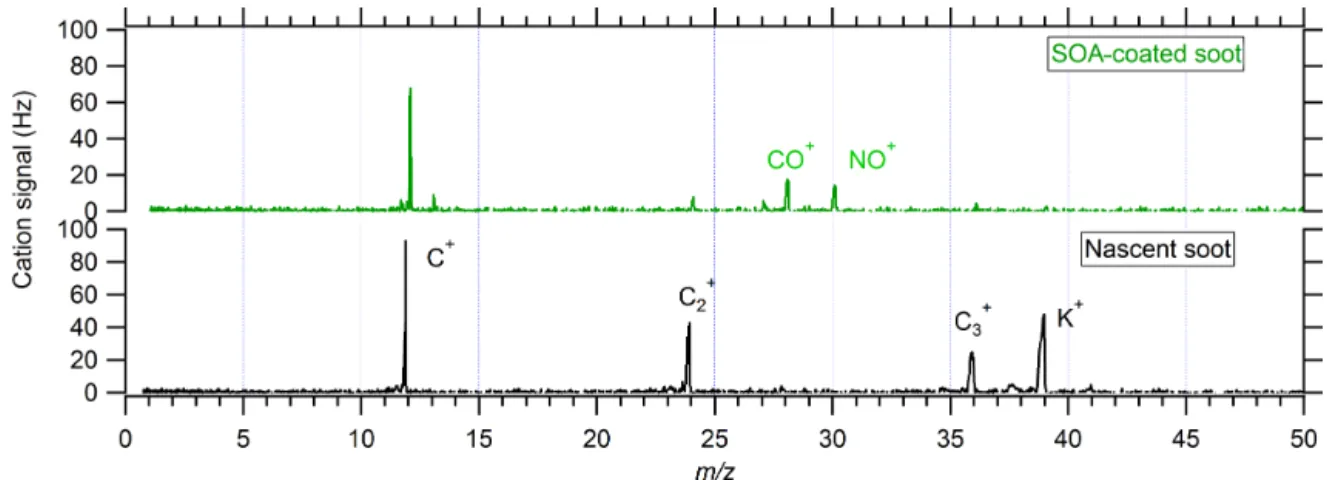
Figure 6.Stick integrated high-resolution mass spectra from the SP-AMS for nascent (top) and thickly SOA-coated soot (bottom). Mass spectra were collected with the IR laser on and have been normalized by total rBC mass as measured by the SP2 to account for particle wall loss. Peak bar colors correspond to the assigned chemical components for each unitm/zion peak, based on analysis of the high-resolution mass spectra. The nascent soot spectrum is rich in refractory black carbon, inorganic ions, and organic fragments. The spectrum from the SOA-coated soot, however, is dominated by the OM from the secondary organic aerosol. However, increased sensitivity to larger EC fragments from rBC in the coated particles is obvious.
(the C+x family) arose only from rBC. However, studies us-ing high-resolution transmission electron microscopy (HR-TEM) have shown that rBC can have varying degrees of dis-order that result from formation conditions (Vander Wal and Tomasek, 2004). Onasch et al. (2015) showed the IR laser in the SP-AMS may cause restructuring of the rBC due to annealing. Annealing has been observed in other graphitic particle systems using HR-TEM and a pulsed laser (Vander Wal and Choi, 1999; Vander Wal and Jensen, 1998). It is also well known that organic matter produces C+1 and C+2 frag-ments following electron ionization (Alfarra, 2004; Corbin
et al., 2014), but we have evidence that SOA either pro-duces larger C+x fragments or changes the rBC fragmenta-tion pattern. In Fig. 7 we show the ion peak area ratios for C+4 /C+3 and C+6−9/C
+
3 for size-selected soot particles as
they became coated with SOA. The SOA mass per particle on thex axis is the mass calculated from particle size mea-surements, described in Sect. 2.3. Both ratios increase con-sistently with coating mass, with a larger slope for smaller cores (with smaller mrBC). This is also apparent in Fig. 6,
where black sticks representing EC from rBC are evident for
Figure 7.SP-AMS measurements of carbon ion family (C+x)peak area ratios versus SOA coating mass on three different BBA soot core sizes, indicated by symbol colors. SOA mass determined from SP-AMS measurements of all identified OM mass (as in Fig. 4). The ratio of C+4 and C+P6−9compared to C+3 increases with organic coating due to either contributions to the C+x family from nonre-fractory OM or a decrease in relative fragmentation of EC to C+3.
in the nascent soot. We propose three possible explanations for these trends: (1) SOA coating changes the fragmentation pattern of EC to reduce the C+3 signal, thereby enhancing the apparent ratio of other EC ions relative to it; (2) SOA gen-erates significant signal for C+>3; or (3) the abundant signal at the same nominal masses as C+>5causes the HR peak fit-ting to incorrectly attribute some signal to C+>5. During HR peak fitting, the user decides whether to include an ion based on the residual signal. The residual signal is the amount of measured signal that is not reproduced by the fitted HR ion species. Although the addition of the higher C+x fragments appear to reduce the residual signal, the peak fitting without them is still very good (residual < 0.05 %). Furthermore, the signal at C+1–C+5 is much higher and better resolved in the peak fitting due to fewer available peaks to fit. Although the causes of these trends are not clear, the trends themselves in-dicate that soot source apportionment by the SP-AMS might be most meaningful for rBC that has been thermally denuded to remove any coatings as this would remove any effect of OM on the C+x ratios measured from the rBC.
We detected small amounts of nonrefractory species other than OM, amounting to less than 10 % of the total mass. Am-monium sulfate condensed onto the particles after they were
injected into the chamber. This was probably caused by the formation of sulfuric acid from oxidation of SO2(g)and sub-sequent neutralization by ammonia in the dry chamber. We also detected nitrate ions after addition of ozone to the cham-ber, as well as after injections ofα-pinene, suggesting the for-mation of some organonitrates (Farmer et al., 2010; Zhang et al., 2006). The NO+/NO+2 ratio was 2.2, as opposed to 1.45 for ammonium nitrate calibration particles. We observed chloride with both SP-AMS vaporizer modes (IR laser on and off), while the potassium signal was much larger when we operated the SP-AMS with the laser on. This is further evi-dence that the potassium is internally mixed with black car-bon and that it underwent one-step thermal ionization in the IR beam (Corbin et al., 2015; Drewnick et al., 2006; Lee et al., 2016). Sulfur dioxide, ammonia, nitrogen oxides, hydro-gen chloride, and chloride salts are known common primary emissions from biomass burning (Levin et al., 2010; Li et al., 2003; Reid et al., 2005; Stockwell et al., 2015; Zauscher et al., 2013).
Figure 8 shows single-polarity mass spectra obtained by the LAAPTOF for individual particles before and after coat-ing with SOA. The characteristic ion series for elemental car-bon included C+1, C+2, and C+3. We also observed anions C−1 and C−2 for some particles, but not as consistently. We ob-served NO+ in both coated and uncoated particles. We be-lieve that this may be the result of NOxand O3combining in
the chamber and forming NO3radicals. These NO3radicals
may then react with water or organic vapors to form HNO3
or organonitrates, respectively. Either species could then con-dense onto the existing particles and fragment to NO+ in the mass spectrometers. K+was readily identified by its iso-topic abundance atm/z+39 and+41 (Bahadur et al., 2010; Healy et al., 2012; Silva et al., 1999). OM fragments tenta-tively identified as CO+atm/z+28 and C2H3O+atm/z+43
were measured from both nascent and oxidized particles. We also observed sulfur and sulfate ions (S+, SO+, and HSO−4), likely fragments of sulfates. Zn+was observed and identified by its isotopic fingerprint.
Figure 8.Positive polarity mass spectra and ion assignments for two representative particles analyzed by the LAAPTOF. The elemental carbon fragment series (C+x)dominates the nascent soot spectra in the bottom, while the contribution from oxidized organic matter is increased in the top panel for a soot particle that was coated withα-pinene SOA.
3.4 SP-AMS sensitivity to refractory species
We determined the ion response of the SP-AMS to biomass-burning particles as a function of SOA coating mass using two ions produced from refractory biomass-burning material – K+and C+3 – normalized by the rBC mass concentration measured by the SP2 (rBCSP2). In Fig. 9 we show the K+
and C+3 SP-AMS ion signal per rBCSP2mass during
progres-sive SOA coating experiments. The plotted points are 10 min averages for four batch chamber experiments using differ-ent initial soot core sizes. We determined the SOA mass per particle using the method described in Sect. 2.3. Different colored and shaped traces indicate the mobility mode diam-eter of the initial soot core injected into the chamber, and the black dots indicate the initial nascent soot, prior to SOA coating. We used the SP2-measured rBC mass to correct for particle wall loss in the chamber because the rBC mass mea-surement of the SP2 is insensitive to particle shape and coat-ing thickness for particles with at least 0.7 fg of rBC present (Schwarz et al., 2010). The smallest particle mode measured in these experiments was 1.1 fg of rBC, well above detection limits for the SP2. All of the wall-loss-corrected ion signals in Fig. 9 were also normalized to the uncoated soot condi-tions. This was done for three reasons. First, the inherent variability in biomass burning limits how much one can ex-pect uncoated soot particles to have similar amounts of K or rBC. However, within a given coating experiment, the aver-age composition of the soot-particle core is guaranteed to be the same. Second, it allows for ready comparison of the data in Figs. 9 and 10, which compares the changes in the two ions directly. Finally, the normalization is a small change relative to the effect induced by coating the soot particles with SOA, which is the focus of this work. Prior to normalization, initial wall-loss-corrected values for C+3 (K+) for nascent condi-tions agreed within 30 % (20 %), compared to the sometimes 300 % (600 %) change due to coating the particles with SOA.
Potassium is a useful marker for refractory BBA material because it has a high signal-to-noise ratio, it is not produced by fragmentation of nonrefractory OM, and it is a nonvolatile unreactive conserved tracer. By turning off the IR laser we confirmed that very little of the potassium signal resulted from particles that hit the conventional 600◦C heater (< 1 % of total K+ signal with IR laser on). Therefore, the potas-sium we observed with the IR laser on was internally mixed with rBC. We selected C+3 atm/z+36 as an ion of interest because of its large contribution to the total rBC C+x family signal (Fig. 4) and the very low contribution from OM. The C+3 signal from OM is less than 0.08 % of the total OM sig-nal when the IR laser is off and particles are vaporized by the heater. One important difference between the two measured species, K+and C+3, is the method of ion formation within the SP-AMS. rBC undergoes the conventional process of IR vaporization followed by 70 eV electron ionization of neu-tral vapors. Potassium, however, has a very low ionization energy and at high temperatures can undergo one-step ther-mal ionization, without interacting with 70 eV electrons to become ionized (Corbin et al., 2015; Drewnick et al., 2006; Svane et al., 2004; Zandberg, 1995). Furthermore, rBC par-ticles approach∼4000 K in the IR laser before vaporizing, while potassium may vaporize or ionize at temperatures less than 1500 K (Svane et al., 2004).
Figure 9.SP-AMS-measured biomass-burning ion signals for C+3 (top) and K+ (bottom) for three mobility-selected core particle sizes versus four different metrics. These signals are corrected for particle wall loss using SP2-measured rBC, and then normalized to values obtained from the uncoated nascent soot. Symbols are colored/shaped by their initial soot core mobility diameter (SP2-measured rBC mass per particle), prior to SOA coating, where red triangles indicate 143 nm (1.2 fg), teal squares indicate 187 nm (2.0, 2.3 fg, two replicate experiments), and purple diamonds indicate 220 nm (3.9 fg). The nascent particles are indicated by black dots, and the lines connect them with the data points following subsequent SOA coatings. The left panels(a, e)display the normalized ratio of the SP-AMS-measured C+3 and K+ion signals, respectively, to the SP2-measured black carbon mass concentration as a function of the mass of SOA per particle. The SP-AMS-measured ion to SP2-measured rBC mass ratio is normalized to the uncoated soot values. Panels(b, f)display the attenuation of the SP-AMS ion signal caused by the beam-width probe in the center of the particle beam; greater attenuation indicates a more collimated, narrow particle beam, as expected for particles that are larger and/or more spherical. Panels(c, g)display the mode mobility diameter of the particles that produced either the C+3 or K+ion signal. The vertical dashed line indicates the lower size cutoff for the aerodynamic lens. Panels(d, h)display the particle dynamic shape factor; particles start as less spherical (χ> 1.0) and move towards sphericity (χ=1) as more SOA mass is added. The measurement uncertainties are indicated by the vertical error bars and represent the standard deviation of 1 min AMS integration time from the 10 min averages presented by each symbol.
steeply, whereas the attenuation of C+3 steadily continues to rise more shallowly with coating thickness.
The IR laser beam cross section that vaporizes particles has a roughly Gaussian intensity profile. The difference we observe between C+3 and K+ attenuation suggests that the effective IR beam for vaporizing rBC, described by Willis et al. (2014), is narrower than the effective beam for thermal ionization of potassium. That is, rBC must pass through a region of higher laser energy density near the center of the IR beam to be vaporized, ionized by the electron source, and then detected, relative to the lower laser energy density that is required for thermal ionization of potassium. If an internally mixed particle containing potassium and rBC passes through the center of the laser, two processes will take place. rBC will become vaporized and ionized, and potassium will be thermally ionized. Since turning off the IR laser reduced the potassium signal to < 1 % of that when the laser was on, we know that the observed changes in K signal result from rBC particles internally mixed with some K. Thus, our
measure-ments show that particles may pass through the potassium thermal ionization region of the IR beam but miss the smaller rBC vaporization region.
The ability of an aerodynamic lens, such as that used on the SP-AMS, to effectively focus a particle depends on parti-cle morphology. Panels c and g in Fig. 9 illustrate the increas-ing response of the SP-AMS to coated rBC as a function of vacuum aerodynamic diameter. The increasing response is likely due to the product of the aerodynamic lens transmis-sion efficiency and the overlap between the particle beam and the IR laser,EIR. However, it appears that the largest increase
in particle sensitivity occurs when the particledvaincreases
beyond 200 nm. The lower size cutoff of the aerodynamic lens is 150 nm, as discussed in Sect. 2.2 and illustrated by a black dotted line in Fig. 9c and g. Any changes in sensitivity for dva> 150 nm are therefore minimally affected by
IR laser, resulting in a larger instrument ion signal response with both increasing particle size and increasing SOA mass. The other factor that influences effective focusing of the par-ticles in an aerodynamic lens is particle shape, reported as a calculated dynamic shape factor, χ. As seen in panels d and h, the shape factor decreases towards unity (χ=1 for spheres) as the particles become more thickly coated with SOA. Although the particles become nearly spherical after a few coatings, they still need to grow to a sufficiently large diameter to be successfully focused into the IR laser beam of the SP-AMS. Neither particle shape nor diameter alone is sufficient to describeEIR. Even atdva=250 nm there is a factor of 2 difference in response to particles with different dynamic shape factors. However, the largest increase in in-strument response occurs after the particles are mostly spher-ical (χ< 1.2), which as we discussed in Sect. 2.3 may de-scribe the state of rBC particles in ambient biomass-burning plumes after less than 1 h of aging. This increase in instru-ment signal is driven by growth from condensation of addi-tional SOA. Panels d and h demonstrate this by plotting the refractory ion signal ratios versus the dynamic shape factor (χ )calculated as described in Sect. 2.3.
Figure 10 shows the same normalized K+and C+3 signals from Fig. 9, accounting for particle wall loss and normal-ized to the ion response under nascent conditions. The differ-ently shaped and colored traces show the relative enhance-ment of ion signals, measured for the same SOA coating conditions. The greater increase in the K+ signal compared to the increase in the C+3 ion signal for the same coatings is attributed to two distinct ion formation mechanisms that the two species experienced. As the IR laser has a Gaussian intensity profile, the different mechanisms occur in differ-ent regions of the IR beam. Eviddiffer-ently, a higher intensity is necessary for the vaporization of rBC, but a lower intensity can still drive thermal vaporization/ionization of alkali met-als, such as potassium and sodium. The Gaussian IR beam thus has a greater effective width for alkali metals than for rBC.
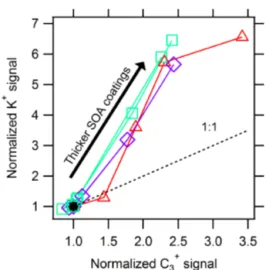
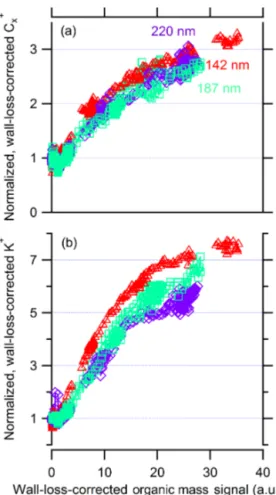
Figure 11 displays the wall-loss-corrected K+and C+x sig-nal measured by the SP-AMS as a function of wall-loss-corrected OM signal. We wall-loss-corrected the SP-AMS signal for wall losses using the rBC mass measurement from the SP2, and we normalized the signals from each experiment to the signals for the nascent soot particles. We smoothed the traces using a three-point boxcar moving average to clarify trends. The OM signal is not quantitative due to unknown relative ionization and collection efficiencies for organics detected with both the IR laser and heater operating simultaneously. However, it provides a high-time-resolution relative metric of the amount of condensed SOA. It shows that even at our highest achieved coating thickness the signals from both K+ and C+x continued to increase; neither signal saturated. This is different from what is expected based on the results of Willis et al. (2014). When they coated Regal Black with OM in the form of DOS, they observed that both OM ions and
Figure 10.Correlation of refractory ion signals from the SP-AMS during SOA coating experiments. Colored symbols represent the relative enhancement of K+and C+3, as in Fig. 9. All four traces, indicating different coating experiments, begin at (1,1) and gener-ally increase with increasing SOA coating. The increase in mea-sured K+compared to C+3 ion signal for the same coatings shows that there are two different effective laser widths for the processes: thermal ionization of K+ and two-step vaporization-ionization of rBC.
EC ions reached a maximum enhancement after coating the Regal Black with a thick coating of DOS (OM mass : EC mass > 3.) Although we cannot rule out the effect ofEIR, the continued increase merits investigation of other causes for increased ion signals with additional SOA coating.
The continuous increase in K+ion signal may potentially be explained by changes in the thermal ionization efficiency, described by the Saha–Langmuir equation (Zandberg and Ionov, 1971). This states that the probability of thermal ion-ization of a species will increase if the surface it vaporizes from has a higher work function or reaches a higher tem-perature. One explanation is that the highly oxygenated SOA possesses a higher work function than the rBC, and thus as the particle is coated it may generate potassium ions more efficiently. However, it seems unlikely that potassium would vaporize before all the SOA, as is seen in similar, albeit am-bient pressure, IR laser systems (Moteki and Kondo, 2007; Schwarz et al., 2010; Stephens et al., 2003). An alternative explanation is that thicker SOA coatings may cause the par-ticle to penetrate deeper into Gaussian profile of the IR laser before the potassium vaporizes and it subsequently vaporizes from a hotter surface, thus generating more ions thermally.
Figure 11. Wall-loss-corrected SP-AMS signal from rBC C+x (panela) and K+(panelb) have been normalized to their nascent values (before SOA coating) and are shown as a function of wall-loss-corrected SP-AMS OM signal. Marker shapes and sizes indi-cate the initial soot core mobility diameter for a given experiment. One-minute averages show that the evolution of the particle sensi-tivity is continuous and, even at our thickest SOA coating, we con-tinue to see an increase in instrument sensitivity to both rBC and K refractory material.
rBC and OM of 0.2 and 1.4, respectively, the perceived in-crease in EC that would be attributed incorrectly would be 1.1 %. This is much smaller than the observed relative in-crease in C+3 for OM : rBC > 3,∼63 % for the change in the last two data points fordmob=220 in Fig. 9a. Furthermore,
with the increased fraction of particles being vaporized by the IR laser, it has been shown that fragmentation would de-crease, thereby decreasing the contribution of SOA to C+3 (Canagaratna et al., 2015b). Alternative explanations may in-clude instrument differences and variability in IR laser beam width. This illustrates that particle-beam width is an impor-tant metric for quantitative measurements of BBA, even with a high SOA : rBC mass ratio > 9 and particle vacuum aerody-namic diameters greater than 400 nm.
3.5 LAAPTOF quantification of OM on externally mixed soot particles
Single-particle analysis provides valuable insight into the physical and chemical evolution of biomass-burning plumes as they are diluted by entrainment of background air and undergo transformation processes during transport. Single-particle analysis also facilitates the determination of contri-butions from biomass-burning particles to aerosol loading for source apportionment and can reveal changes in the mixing state of biomass-burning particles as they age (Chen et al., 2014; Moffet et al., 2008; Silva et al., 1999; Zauscher et al., 2013). Although LDI, such as that used by the LAAPTOF, is often regarded as a semi-quantitative method, there are nu-merous examples demonstrating that it can be mass quan-titative for constrained systems where similar particle ma-trices are studied (Healy et al., 2013; Jeong et al., 2011; Mansoori et al., 1994; Spencer and Prather, 2006; Sulli-van et al., 2007, 2009). Quantitative mass measurements us-ing (LDI-SP-MS) are difficult because of the particle ma-trix effects that influence how much energy is absorbed by a given particle and subsequently the production and fate of the generated ions (Murphy, 2007; Steele et al., 2005; Sullivan and Prather, 2005). Calibration of the LDI-SP-MS ion-signal response to particles of known composition is also required to yield mass-quantitative component measure-ments. The SOA-coated soot experiments we present here provide a unique opportunity to characterize the response of the LAAPTOF to realistic biomass-burning cores coated with complex and realistic biogenic SOA, where the masses of rBC and OM are well constrained.
Figure 12. Averaged OM signal (m/z+28; CO+)from nascent and SOA-coated soot particles measured by the LAAPTOF during SOA coating experiments vs. SOA mass per particle. Error bars indicate the standard error. There is a strong positive correlation despite the complex biomass-burning aerosol matrix. Open marker colors/shapes indicate the initialdmobof the size-selected soot core,
and black markers indicate nascent, uncoated soot particles.
although other LDI-SP-MS studies have found a good corre-lation between OM signal and reference measurements, this work shows that an even better correlation can be obtained if the analysis can be informed by the chemical information provided by the mass spectra. In this case we show that, with some improvements in excimer laser homogeneity, it may be possible for an algorithm to isolate rBC-containing particles and identify the necessary function to convert OM signal into SOA mass per particle.
Figure 13 shows the same OM ion signal measured by the LAAPTOF plotted in Fig. 12, now normalized by the con-current LAAPTOF EC ion signal. This parallels the analy-sis by ATOFMS of spark-generated EC particles coated by the condensation of diesel fuel presented by Spencer and Prather (2006), but using more complex and realistic parti-cle EC and OM components. EC fragments used included C+2−5 but excluded C+1 because we have observed that OM can also be charred to C+1 and thus produce an interference to the quantification of EC atm/z+12. The OM : EC ion ratio used here is thus CO+: C+2−5. We use the ratio of OM/EC
ions to account for laser shot-to-shot variability, where more ions may be generated due to increased laser fluence or in-creased absorption of laser energy. We sampled biomass-burning particles that contained potassium salts, which ionize readily, as well as strongly light-absorbing rBC (Gross et al., 2000). This represents the complex composition of realistic aged BBA. Initial particles were composed mostly of black carbon, with initially variable shapes, and with an unknown distribution of potassium salts per particle. Despite the vari-ability in the soot core composition of individual particles, a positive correlation between the amount of SOA mass per particle and the LAAPTOF ion signal from oxidized organics
Figure 13.LAAPTOF-measured OM ion signal (m/z+28; CO+)
normalized by LAAPTOF EC ion signal (sum ofm/z+24,+36,
+48,+60; C+2−5)for uncoated and SOA-coated soot particles. Er-ror bars indicate the standard erEr-ror. Here the OM : EC ratio is shown as a function of the ratio of mobility-derived SOA mass to SP2-measured rBC. The LAAPTOF EC signal serves as an internal stan-dard to normalize for the actual amount of laser energy the particle absorbed, which can change with increased rBC mass or SOA coat-ing, and particle size and shape. Marker colors/shapes indicate the initial size-selected soot coredmobfor each experiment.
was still observed from these mixed rBC and inorganic salt particles, when averaged over the many particles we sam-pled.
Other LDI-SP-MS instruments that use longer ionization wavelengths, such as 266 nm used in the ATOFMS, do not typically fragment oxidized organics to CO+; instead their major oxidized OM ion fragment is observed at m/z+ 43, presumably from C2H3O+ (Moffet and Prather, 2009;
frac-tion of SOA. Spencer and Prather used condensed diesel fuel vapors as their source of OM, while we used SOA from the ozonolysis ofα-pinene. Therefore, the OM used in the prior study was unoxidized primary organic aerosol, while our OM was highly oxidized complex secondary organic aerosol.
4 Conclusions
We investigated the response of two particle mass spectrom-eters to biomass-burning particles with carefully controlled amounts of organic matter and well characterized particle properties. Our analysis revealed a variety of particle mor-phologies and compositions, leading to a broad distribution of vacuum aerodynamic diameters at a single selected mobil-ity diameter. As these particles of various compositions and shapes became coated with SOA, measurements using the beam-width probe of the SP-AMS revealed that the effec-tive IR laser beam width for thermal ionization of potassium is larger than for vaporization of rBC. Future measurements using the SP-AMS would do well to quantify the particle-beam and effective IR laser particle-beam overlap for the species of interest using beam width probe measurements. The fraction of rBC-containing particles that experience sufficient laser fluence to vaporize the nonrefractory coating should always be greater than or equal to the fraction of particles whose refractory material is also vaporized. The use of optical com-ponents to change the IR laser from a Gaussian to a uniform flat-top energy profile would greatly simplify the analysis of rBC-containing soot particles by the SP-AMS by ensur-ing that all particles passensur-ing through the laser experience the same amount of energy. This would eliminate the difference given above regarding the fraction of rBC-containing parti-cles whose nonrefractory versus refractory components are detected.
Although these measurements explored thick SOA coat-ings and large particle sizes, we did not observe a plateau in instrument response to potassium or black carbon as the coating was increased. These findings have important im-plications for obtaining quantitative mass measurements and can help to better inform the analysis and interpretation of SP-AMS measurements of the emissions and aging of BBA (Corbin et al., 2015; Dallmann et al., 2014; Fortner et al., 2012; Lee et al., 2016; Massoli et al., 2015). We would like to add, however, that although changes in dva may result in varying EIR, SP-AMS measurements of rBC have been
shown to correlate with reference measurements (Fortner et al., 2012; Willis et al., 2014). This suggests that the changes in secondary aerosol mass required to cause large changes in
EIR for rBC did not happen on the timescale of those
mea-surements.
Mass spectral analysis with the SP-AMS also revealed that increased SOA coatings on the biomass-burning soot changed the relative abundance of EC clusters. Specifically, as the particles became more thickly coated with SOA, the
ratio of C+>3to C+3 increased. The degree of change for the ra-tio of C+4 to C+3 was smaller than the precision suggested by Corbin et al. (2014) for identifying soot-particle source types using ratios of the elemental carbon ion family, C+x. How-ever, the observed ratio of C+4 to C+3 was inconsistent with that previously observed from quenched-combustion flame soot (Corbin et al., 2014; Maricq, 2014). This reinforces the need for thermal denuding of ambient soot samples before attempting source analysis using EC ratios.
Despite the challenges presented by complex particle com-position and shape for laser desorption ionization single-particle mass spectrometry, there is a strong correlation between the average OM ion signal measured by the LAAPTOF and the SOA mass per particle. Although this quantitative relationship has been shown previously for LDI-SP-MS analysis of graphite spark discharge soot coated by diesel fuel condensation (Spencer and Prather, 2006), this is the first time it has been explored with realistic combus-tion soot in the presence of inorganic components and com-plex realistic SOA. This opens the way for more quantitative single-particle measurements using techniques such as laser-beam homogenization and particle type informed ion sensi-tivity calibrations. Additional work is required to investigate the response of single-particle mass spectrometry to other at-mospherically relevant core–shell combinations.
5 Data availability
Data are available upon request from R. Sullivan ([email protected]).
Acknowledgements. A. T. Ahern and G. Saliba were partially supported by the Steinbrenner Graduate Research Fellowship. R. Subramanian was funded by the US Department of Energy Atmospheric Systems Research program through grant DE-SC0010121. The authors thank Claudio Mazzoleni for the loan of the CPMA. This work was supported in part by the National Science Foundation (awards CHE-1412309 and AGS-1552608). The views, opinions, and/or findings contained in this paper are those of the authors and should not be construed as an official position of the funding agencies.
Edited by: P. Herckes
Reviewed by: J. C. Corbin and one anonymous referee
References