www.atmos-chem-phys.net/9/8091/2009/ © Author(s) 2009. This work is distributed under the Creative Commons Attribution 3.0 License.
Chemistry
and Physics
The representation of dust transport and missing urban sources
as major issues for the simulation of PM episodes in a
Mediterranean area
E. Flaounas1,*, I. Coll1, A. Armengaud2, and C. Schmechtig1
1LISA, CMC, 61 avenue du G´en´eral de Gaulle, 94010 Cr´eteil Cedex, France 2AtmoPACA, 146 rue Paradis, 13006 Marseille, France
*now at: LATMOS, IPSL, Universit´e Pierre et Marie Curie, CNRS, Paris, France
Received: 18 May 2009 – Published in Atmos. Chem. Phys. Discuss.: 15 July 2009 Revised: 7 October 2009 – Accepted: 8 October 2009 – Published: 27 October 2009
Abstract.Due to its adverse effects on human health, atmo-spheric particulate matter (PM) constitutes a growing chal-lenge for air quality management. It is also a complex sub-ject of study. The understanding of its atmospheric evolu-tion is indeed made difficult by the wide number of sources and the numerous processes that govern its evolution in the troposphere. As a consequence, the representation of partic-ulate matter in chemistry-transport models needs to be per-manently evaluated and enhanced in order to refine our com-prehension of PM pollution events and to propose consistent environmental policies. The study presented here focuses on two successive summer particulate pollution episodes that occurred on the French Mediterranean coast. We identify and analyze the constitutive elements of the first and more massive episode and we discuss their representation within a eulerian model.
The results show that the model fails in reproducing the variability and the amplitude of dust import from west-ern Africa, and that it constitutes a strong bias in PM daily forecasts. We then focus on the lack of diurnal variability in the model, which is attributed to missing urban sources in standard emission inventories, and notably the resuspen-sion of particles by urban road traffic. Through a sensitiv-ity study based on PM and NOx measurements, we assess
the sensitivity of PM to local emissions and the need to re-consider road traffic PM sources. In parallel, by coupling the CHIMERE-DUST model outputs to our simulation, we show that the representation of transcontinental dust
trans-Correspondence to:E. Flaounas ([email protected])
port allows a much better representation of atmospheric par-ticles in southern France, and that it is needed in the frame of air quality management for the quantification of the anthro-pogenic part of particulate matter pollution.
1 Introduction
Besides its importance in influencing climate (Charl-son, 1992), particulate matter of anthropogenic origin is a main component of atmospheric pollution and is respon-sible for the lack of visibility in urban centers (Park and Kim, 2005; Vallius et al., 2005; W˚ahlin et al., 2006; Lonati and Giugliano, 2006). Its impact on human health is now widely recognized; many studies indeed showed that atmo-spheric particles can easily enter respiratory airways, with a depth of inhalation and a deposition rate depending on their size, shape, physical and chemical properties (Monn, 2001; Moschandreas and Saksena, 2002). Epidemiological studies have demonstrated the association between the exposure to PM10 and PM2.5(particulate matter with a diameter lower
than 10µm and 2.5µm, respectively) and all-cause ity, among which lung-cancer and cardiopulmonary mortal-ity are listed (Scoggins, 2004). Recently, (Larrieu, 2007) confirmed that current levels of PM10 and nitrogen
diox-ide in several European cities are linked to a short term in-crease of cardiovascular morbidity. Since 1999, the Euro-pean Union has set limit values for PM10 for the protection
of human health over different averaging periods, so as to represent various exposure durations. A 24-h limit value of 50µg/m3was fixed, not to be exceeded more than 35 times
40µg/m3. Van Dingenen et al. (2004) and Yttri (2005) re-ported that, at the beginning of the 2000s, this last standard was exceeded at all near-city, urban and kerbside places in Europe, while the annual limit value of 40µg/m3was still over passed in several areas. Their studies also revealed that for hourly values, the 50µg/m3 threshold was extensively exceeded, especially in Italy (87 days per year), and that an upward trend in PM10baseline was observed since 2000 in
some European countries.
In urban and suburban areas, the major sources of anthro-pogenic aerosols are road traffic and fossil fuel burning emis-sions, as well as combustion and soil-related industrial activ-ities (Kaur et al., 2007; Yatkin and Bayram, 2007). Never-theless, the background PM10levels are mainly composed of
mineral crustal particles, and it is common that long-range transport of natural aerosols strongly participates in high lo-cal PM episodes. Indeed, Saharan dust outbreak events have been shown to be responsible for short-term sharp increases in PM10concentrations in the boundary layer over the
west-ern and eastwest-ern Mediterranean, and were associated to fre-quent exceedances of the EU limits for PM10(Viana, 2002;
Rodriguez, 2004; Moreno, 2005; Ganor, 2009), with peak values that could exceed 200µg/m3 during 48 h for severe events (S´anchez et al., 2007). Numerous studies have de-scribed and discussed the importance of such dust import to Spain (Rodriguez et al., 2002; Lyamani et al., 2005; Sal-vador, 2008), and Italy (Gariazzo et al., 2007; Barkan, 2005; Mona, 2006). Several studies also focused on the import of dust to different parts of Europe (e.g. Viana, 2008), but to our knowledge no French data have been discussed in this context. Only the very recent study of Querol et al. (2009) proposes a comparison of dust impact across the Mediter-ranean basin, including three sites in southern France. These data support the possibility of a significant impact of African dust on this area.
Eulerian models that simulate the transport and the trans-formation of aerosols and gases constitute an important tool to enhance our knowledge about aerosol pollution events, and to develop efficient action plans to reduce the atmo-spheric levels of particulate matter (Ilacqua et al., 2007; Turpin, 2000; Thunis, 2007). However, in these models, the anthropogenic and terrestrial fractions of particulate mat-ter need to be betmat-ter described and quantified. Model inmat-ter- inter-comparisons, but also single evaluations of models against measurements, have been conducted in order to evaluate our current capabilities to perform comprehensive PM modeling (Bessagnet et al., 2004; Monteiro et al., 2007; Sartelet et al., 2007; Stern et al., 2008). The results helped to gain confi-dence in the simulation of the chemical constituents of partic-ulate matter and showed that models were able to capture the general variability of PM during the simulated periods. How-ever, they also highlighted some deficiencies in the models, which often lead to an underestimation of modeled PM con-centrations relative to observations. These deficiencies have been attributed to the choice of the physical and chemical
pa-rameterizations (including secondary organic aerosol (SOA) production), to meteorological input fields and the associated parameterization of vertical exchanges in the atmosphere, to the treatment of badly known sources, to long-range trans-port of dust particles, but also to the precision of measure-ments used for comparison. In addition, the studies indicate that errors in the emission data are important sources of un-certainty, that may reach 20% on a total anthropogenic an-nual basis for Europe, while they are known to be consider-ably larger for individual model grid points and short time scales (hours to days). In consequence, the exploration of particulate pollution case studies remains necessary to better identify the nature of particulate pollution events and to pro-vide new directions to ameliorate eulerian model realism, for an improved air quality management.
The study presented here focuses on the simulation, with the CHIMERE eulerian model, of PM10 concentrations in
the south of France during two successive PM episodes that occurred in the month of June 2006. It aims at understand-ing the constitutive elements of this episode, at evaluatunderstand-ing the ability of the model to restitute those elements, and at iden-tify the elements in the model that can be enhanced for a bet-ter simulation and forecast of similar phenomena. This study was conducted in close cooperation with Atmo PACA, which is the public association in charge of air quality monitoring and modeling in the Provence-Alpes-Cˆote d’Azur (PACA) region. After the presentation of the site of the study and of the CHIMERE model configuration, we will analyze the ground-based observations of PM10during the selected
pol-lution event and compare them with the model outputs. In a second part, sensitivity studies will help identifying the ori-gin of the gaps between the model and the measurements, and some possibilities to enhance the representation of PM10
in the model will be discussed.
2 Presentation of the study
2.1 Site and measurement data
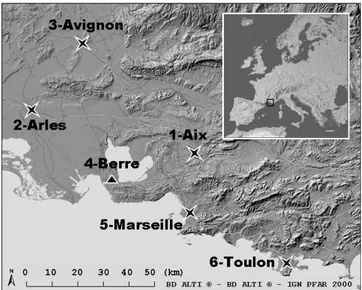
In this study we focus on the western greater part of the PACA region. The domain is characterized by a complex topography (Fig. 1): it is covered with mountains (which don’t exceed the altitude of 1000 m) forming two valleys (of Rhˆone and of Durance) while to the south lays the Mediter-ranean Sea. The largest city of this area is Marseille, which population is of about 820 000 inhabitants. Other large ur-ban centers are Toulon, Avignon, Aix and Arles. A large industrial complex is located in Berre, 50 km to the west of Marseille. Among the numerous stations measuring pollu-tants over the area, PM10 are measured using a Tapered
Ele-ment Oscillating Microbalance in 5 urban areas and 1 indus-trial area on the simulation domain. Measurements of NOx
Fig. 1. Presentation of the simulation domain and location of the urban (black star) and industrial (black triangle) PM10measurement sites.
listed above. Two types of atmospheric circulation prevail on the region: Mistral and sea breeze conditions. The Mis-tral is a strong wind flowing from the north which eventually turns easterly as it propagates towards the South due to the sea-land temperature contrast. As a consequence, it mostly affects the western and central parts of the domain, with an expected beneficial effect on air quality due to strong atmo-spheric dilution (Salameh, 2007). Sea breeze circulation is associated with low winds blowing from the south. Figure 2 presents the wind rose plot for June and July 2006 and the as-sociated mean PM10concentrations at the Marseille
ground-based station. It shows evidence that the sea breeze (south-west, south-east direction) is associated with the greatest fre-quency and with high PM10 concentrations, probably due to
PM advection from the urbanized coast, but also due to long-range transport of particles. On the reverse, Mistral events (310◦–340◦) show stronger wind speeds and are
accompa-nied with a drop in particulate pollution intensity. The west-ern area of Arles-Avignon is the most exposed to Mistral events, while the whole region is exposed to the slow advec-tion of air masses by the sea breeze in low-dispersion con-ditions, as air masses are further blocked by the large moun-tainous volumes laying to the north-east (Drobinski, 2007). Its intense emissions, but also its southern location, make of this region the most polluted area in France in terms of ozone but also in terms of particulate matter, with 50% of the days having a non good quality of air. Thus, the PM1024 h-limit
of 50µg/m3is exceeded 43 to 116 times a year at several urban sites (especially in Marseille and Toulon), while only 35 excess are tolerated per year.
Fig. 2. Wind (top) and PM concentration (bottom) sector plots at Arles for June and July 2006.
2.2 Model configuration
For this study we used the Chemistry Transport Model CHIMERE (http://www.lmd.polytechnique.fr/chimere/). The model was first run on a domain covering the entire PACA region with an horizontal resolution of 9 km and forced at its boundaries by the national and continental PREV’AIR simulations (http://www.prevair.org). In a second step, the model was run over a nested domain with a finer horizontal resolution of 3 km along 41×51 grid points,
covering all the urban agglomerations shown in Fig. 1. On the vertical, the domain is divided into 8 levels from the ground to 750 hPa.
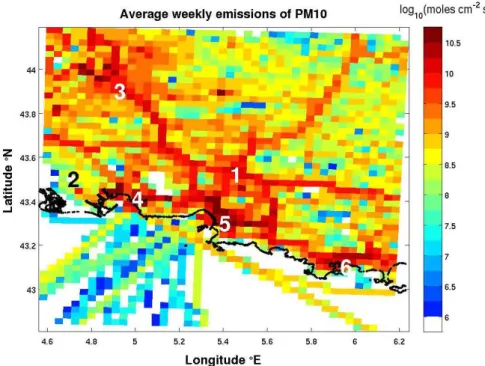
Fig. 3.Anthropogenic emissions of NOx from the regional Atmo PACA inventory. The numbers correspond to the measurement sites listed in Table 1.
including 19 organic species and 120 reactions. Photolysis rates are calculated under clear sky conditions as a function of height using the TUV model of Madronich (1998). Dy-namical calculations were provided by the MM5 meso-scale model (http://www.mmm.ucar.edu/mm5/) running at the same horizontal resolution as CHIMERE. The CHIMERE aerosol module accounts for 8 species (primary particulate matter – including not only black carbon and organic car-bon but also industrial mineral dusts – nitrate, sulfate, ammo-nium, biogenic and anthropogenic secondary organic aerosol – SOA – sea salts and water) and uses 6 size bins from 10 nm to 40µm. Physical processes taken into account are the fol-lowing:
– Coagulation is calculated from the theory used by Gel-bard (1980)
– Absorption is taken into account for both inorganic and organic species. For inorganic species, equilib-rium concentrations are computed with a tabulated ver-sion of the thermodynamic module ISORROPIA (http:// nenes.eas.gatech.edu/ISORROPIA). For secondary or-ganic species, equilibrium concentrations are calculated through a temperature dependent partitioning coeffi-cient (Pankow, 1994).
– Concerning nucleation, the parameterization of Kul-mala (1998) for sulfuric acid nucleation is used. This process is affected to the smallest bin in the sectional distribution. Although the nucleation of condensable
organic species has been clearly identified in many ex-perimental studies (Kavouras, 1998), no parameteriza-tion was available for this version of the CHIMERE model. However, since the sulfuric acid nucleation pro-cess competes with absorption propro-cesses, it is expected to occur in weakly particle polluted conditions. Up to now, a very simplified scheme for SOA forma-tion has been implemented in the chemical module MEL-CHIOR, based on biogenic and anthropogenic aerosol yields. In the model, precursor volatile organic compounds able to form secondary aerosol species are high chain alkanes, aro-matics and monoterpenes. Mass transfer between gas and aerosol phases is not only driven by the gas phase diffusion but also by the thermodynamic equilibrium through a tem-perature dependent partition coefficient (see http://www.lmd. polytechnique.fr/chimere/) for more details). Aqueous sul-phate chemistry is considered, as well as a few heterogeneous reactions relative to nitric acid chemistry. Dry deposition for model gas species is parameterized as a downward flux from Wesely (1989). Dry deposition for aerosols also makes use of a resistance scheme.
Anthropogenic emissions are provided by the kilomet-rical regional inventory developed by Atmo PACA with a bottom-up approach for air quality forecast, last updated in 2006 and which considers NOx, speciated volatile organic
compounds, SO2, CO, PM10 and PM2.5 from fixed
sector (approximately 60% of the regional emissions) asso-ciated to punctual sources in the industrial area of Berre, at the west of Marseille, followed by road transports (approx-imately 30%). However, the weight of the road transport sector increases to 40% if we consider the finest particles (especially PM2.5). It is necessary to note here that the
in-ventory of PM sources is not exhaustive. In particular, the diffuse emissions of industrial fabrics, the agricultural sec-tor, the particles stemming from the wear of tires, brakes and roads and their resuspension due to road traffic are not taken into consideration here, as in many current inventories, due to a lack of data. Biogenic emissions of isoprene and ter-penes are parameterized as fluxes depending on temperature and insulation.
The evaluation of CHIMERE is processed everyday at Atmo PACA through a statistic evaluation of the model air quality forecasts against the ground-based network of chem-ical and meteorologchem-ical measurements. The results are very satisfactory for gaseous pollutants, but show an underestima-tion of the observed PM10 levels. Concerning meteorology,
the ability of MM5 to restitute the local air mass circulations on this area was shown in the frame of a previous model-ing and measurement program (Pirovano, 2007). The simu-lations were conducted for the whole June and July periods with hourly outputs.
3 Analysis of the episode simulation
The model was run over the whole period in the configura-tion described above. The simulated PM10 concentrations
were compared to observations and analyzed, so as to eval-uate the ability of the model to perform comprehensive PM simulations.
3.1 Regional features 3.1.1 PM episode restitution
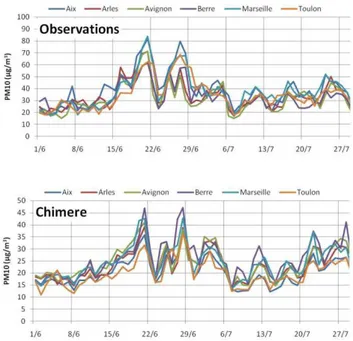
In Fig. 4 (upper graph) are represented the time series of the daily mean PM10 concentrations measured at all the PACA
stations during the period of June–July 2006. The obser-vations reveal a mean PM background of 20 to 30µg/m3. This value is consistent with longer term observations, as de-scribed in the annual air quality reports of this region (At-moPACA, 2008). However, during this period, the measured concentrations twice overstep the limit of 50µg/m3: from 18 to 21 June and from 25 to 30 June. The PM maxima then reach 60 to 75µg/m3. These episodes of particulate pollu-tion can be associated to synoptic influences and not to local phenomena, as the peaks are observed at all sites and prove to be correlated site by site.
We can notice from the lower graph (modeled values) that the model is able to capture the main features of the day-to-day variability of PM10 during the whole period. The
correlation between observations and model outputs varies
Fig. 4. Observed (upper graph) and modeled (lower graph) daily mean concentrations of PM10at the 6 measurement sites
betweenr2=0.4 (for Arles) andr2=0.61 (for Marseille) for daily mean concentrations. During the first two days of the second episode, the western part of the domain (Avignon, Ar-les) is exposed to a minor Mistral event making the PM peaks much lower than in the other areas. The geographical extent of this meteorological phenomenon is overestimated in the model, which simulates a decrease of PM10 in all stations.
This point does not constitute a bias of the model. However, when comparing the simulated daily mean time series with the observations, it appears that the model systematically un-derestimates the particulate pollution levels (i) by 10µg/m3 (factor of 1.5) during the non-event days and (ii) by 25µg/m3 (factor of 2) during the two episodes of June.
3.1.2 Analysis of the episode
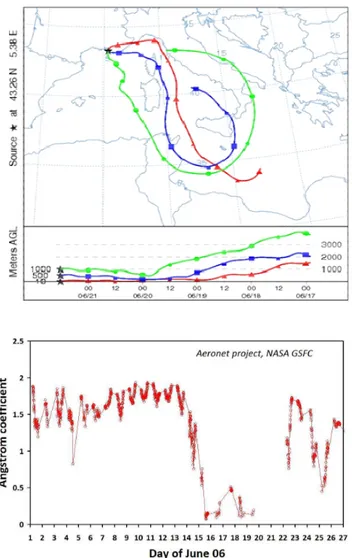
We focused on the first episode, which peaks on 21 June. Due to its regional amplitude, we investigated the possibil-ity of large-scale transport of aerosols to the simulated area, through a back trajectory analysis for the whole period. The NCEP Final analysis (FNL) showed that during the episode high pressures were prevailing over western Mediterranean. Rodriguez et al. (2001) showed that similar meteorological conditions (anticyclonic circulations) were responsible for PM pollution episodes over Spain, by driving air masses from north Africa to southern France.
Fig. 5.Four-day back trajectories arriving at Toulon on June 21 (up-per panel, http://www.arl.noaa.gov/HYSPLIT.php) and Angstrom coefficient (Level 2.0 AOT) evolution in Toulon for June 2006 (lower panel, http://aeronet.gsfc.nasa.gov/).
in Toulon within the frame of the AERONET project (http: //aeronet.gsfc.nasa.gov/) as well as Aerosol Index (AI) maps (not shown here) generated by TOMS, NASA (http://toms. gsfc.nasa.gov/aerosols) for the month of June 2006. Those data (see Fig. 5) well show that Mediterranean air masses ar-riving at our domain on 21 June are associated with low val-ues of the 440–870 Angstrom coefficient, which clearly iden-tifies a dust event during the 15–19 June period, most likely extending to 21 June according to the values calculated for 22 June. Unfortunately, no data is available between 26 June and 29 June. At the same time, elevated AI values over the western Mediterranean confirm the existence of significant dust outbreak events. The AI indeed overpasses the value of 1.0 in the region of north Africa – west Mediterranean sea, signifying the existence of aerosols absorbing UV radi-ation and which can be considered as dust aerosols. Such
an approach was previously used by Lyamani et al. (2005) to demonstrate the occurrence of a similar event in southeastern Spain.
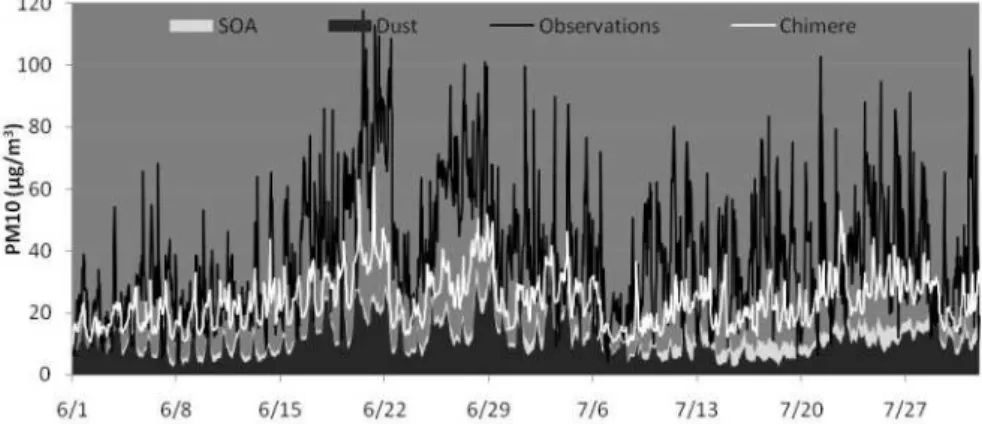
It is interesting to notice that CHIMERE represents the occurrence of the two dust events in proper time (see the temporal evolution of modeled dust at Marseille in Fig. 6), each time with a slight increase in the PM background level over the whole area. We could associate this increased level with the import of particulate matter through the southern boundary of the simulation domain. However, as large-scale CHIMERE simulations are forced at their boundaries by cli-matological dust concentrations, it comes out that such data are nor able to reproduce the intensity of the PM background during this period, neither to describe the variability in the composition of incoming air masses at the limits of the do-main. It thus cannot provide a good representation of sum-mer PM evolution in southern Europe.
We investigated the possibility to improve the model pre-dictions in such situations by implementing, as boundary conditions in our run, the concentration fields of dust parti-cles simulated by the DUST version of the CHIMERE model (http://www.lmd.polytechnique.fr/dust/) for the same period. This version of CHIMERE is dedicated to the transport of mineral particles and reproduces the emission, dry and wet deposition and transport of these particles over west Africa. Dust concentrations are represented through 20 size bins from 0.01 to 34µm. The model is driven by MM5 meteo-rological fields and has been run for the whole year 2006 on a 1◦
×1◦grid covering a rectangular domain between 90◦W–
90◦E and 10◦S–60◦N with 15 vertical levels from the
sur-face to 200 hPa. More details about this version of the model can be found in Menut (2007).
Outputs are available every 12 h. We interpolated the con-centration fields so as to fit our spatial and temporal res-olutions, and the 20 dust concentration classes were redis-tributed into our 6 larger size bins to replace our initial and boundary conditions for the dust component of the partic-ulate matter. This simulation, called DUSTBOUND, was run for from 9 June to 24 June. The results are presented in Sect. 4.
3.2 Local features
Fig. 6.PM10hourly evolution in Marseille as calculated by CHIMERE (white line) compared to observations (black line). The simulated dust and SOA parts composing PM10are represented as cumulative areas.
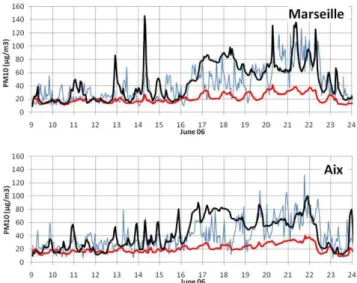
Fig. 7.Observed (blue line) and modeled (red line) PM10 concen-trations in Toulon, for a representative week of the studied period.
An underestimation of the local production of secondary organic aerosol in the model may be partly responsible for the low variability in the model outputs. The underestimation of SOA is a common feature to many models (Zhang, 2007). But although this point clearly needs refinement, it may not be the main reason for the smooth aspect of the model out-puts as we consider source areas and we mainly miss morn-ing peaks.
In urban areas, the hourly variability of PM10 is mainly
dependent on road traffic emissions. As NO2and PM urban
emissions are mainly related to road traffic, we plotted (fig-ures not shown) the observed PM10concentrations versus the
observed NOxconcentrations at all urban stations during the
periods with negligible wind, in order to obtain data repre-sentative of local traffic emissions. We observed a linear de-pendency between the two species, with a PM to NOxratio
of about 0.4 while in the emission inventory, the dependency between PM10 and NOx in urban cells varies between 0.1
and 0.2 only. May this result from an insufficient description of aerosol resuspension related to traffic in anthropogenic emission inventories, as discussed previously? According to recent studies, the contribution of resuspension phenom-ena is estimated to a level of 20% of road traffic emissions, while 20% further can be attributed to coarse fraction abra-sion source emisabra-sions, the rest of emisabra-sions including
com-bustion and fine fraction abrasion (Thorpe et al., 2007). In our case, the inventory PM to NOx ratio points out an
un-derestimation of urban PM sources by at least a factor of 2, which fits with the omission of resuspension and road wear sources.
We thus investigated the improvement of the model that can follow from a re-adjustment of PM urban emissions, if supplementary traffic-related sources are taken into account. We launched an empirical sensitivity test by replacing the anthropogenic particle emissions by that of NOxadjusted by
a factor of 0.4 according to the observations. The sensitivity test, called EMISS, was conducted from 9 to 24 June in order to explore both periods with and without dust import. The results are presented in the next section.
4 Sensitivity tests results
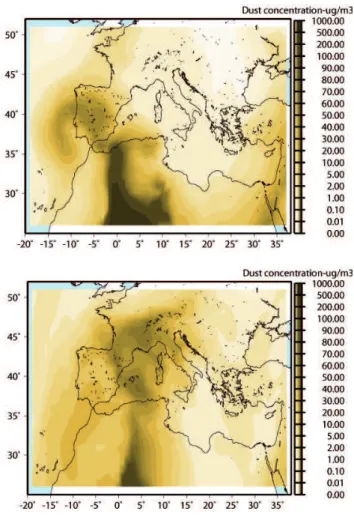
The CHIMERE DUST simulation results reveal that the model well predicts the transport of dust particles from north-western Africa to the Mediterranean during the third week of June 2006. The arrival of a dust plume is represented in Fig. 8 which shows dust concentration maps calculated at 800 m asl for 14 June and 17 June at 12:00 UT.
When used as boundary conditions, these dust concentra-tion fields strongly impact the regional simulaconcentra-tion of PM10.
The time series in Fig. 9 present the regional model results for the reference simulation and for the simulation DUST-BOUND, together with measurements, for the grid cells of the Aix and Marseille sites, respectively. We can clearly see that the DUSTBOUND simulation better reproduces the phe-nomenology of a PM event than the reference run, although its intensity remains strongly overestimated (20 to 30µg/m3) from 17 to 19 June. This may either follow from inaccura-cies in the dust plume location or from an overestimation of its intensity during the early days of the event. However, the sudden and pronounced increase in the PM10 baseline (up
Fig. 8.Dust concentration maps (inµg/m3)calculated at 800 m asl by CHIMERE DUST, for two selected dates of June 2006.
much better fit the observations, constitute a visible improve-ment of the model outputs. In this coupled configuration, the model thus proposes a more realistic PM background evolu-tion, and provides a better understanding of particulate mat-ter composition in the area. It shows that dust climatological values, commonly used as boundary conditions for CTMs, constitute a limitation to explain common particulate pollu-tion events in southern Europe.
We can see that this new simulation however does not re-produce the high PM peaks observed in all urban stations during the dust event. From the observation of the large dust plumes in Fig. 8, we assumed that long-range transport of terrestrial particles may not generate such variability in the PM10levels, and we supposed a local origin for these peaks.
The results of the simulation EMISS should thus indicate us if they may originate in local urban traffic emissions.
The time series in Fig. 10 show the model outputs for the reference simulation and for the simulation EMISS, together with observations for the urban sites of Toulon and Mar-seille. This figure reveals a much more realistic evolution of PM10 concentrations in the simulation EMISS. Although
Fig. 9. PM10time series from the reference (red line) and DUST-BOUND (black line) simulations in Aix (upper graph) and Mar-seille (lower graph) for the 3 selected weeks of June 2006. Obser-vations are reported in blue.
Fig. 10.Reference (red line) and EMISS (black line) simulations of PM10concentrations in Aix (upper graph) and Toulon (lower graph) for a representative week of June 2006. Observations are reported in blue.
the exact intensity of the PM peaks measured at urban sites is not expected to be reproduced in the model due to the well-known dilution of CTM emissions in the grid cells, the model now better captures the hourly features particulate pollution. This simulation produces PM10peak values of the right order
We have to keep in mind that, from the point of view of emission parameterization, this simulation is a simplis-tic one, and may not be consistent over the whole domain. However, these results highlight the fact that current anthro-pogenic PM emissions are underestimated in urban areas and can be easily improved using a refined empirical approach. Even if these emissions are not as influential as dust advec-tion on the regional PM levels, their improvement remains necessary to explore the role of local PM emissions on urban air quality.
5 Conclusions
During the third week of June, an important episode of par-ticulate pollution with PM10 concentrations ranging from
60–100µg/m3 was observed in the south of France. We showed that it originated in the long-range transport of African dust, confirming that outbreak phenomena can in-fluence particle levels in southern France even under the form of moderate episodes. This result is in agreement with the observations reported for other Mediterranean countries (Rodriguez et al., 2001, 2002; Querol et al., 2009; Mit-sakou, 2008). Although the CHIMERE model was able to reproduce the nature and the timing of this episode, we show that the use of climatological values to determine the amount of dust transferred to the domain from the larger scale are insufficient to reproduce the amplitude of the event. During this episode, the simulation outputs indeed showed a nega-tive bias reaching 25µg/m3 over the whole region. Addi-tionally, during all the simulation period, we highlighted a poor representation of the hourly variability of PM10 in
ur-ban cells compared to observations which was attributed to an incomplete representation of urban driving sources. Our conclusions meet those of Astitha et al. (2008) which show in their overview on regional modeling that emissions inven-tories and dust transport are major elements in air quality forecasts.
In the second part of this paper, the model sensitiv-ity to urban emissions, as well as the impact of enhanced dust boundary conditions on the model outputs was inves-tigated. Our objective was to evaluate CTM improvement strategies to better represent particulate pollution in south-ern places of Europe. We highlighted the need for an im-provement of anthropogenic PM emission inventories, es-pecially concerning road traffic. We showed that the cur-rent gap between inventories and observations could reach a factor of 2 for PM10 in urban centers. Quite recently,
the COPERT methodology aiming at the calculation of air pollutant emissions from road transport has been updated to include resuspension by vehicles (http://lat.eng.auth.gr/ copert/). The evaluation of inventories using this method-ology needs to be performed to evaluate the degree of provement reached in the model outputs. Finally, by im-plementing the CHIMERE-DUST outputs at the boundaries
Fig. 11. PM10 in Aix (upper graph) and Marseille (lower graph) as simulated by CHIMERE in the reference configuration (red line) and for the hybrid DUSTBOUND-EMISS simulation (black line) for a 3-week period in June 2006. Observations are shown in blue.
of our domain, we showed that the use of large-scale dust emissions and transport models provide most reliable PM10
forecasts for public information, but also for PM10 event
analyses and further PM pollution regulation. Indeed, the “Thematic Strategy on Air Pollution” of the European Envi-ronmental Agency that follows from the Clean Air For Eu-rope initiative (http://ec.europa.eu/environment/archives/air/ cafe/activities/pdf/cbabaselineresults20002020.pdf) relies on modeling as its primary source of information, while us-ing monitorus-ing data to calibrate its chemical transport model EMEP (http://www.emep.int/). The modeled data obtained are further used in support of negotiations on emission re-duction measures and for assessing of the feasibility of such measures. The precise determination of the reducible (an-thropogenic) part of PM10by models thus constitutes a
chal-lenge for Mediterranean countries within the frame of the elaboration of particle-related European directives. In this study we underline the necessity for the nesting of CTMs by a large-scale model.
Acknowledgements. Edited by: B. N. Duncan
The publication of this article is financed by CNRS-INSU.
References
AIRMARAIX: Les sources d’´emissions en paca, Marseille 01-10-emissions-extensionregio-sf-ir02, 2005.
AtmoPACA: Surveillance de la qualit´e de l’air, bilan annuel 2007 Marseille, 2008.
Astitha, M., Kallos, G., and Katsafados, P.: Air pollution mod-elling in the Mediterranean Region: Analysis and forecasting of episodes, Atmos. Res., 89, 358–364, 2008.
Barkan, J., Alpert, P., Kutiel, H., and Kishcha, P.: Synoptics of dust transportation days from Africa toward Italy and central Europe, J. Geophys. Res., 110, D07208, doi:10.1029/2004JD005222, 2005.
Bessagnet, B., Hodzic, A., Vautard, R., Beekmann, M., Cheinet, S., Honor´e, C., Liousse, C., and Rouil, L.: Aerosol modeling with chimere-preliminary evaluation at the continental scale, Atmos. Environ., 38, 2803–2817, 2004.
Charlson, R. J., Hales, J. M., Cess, R. D., Coakley, J. A., Hansen, J. E., and Hofmann, D. J.: Climate forcing by anthropogenic aerosols, Science, 255, 423–430, 1992.
Drobinski, P., Said, F., Ancellet, G., Arteta, J., et al.: Re-gional transport and dilution during high-pollution episodes in southern France: Summary of findings from the Field Experi-ment to Constraint Models of Atmospheric Pollution and Emis-sions Transport (ESCOMPTE), J. Geophys. Res., 112, D13105, doi:10.1029/2006JD007494, 2007.
European Environment Agency: Spatial assessment of pm10 and ozone concentrations in europe (2005), in: Technical report no 1/2009, EEA (European Environment Agency), 2009.
Gariazzo, C., Silibello, C., Finardi, S., Radice, P., Piersanti, A., Calori, G., Cecinato, A., Perrino, C., Nussio, F., Cagnoli, M., Pelliccioni, A., Gobbi, G. P., and Di Filippo, P.: A gas/aerosol air pollutants study over the urban area of rome using a comprehen-sive chemical transport model, Atmos. Environ., 41, 7286–7303, 2007.
Gelbard, F. and Seinfeld, J. H.: Simulation of multicomponent aerosol dynamics, J. Colloid. Interf. Sci., 78, 485–501, 1980. Ilacqua, V., H¨anninen, O., Saarela, K., Katsouyanni, K., K¨unzli, N.,
and Jantunen, M.: Source apportionment of population represen-tative samples of pm2.5 in three european cities using structural equation modelling, Sci. Total. Environ., 384, 77–92, 2007. Kaur, S., Nieuwenhuijsen, M. J., and Colvile, R. N.: Fine
partic-ulate matter and carbon monoxide exposure concentrations in urban street transport microenvironments, Atmos. Environ., 41, 4781–4810, 2007.
Kavouras, I., Mihalopoulos, N., and Stephanou E.: Formation of at-mospheric particles from organic acids produced by forests, Na-ture, 395, 683–686, 1998.
Kulmala, M., Laaksonen, A., and Pirjola, L.: Parameterization for sulfuric acid / water nucleation rates, J. Geophys. Res., 103(D7), 8301–8307, 1998.
Larrieu, S., Jusot, J. F., Blanchard, M., Prouvos, H., Declercq, C., Fabre, P., Pascal, L., Le Tertre, A., Wagner, V., Rivi`ere, S., Chardon, B., Borelli, D., Cassadou, S., Eilstein, D., and Lefranc, A.: Short-term effects of air pollution on hospitalizations for car-diovascular diseases in eight french cities: The psas program, Sci. Total. Environ., 387, 105–112, 2007.
Lattuati, M.: Contribution `a l’´etude du bilan de l’ozone tro-posph´erique `a l’interface de l’europe et de l’atlantique nord: Mod´elisation lagrangienne et mesures en altitude, Th`ese de sci-ences, Paris 6, France, 1997.
Lonati, G. and Giugliano, M.: Size distribution of atmospheric par-ticulate matter at traffic exposed sites in the urban area of milan (Italy), Atmospheric Environment Particulate Matter Supersites Program and Related Studies, 40, 264–274, 2006.
Lyamani, H., Olmo, F. J., and Alados-Arboledas, L.: Saharan dust outbreak over southeastern spain as detected by sun photometer, Atmos. Environ., 39, 7276–7284, 2005.
Madronich, S., McKenzie, R. L., Bjorn, L. O., and Caldwell, M. M.: Changes in biologically active ultraviolet radiation reaching the Earth’s surface, J. Photochem. Photobiol. B:Biology, 46, 519, 1998.
Menut, L., Forˆet, G., and Bergametti, G.: Sensitivity of mineral dust concentrations to the model size distribution accuracy, J. Geo-phys. Res., 112, D10210, doi:10.1029/2006JD007766, 2007. Mitsakou, C., Kallos, G., Papantoniou, N., Spyrou, C., Solomos, S.,
Astitha, M., and Housiadas, C.: Saharan dust levels in Greece and received inhalation doses, Atmos. Chem. Phys., 8, 7181– 7192, 2008,
http://www.atmos-chem-phys.net/8/7181/2008/.
Mona, L., Amodeo, A., Pandolfi, M., and Pappalardo, G.: Sa-haran dust intrusions in the Mediterranean area : Three years of Raman lidar measurements, J. Geophys. Res., 111, D16203, doi:10.1029/2005JD006569, 2006.
Monn, C.: Exposure assessment of air pollutants: A review on spa-tial heterogeneity and indoor/outdoor/personal exposure to sus-pended particulate matter, nitrogen dioxide and ozone, Atmos. Environ., 35, 1–32, 2001.
Monteiro, A., Miranda, A. I., Borrego, C., Vautard, R., Ferreira, J., and Perez, A. T.: Long-term assessment of particulate matter using chimere model, Atmos. Environ., 41, 7726–7738, 2007. Moschandreas, D. J. and Saksena, S.: Modeling exposure to
partic-ulate matter, Chemosphere, 49, 1137–1150, 2002.
Pankow, J. F.: An absorption model of gas/particle partitioning of organic compounds in the atmosphere, Atmos. Environ., 28, 185–188, 1994.
Park, S. S. and Kim, Y. J.: Source contributions to fine particu-late matter in an urban atmosphere, Chemosphere, 59, 217–226, 2005.
Querol, X., Pey, J., Pandolfi, M., Alastuey, A., Cusack, M., P´erez N., Moreno, T., Viana, M., Mihalopoulos, N., Kallos, G., and Kleanthous, S.: African dust contributions to mean ambient PM10 mass-levels across the Mediterranean Basin, Atmos. En-viron., 43, 4266–4277, 2009.
Rodriguez, S., Querol, X., Alastuey, A., Kallos, G., and Kakaliagou, O.: Saharan dust contributions to PM10 and TSP levels in South-ern and EastSouth-ern Spain, Atmos. Environ., 35, 2433–2447, 2001. Rodr´ıguez, S., Querol, X., Alastuey, A., and Plana F.: Sources
and processes affecting levels and composition of atmo-spheric aerosol in the western Mediterranean, J. Geophys. Res., 107(D24), 4777, doi:10.1029/2001JD001488, 2002.
Salameh, T., Drobinski, P., Menut, L., Bessagnet, B., Flamant, C., Hodzic, A., and Vautard, R.: Aerosol distribution over the western Mediterranean basin during a Tramontane/Mistral event, Ann. Geophys., 25, 2271–2291, 2007,
http://www.ann-geophys.net/25/2271/2007/.
S´anchez, M. L., GarcI’a, M. A., P´erez, I. A., and de Torre, B.: Ground laser remote sensing measurements of a saharan dust out-break in central Spain. Influence on pm10 concentrations in the lower and upper spanish plateaus, Chemosphere, 67, 229–239, 2007.
Sartelet, K. N., Debry, E., Fahey, K., Roustan, Y., Tombette, M., and Sportisse, B.: Simulation of aerosols and gas-phase species over europe with the polyphemus system: Part i–model-to-data comparison for 2001, Atmos. Environ., 41, 6116–6131, 2007. Scoggins, A., Kjellstrom, T., Fisher, G., Connor, J., and Gimson, N.:
Spatial analysis of annual air pollution exposure and mortality, Sci. Total. Environ., 321, 71–85, 2004.
Stern, R., Builtjes, P., Schaap, M., Timmermans, R., Vautard, R., Hodzic, A., Memmesheimer, M., Feldmann, H., Renner, E., Wolke, R., and Kerschbaumer, A.: A model inter-comparison study focussing on episodes with elevated pm10 concentrations, Atmos. Environ., 42, 4567–4588, 2008.
Thorpe, A. J., Harrison, R. M., Boulter, P. G., and McCrae, I. S.: Estimation of particle resuspension source strength on a major london road, Atmos. Environ., 41, 8007–8020, 2007.
Thunis, P., Rouil, L., Cuvelier, C., Stern, R., Kerschbauler, A., Bessagnet, B., Schaap, M., Builtjes, P., Tarrason, L., Douros, J., Moussiopoulos, N., Pirovano, G., and Bedogni, M.: Analysis of model responses to emission-reduction scenarios within the citydelta project, Atmos. Environ., 41, 208–220, 2007.
Turpin, B., Saxena, J. P., and Andrews, E.: Measuring and sim-ulating particulate organics in the atmosphere: Problems and prospects, Atmos. Environ., 34, 2983–3013, 2000.
Vallius, M., Janssen, N. A. H., Heinrich, J., Hoek, G., Ruuskanen, J., Cyrys, J., Van Grieken, R., de Hartog, J. J., Kreyling, W. G., and Pekkanen, J.: Sources and elemental composition of ambient pm2.5 in three european cities, Sci. Total. Environ., 337, 147– 162, 2005.
Van Dingenen, R., Raes, F., Putaud, J.-P., Baltensperger, U., Char-ron, A., Facchini, M.-C., Decesari, S., Fuzzi, S., Gehrig, R., Hansson, H.-C., Harrison, R. M., H¨uglin, C., Jones, A. M., Laj, P., Lorbeer, G., Maenhaut, W., Palmgren, F., Querol, X., Ro-driguez, S., Schneider, J., Brink, H. T., Tunved, P., Tørseth, K., Wehner, B., Weingartner, E., Wiedensohler, A., and W˚ahlin, P.: A european aerosol phenomenology-1: Physical characteristics of particulate matter at kerbside, urban, rural and background sites in europe, Atmos. Environ., 38, 2561–2577, 2004. W˚ahlin, P., Berkowicz, R., and Palmgren, F.: Characterisation of
traffic-generated particulate matter in copenhagen, Atmos. Envi-ron., 40, 2151–2159, 2006.
Wesely, M. L.: Parameterization of surface resistances to gaseous dry deposition in regional-scale numerical models, Atmos. Env-iron., (1967), 23, 1293–1304, 1989.
Yatkin, S. and Bayram, A.: Elemental composition and sources of particulate matter in the ambient air of a metropolitan city, At-mos. Res., 85, 126–139, 2007.
Yttri, K.-E., Hanssen, J. E., Tsyro, S., Lazaridis, M., Facchini M. C., and Jennings, S. G.: Transboundary particulate matter in europe – status report 2005, in: Emep report 4/2005, edited by: Tørseth, K. E. Y. a. K., 2005.