ACPD
8, 15343–15373, 2008Elemental composition of
α-pinene SOA particles
J. E. Shilling et al.
Title Page
Abstract Introduction
Conclusions References
Tables Figures
◭ ◮
◭ ◮
Back Close
Full Screen / Esc
Printer-friendly Version
Interactive Discussion
Atmos. Chem. Phys. Discuss., 8, 15343–15373, 2008 www.atmos-chem-phys-discuss.net/8/15343/2008/ © Author(s) 2008. This work is distributed under the Creative Commons Attribution 3.0 License.
Atmospheric Chemistry and Physics Discussions
This discussion paper is/has been under review for the journalAtmospheric Chemistry and Physics (ACP). Please refer to the corresponding final paper inACPif available.
Loading-dependent elemental
composition of
α
-pinene SOA particles
J. E. Shilling1, Q. Chen1, S. M. King1, T. Rosenoern1, J. H. Kroll2, D. R. Worsnop2, P. F. DeCarlo3,4,*, A. C. Aiken4,5, D. Sueper2,4,5, J. L. Jimenez4,5, and S. T. Martin1,6
1
School of Engineering and Applied Sciences, Harvard University, Cambridge, MA 02138, USA
2
Aerodyne Research, Inc., Billerica, MA 08121, USA
3
Department of Atmospheric and Oceanic Sciences University of Colorado, Boulder, CO 80309, USA
4
Cooperative Institute for Research in the Environmental Sciences (CIRES), University of Colorado, Boulder, CO 80309, USA
5
Department of Chemistry and Biochemistry, University of Colorado, Boulder, CO 80309, USA
6
Department of Earth and Planetary Sciences, Harvard University, Cambridge, MA 02138, USA
ACPD
8, 15343–15373, 2008Elemental composition of
α-pinene SOA particles
J. E. Shilling et al.
Title Page
Abstract Introduction
Conclusions References
Tables Figures
◭ ◮
◭ ◮
Back Close
Full Screen / Esc
Printer-friendly Version
Interactive Discussion
* now at: Paul Scherrer Institut, Laboratory of Atmospheric Chemistry, Villigen-PSI, 5232, Switzerland
Received: 8 July 2008 – Accepted: 10 July 2008 – Published: 13 August 2008
Correspondence to: S. T. Martin (scot [email protected])
ACPD
8, 15343–15373, 2008Elemental composition of
α-pinene SOA particles
J. E. Shilling et al.
Title Page
Abstract Introduction
Conclusions References
Tables Figures
◭ ◮
◭ ◮
Back Close
Full Screen / Esc
Printer-friendly Version
Interactive Discussion
Abstract
The chemical composition of secondary organic aerosol (SOA) particles, formed by the dark ozonolysis ofα-pinene, was characterized by a high-resolution time-of-flight aerosol mass spectrometer. The experiments were conducted using a continuous-flow chamber, allowing the particle mass loading and chemical composition to be
main-5
tained for several days. The organic portion of the particle mass loading was varied from 0.5 to>140µg/m3by adjusting the concentration of reactedα-pinene from 0.9 to 91.1 ppbv. The mass spectra of the organic material changed with loading. For load-ings below 5µg/m3the unit-mass-resolution m/z44 signal intensity exceeded that of
m/z43, suggesting more oxygenated organic material at lower loadings. Composition
10
measurements displayed a greater dependence for lower loadings (0.5 to 15µg/m3) compared to higher loadings (15 to >140µg/m3). The high-resolution mass spec-tra showed that from>140 to 0.5µg/m3 the mass percentage of fragments contain-ing carbon and oxygen (CxHyO+z) monotonically increased from 48% to 54%. Cor-respondingly, the mass percentage of fragments representing CxH+y decreased from 15
52% to 46%, and the atomic oxygen-to-carbon ratio increased from 0.29 to 0.45. The atomic ratios were accurately parameterized by a four-product basis set of decadal volatility (viz. 0.1, 1.0, 10, 100µg/m3) employing products with the empirical formulas C1H1.32O0.48, C1H1.36O0.39, C1H1.57O0.24, and C1H1.76O0.14. These findings suggest considerable caution is warranted in the extrapolation of laboratory results that were
20
obtained under conditions of relatively high loading (i.e.,>15µg/m3) to modeling appli-cations relevant to the atmosphere, for which loadings of 0.1 to 20µg/m3 are typical. For the lowest loadings, the particle mass spectra resembled observations reported in the literature for some atmospheric particles.
ACPD
8, 15343–15373, 2008Elemental composition of
α-pinene SOA particles
J. E. Shilling et al.
Title Page
Abstract Introduction
Conclusions References
Tables Figures
◭ ◮
◭ ◮
Back Close
Full Screen / Esc
Printer-friendly Version
Interactive Discussion
1 Introduction
Atmospheric particles influence visibility, climate, and human health (Seinfeld and Pankow, 2003). For many clean and polluted environments, the organic fraction of these particles composes between 20 and 70% of the total non-refractory mass (Zhang et al., 2007). At present, however, the organic mass loading is underestimated in many
5
cases when the results of chemical transport models are compared to atmospheric measurements (Heald et al., 2005; Johnson et al., 2006; Volkamer et al., 2006). A significant fraction of this organic mass, balanced by primary emissions (POA), is as-sociated with secondary organic aerosol (SOA) production (Zhang et al., 2005a, b; Johnson et al., 2006; Takegawa et al., 2006; Volkamer et al., 2006; Zhang et al., 2007).
10
An improved quantitative and mechanistic understanding of the formation, the chem-istry, and the properties of SOA-bearing particles is therefore an important goal.
Chemical transport models widely employ semivolatile-partitioning theory (Pankow, 1994a, b) parameterizations of laboratory-measured SOA particle mass yield to predict atmospheric loadings (Chung and Seinfeld, 2002). Partitioning theory predicts organic
15
particle mass by consideration of the reversible absorption of semivolatile species. A molecule found both in the gas and particle phases of an aerosol increasingly partitions into the latter for higher mass loadings of organic particles. Moreover, species having lower vapor pressures in pure form partition to a greater extent to the particle phase, at least for most cases in which activity-based corrections are minor (Bowman and
20
Karamalegos, 2002).
There may be several reasons for the differences between observations and model predictions (Heald et al., 2005; Johnson et al., 2006; Volkamer et al., 2006). Presto and Donahue (2006) emphasized that the parameterizations used in chemical transport models for SOA particle mass yield require significant extrapolations from laboratory
25
ACPD
8, 15343–15373, 2008Elemental composition of
α-pinene SOA particles
J. E. Shilling et al.
Title Page
Abstract Introduction
Conclusions References
Tables Figures
◭ ◮
◭ ◮
Back Close
Full Screen / Esc
Printer-friendly Version
Interactive Discussion
and found that particle mass yields were higher than predicted even by Presto and Donahue (2006). Some reconciliation between models and observations is therefore possible using these updated laboratory results.
In the framework of partitioning theory, the higher yields measured in the labora-tory suggest the formation of molecules of lower vapor pressure than expected from
5
gas-phase chemistry mechanisms (Jenkin, 2004). Alternatively, the higher yields sug-gest that a simplified mechanism of SOA formation, specifically gas-phase production of semivolatile species followed by partitioning, may be inadequate. Insights into and constraints on these possibilities can be expected from laboratory studies that char-acterize SOA particle chemical composition at mass loadings similar to those of the
10
atmosphere. The inaccuracy associated with extrapolations of particle yield to low loadings suggests that changes in chemical composition can also be expected as yield is governed by composition through volatility. Measurements under these conditions can provide insights into SOA particle production and subsequent transformation and aging.
15
In this work, the chemical composition of SOA particles is characterized using an Aerodyne high-resolution time-of-flight aerosol mass spectrometer (HR-ToF-AMS). The SOA is formed by the dark ozonolysis of α-pinene using the continuous-flow mode of the Harvard Environmental Chamber. Although past studies have reported on the AMS mass spectra ofα-pinene SOA, they have done so only for high organic loadings
20
(>15µg/m3) and at unit-mass resolution (Bahreini et al., 2005; Alfarra et al., 2006; Zhang et al., 2006; Song et al., 2007). For the measurements described herein, organic particle mass loadings from 0.5 to >140µg/m3 are employed. Moreover, the high-resolution mode of the AMS can distinguish the relative contributions by the CxHyO+z and CxH+y families to the organic particle mass, which allows atomic O/C and H/C ratios 25
to be determined. The experimental strategy is to systematically vary the mass loading while other reaction conditions, such as the aging time and the oxidant concentration, are left unchanged among experiments. The gas-phase reaction products predicted by the Leeds Master Chemical Mechanism (MCM v3.1) (Saunders et al., 2003) are similar
ACPD
8, 15343–15373, 2008Elemental composition of
α-pinene SOA particles
J. E. Shilling et al.
Title Page
Abstract Introduction
Conclusions References
Tables Figures
◭ ◮
◭ ◮
Back Close
Full Screen / Esc
Printer-friendly Version
Interactive Discussion
among experiments (Table 1), and any changes in the particle organic composition for increasing loading can therefore be interpreted as primarily due to the increasing partitioning of semivolatile molecules into the particle phase.
2 Experimental
Secondary organic aerosol was generated from the dark ozonolysis of 0.9 to 91.1 ppbv
5
ofα-pinene in the Harvard Environmental Chamber (HEC). The HEC, consisting of a 4.7 m3 PFA Teflon bag housed in a temperature-controlled room, was described pre-viously (King et al., 2007; Shilling et al., 2008). For the experiment described in this paper, reaction conditions were 25◦C, 40% RH, solid (NH4)2SO4seed particles, excess 1-butanol as an OH scavenger (0.94 to 95 ppmv), and 300 ppbv O3. The molar ratio of 10
1-butanol toα-pinene was held at a constant value of 1040 in all experiments.
The chamber was operated in a continuous-flow mode, for which the input flow of reactants was balanced by exhaust and sampling outflow (Kleindienst et al., 1999; Se-infeld et al., 2003; King et al., 2007; Shilling et al., 2008). After an initial transient period of 12 to 24 h, reactants and products reached their steady-state chemical
com-15
position, and an experiment was run for several days at a specific inflow concentration ofα-pinene while data were recorded. The total flow rate of 21.1 sLpm through the chamber corresponded to a mean residence time of 3.4 h. Humidity and ozone were maintained at constant levels using feedback controls.
During the course of the experiments, the chamber was periodically cleaned,
espe-20
cially before conducting experiments for the lowest SOA mass loadings, by exposure to ozone concentrations of ca. 1 ppmv for at least 24 h at 40◦C, followed by flushing with clean air for several hours. Following cleaning, particle concentrations in the chamber were below 5 cm−3.
An Aerodyne HR-ToF AMS was used to measure the organic particle mass
load-25
ACPD
8, 15343–15373, 2008Elemental composition of
α-pinene SOA particles
J. E. Shilling et al.
Title Page
Abstract Introduction
Conclusions References
Tables Figures
◭ ◮
◭ ◮
Back Close
Full Screen / Esc
Printer-friendly Version
Interactive Discussion
AMS, which ranged from 0.5 to >140µg/m3, agreed with density-compensated vol-ume loading measured using a scanning mobility particle sizer (SMPS) (Shilling et al., 2008). In the experimental protocol, the AMS alternated every 10 to 30 min between (i) a high-resolution “W-” mode having a resolution of∼5200 and (ii) a higher sensi-tivity, lower resolution “V-” mode having a resolution of ∼2400. Within the V-mode,
5
the instrument ran in mass spectrum (MS) and particle-time-of-flight (PToF) submodes for equal time periods (Jayne et al., 2000; Jimenez et al., 2003). The PToF mode, which classified mass spectra by vacuum aerodynamic diameter, was employed to dis-tinguish between the gas- and particle-phase contributions of some organic ions (viz,
m/z28, 29, 40, and 44). Mass spectra at loadings below 5µg/m3were placed into
10
several bins according toα-pinene precursor concentration and averaged within a bin as an approach for decreasing the interference effects of variable gas-phase CO2.
A fragmentation table was used to deconvolute the V-mode mass spectra into or-ganic, sulfate, ammonium, and air components (Allan et al., 2004). Only the organic component is shown in the mass spectra presented in this paper. W-mode spectra
15
were analyzed with additional software for fitting the high-resolution peaks (DeCarlo et al., 2006). Based on observations made for the high-loading experiments, the particle-phase signal intensity at m/z28 (from CO+) was calculated as 1.075 times that of the particle-phase CO+2 signal (m/z44). This value was similar to values of 1–1.25 reported by Zhang et al. (2005b), DeCarlo et al. (2006), and Takegawa et al. (2007)
20
for ambient particles. The signal intensities of HxO+ fragments from organic species atm/z16, 17, and 18 were estimated as described in Aiken et al. (2008). During the course of an experiment, no significant changes in the organic mass spectra of the particles were observed once the chamber reached a steady state.
ACPD
8, 15343–15373, 2008Elemental composition of
α-pinene SOA particles
J. E. Shilling et al.
Title Page
Abstract Introduction
Conclusions References
Tables Figures
◭ ◮
◭ ◮
Back Close
Full Screen / Esc
Printer-friendly Version
Interactive Discussion
3 Results and discussion
3.1 Low-resolution mass spectra
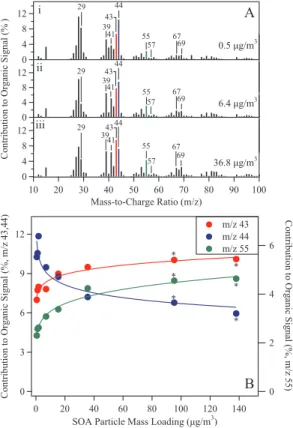
Figure 1A shows the mass spectra at unit mass resolution (UMR) of α-pinene SOA particles for loadings of 0.5, 6.4, and 36.8µg/m3. The most intense peaks oc-cur at m/z28 (CO+, C2H+4), 29 (CHO
+, C
2H+5), 39 (C3H+3), 41 (C2HO+, C3H+5), 43 5
(C2H3O+, C3H+7), 44 (CO+2, C2H4O+), and 55 (C3H3O+, C4H+7). Inspection of pan-els i to iii shows that the percent contributions by the different m/zsignals vary with loading. The percent contributions of m/z43, 44, and 55 (e.g., 43/org) are shown in Fig. 1B for decreasing loading. The contribution at m/z43 decreases from 10 to 7% as the loading drops from >140 to 0.5µg/m3. In comparison, the
contribu-10
tion at m/z44 increases from 6 to 12%. The implication is that the ratio of the signal intensities at m/z44 and 43, which is an indicator of the oxygen content of the particles (Figs. S1, S2 http://www.atmos-chem-phys-discuss.net/8/15343/2008/ acpd-8-15343-2008-supplement.pdf), decreases for greater organic mass loadings. In agreement, the intensities atm/z55, 57, 67, and 69, which are typically associated
15
with more reduced species and anti-correlate with the oxygen-to-carbon ratio (Fig. S1), increase for greater organic mass loadings.
For allm/zvalues, the percent contributions by differentm/zvalues change mono-tonically with increasing loading. The relative changes are larger for low (<15µg/m3) compared to high loadings (Fig. 1B). In light of this finding, extrapolation may be
in-20
appropriate for laboratory results that were obtained under conditions of relatively high loading (i.e.,>15µg/m3) to modeling applications relevant to the atmosphere, for which loadings of 0.1 to 20µg/m3are typical.
Across all experimental conditions, 5 to 7% of the organic signal intensity occurs form/z>100, with no systematic dependence on loading. These observations,
how-25
compari-ACPD
8, 15343–15373, 2008Elemental composition of
α-pinene SOA particles
J. E. Shilling et al.
Title Page
Abstract Introduction
Conclusions References
Tables Figures
◭ ◮
◭ ◮
Back Close
Full Screen / Esc
Printer-friendly Version
Interactive Discussion
son, ambient OOA in Pittsburg has 3.6% of the signal beyondm/z100 (Zhang et al., 2005b, c).
The mass spectra shown in Fig. 1A can be compared to several SOA particle mass spectra collected in other environmental chambers for the dark ozonolysis ofα-pinene (Bahreini et al., 2005; Alfarra et al., 2006; Song et al., 2007). The mass spectrum of
5
panel iii is collected for a loading similar to those of the other chamber studies and is similar to the spectra reported therein. Specifically, the relative intensities of the major peaks (i.e.,m/z, 29, 41, 43, 44, 55 and 57) are similar to those reported for the other chambers. Panels i and ii at lower loadings, however, present spectra unlike those published in the literature. These spectra at low loading show that the contribution by
10
m/z44 exceeds that ofm/z43, thus implying that the organic mass at lower loading has an increased oxygen-to-carbon ratio compared to the higher loading of panel iii and of the other chamber studies. This increased oxygen-to-carbon ratio brings into better agreement the mass spectra observed in this chamber study at low loading with some of those collected in the ambient atmosphere (Sect. 4).
15
For further comparison, literature chamber studies operated in batch mode demon-strated that the percent contribution atm/z44 of SOA organic particle mass was higher at the beginning stages of measurements than later in the experiment (Bahreini et al., 2005; Baltensperger et al., 2005; Zhang et al., 2006; Duplissy et al., 2008). The early stages of batch-mode experiments correspond to conditions of low organic particle
20
mass loading, with higher loadings at later stages. In these batch-mode experiments, the gas-phase chemistry was rapidly changing during the initial stages of oxidation (cf. Fig.6 of Shilling et al., 2008) and consequently the mass spectra were evolving in time. In comparison, for the present experiments under the steady-state conditions of the continuous-flow chamber, the gas-phase product distribution calculated with the
25
MCM was similar at all loadings (Table 1), and the mass spectra did not change during the course of an experiment. The results of the experiments reported in the literature for batch mode and our findings obtained in continuous mode both affirm that SOA particles at low loadings are more oxygenated than at higher loadings.
ACPD
8, 15343–15373, 2008Elemental composition of
α-pinene SOA particles
J. E. Shilling et al.
Title Page
Abstract Introduction
Conclusions References
Tables Figures
◭ ◮
◭ ◮
Back Close
Full Screen / Esc
Printer-friendly Version
Interactive Discussion
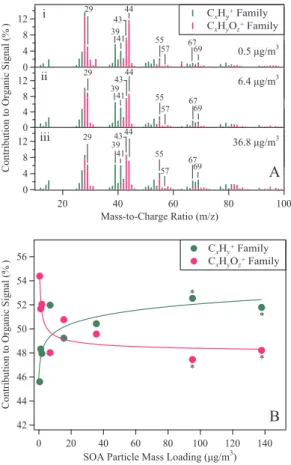
3.2 High-resolution mass spectra
Ions having the same nominal m/zvalue at unit-mass resolution can be separately identified and quantified in the high-resolution mass spectra (McLafferty and Turecek, 1993; DeCarlo et al., 2006). Examples at nominalm/z43 include C3H+7 (43.055) and C2H3O+ (43.018). The HR-ToF-AMS has sufficient spectral resolution to distinguish 5
CxH+y from CxHyO+z and other ions at the same nominal m/zvalue but having dif-ferent numbers of H atoms (Fig. S3). Figure 2A shows the percent contribution of each type of ion for the same mass spectra as shown in Fig. 1A. The total signal in-tensity arising from the sum of each type of ion quantifies the so-called “CxH+y” and “CxHyO+z” families (DeCarlo et al., 2006). Figure 2B shows this analysis for increasing
10
mass loading. These high-resolution results, in agreement with the UMR results of Fig. 1B, show that the greatest variability in chemical composition occurs for low par-ticle loadings (<15µg/m3). Figure 2B also shows that the organic material becomes less oxygenated for greater loadings, thus reinforcing the interpretation of Fig. 1 that the molecules partitioning into the particle phase at lower loadings are more oxygenated
15
than those partitioning at higher loadings, as might be expected from structure-activity relationships of vapor pressure for organic molecules (Pankow and Asher, 2008).
The oxygen-to-carbon (O/C) and hydrogen-to-carbon (H/C) atomic ratios can be cal-culated from an analysis of the signal intensities and elemental compositions of the CxH+y and CxHyO+z ions (Aiken et al., 2007, 2008). An experimentally determined cali-20
bration factor, which accounts for biases in ion fragmentation, is applied to the summed signals to obtain the reported O/C and H/C atomic ratios (Aiken et al., 2008). Figure 3 shows that the O/C atomic ratio decreases from 0.45 to 0.38 as the particle loading increases from 0.5 to 15µg/m3. The ratio changes more slowly for greater loadings, reaching a final value of 0.29 for the highest loadings. Conversely, the H/C atomic ratio
25
increases from 1.38 to 1.51 as the loading increases.
ozonol-ACPD
8, 15343–15373, 2008Elemental composition of
α-pinene SOA particles
J. E. Shilling et al.
Title Page
Abstract Introduction
Conclusions References
Tables Figures
◭ ◮
◭ ◮
Back Close
Full Screen / Esc
Printer-friendly Version
Interactive Discussion
ysis of α-pinene for a peak mass loading of 500µg/m3 and reported an O/C ratio of 0.27. This value is comparable to our value of 0.29 determined for a loading of
>140µg/m3. Aiken et al. (2008) further reported O/C ratios of 0.27 to 0.43 for load-ings of 50 to 100µg/m3 for SOA particles produced in the chamber from other an-thropogenic and biogenic precursors during full photochemistry (i.e., NOx, OH, and 5
UV light). For ground and aircraft observations in Mexico City during MILAGRO, com-ponent mass spectra of HOA, OOA-I, and OOA-II were obtained by positive matrix multifactor analysis (Aiken et al., 2008). On the ground, HOA, OOA-I, and OOA-II had O/C ratios of 0.10, 0.83, and 0.52, respectively, and the corresponding values from the aircraft observations were 0.06, 1.02, and 0.64. Our O/C ratio measurements,
rang-10
ing from 0.29 to 0.45, best overlap with OOA-II. This component has been ascribed to “fresh” SOA particles and therefore might be considered comparable to our study in an environmental chamber, although biogenic precursors were used by us whereas Mexico City represents a heavily polluted, anthropogenically-influenced airshed.
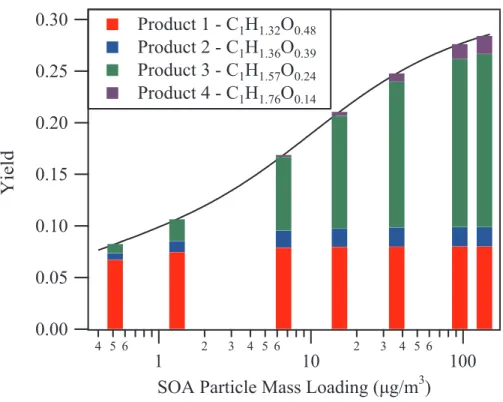
3.3 Chemically-resolved Partitioning
15
A view on chemically-resolved gas-particle partitioning can be obtained from the high-resolution mass spectra. Figure 4 shows a basis-set fit using decadal volatility for four model products (Donahue et al., 2006). At each loading, the overall bar height shows the mass yield predicted from the basis-set fit of the yield data (Shilling et al., 2008). An individual bar is color-coded by the relative contribution of each model product to
20
the yield. The empirical formulas of the basis-set products normalized to one carbon atom are provided in the legend.
The empirical formulas (O/C)i and (O/C)i of the basis-set products i are related to (O/C)j and (H/C)j measured at each mass loadingj, as follows.
(O/C)j=
P
i
fi ,jλi(O/C)i
P
i
fi ,jλi ,(H/C)j=
P
i
fi ,jλi(H/C)i
P
i
fi ,jλi (1)
25
ACPD
8, 15343–15373, 2008Elemental composition of
α-pinene SOA particles
J. E. Shilling et al.
Title Page
Abstract Introduction
Conclusions References
Tables Figures
◭ ◮
◭ ◮
Back Close
Full Screen / Esc
Printer-friendly Version
Interactive Discussion
whereλi is the carbon molinity, defined as the moles of carbon of producti per kilo-gram of producti. In the case of SOA particles of composition CxHyOz and no other elements, we can writeλi=1000/(12+(H/C)i+16 (O/C)i).
The mass fractionfi ,j is obtained from the four-product basis-set parameterization of yield, as follows. The particle-phase partial mass yieldξi ,j of producti at loading Cj 5
(µg/m3) is given byξi ,j =αi(1+Ci∗
Cj)−1, whereCi∗∈{10−1, 100, 101, 102µg/m3}and
αi is the ozonolysis mass yield (gas +particle) of producti (Table 2). The observed yieldYj is then given byYj=Σiξi ,j. At a loadingCj, the relative concentration of product
i in the particle-phase on a mass-fraction basis then follows:
fi ,j =ξi ,j 4
X
i=1
ξi ,j
!−1
(2)
10
For fixed mass loading, the relative bar heights in Fig. 4 correspond to the relative values offi.
Equation 1 thus constitutes a system of 2j (14) simultaneous equations and 2i (8) variables. The empirical formulas shown in Table 2 result from their solution, when subject to the constraints 0<(O/C)i<1 and 1<(H/C)i<2. From low to high volatility, 15
the empirical formulas are as follows: C1H1.32O0.48, C1H1.36O0.39, C1H1.57O0.24, and C1H1.76O0.14. Comparisons between measurements and the optimized solution of Eq 1 are shown by the data points and the solid lines in Fig. 3, respectively.
The O/C and H/C atomic ratios of the basis-set products can be compared to those expected for the major particle-phase molecular products identified for the dark
ozonol-20
ysis ofα-pinene (Jang and Kamens, 1999; Yu et al., 1999). Those products include norpinic acid and its isomers (C8H12O4, H/C: 1.5, O/C: 0.5), pinic acid (C9H14O4, H/C: 1.56, O/C: 0.44), pinonic acid (C10H16O3, H/C: 1.6, O/C: 0.33), hydroxy pinonalde-hydes (C10H16O3, H/C: 1.6, O/C: 0.33), norpinaldehyde (C9H14O2, H/C: 1.56, O/C: 0.22), and pinonaldehyde (C10H16O2, H/C: 1.6, O/C: 0.2). The O/C atomic ratios of 25
ACPD
8, 15343–15373, 2008Elemental composition of
α-pinene SOA particles
J. E. Shilling et al.
Title Page
Abstract Introduction
Conclusions References
Tables Figures
◭ ◮
◭ ◮
Back Close
Full Screen / Esc
Printer-friendly Version
Interactive Discussion
the expected range of O/C ratios based on the experimentally identified particle-phase molecular products.
In comparison, the H/C atomic ratios of the products identified in literature range from 1.5 to 1.6 compared to 1.32 to 1.75 for the four basis-set products. The lowest volatility products (viz. i=1 and 2 of Table 2) are therefore depleted in hydrogen compared to
5
the identified particle-phase molecular products. An explanation could be the formation of longer carbon-chain products, such as oligomers (Gao et al., 2004; Kalberer et al., 2004; Tolocka et al., 2004) or organic peroxides (Docherty et al., 2005), that shift the H/C ratio without greatly affecting the O/C ratio.
The empirical formulas of Table 2 are on a one-carbon basis, but many of the known
10
particle-phase molecular products (such as norpinic acid, pinic acid, pinonic acid, hy-droxy pinonaldehydes, norpinaldehyde, and pinonaldehyde) are C8to C10compounds. For purpose of development, we can then assume that the empirical formulas of Ta-ble 2 correspond to the molecular formulas on a C9 basis: C9H11.9O4.3, C9H12.2O3.5, C9H14.1O2.2, and C9H15.8O1.3. On this basis, each product of decadal volatility differs 15
from the next by approximately one oxygen atom. In agreement, the group-contribution method estimates that the addition of one carbonyl group reduces the vapor pressure of an aliphatic compound by a decade (Kroll and Seinfeld, 2008; Pankow and Asher, 2008).
The vapor pressures of the known particle-phase molecular products can be
com-20
pared to the decadal vapor pressures used in the basis-set fitting. Pinic acid, for ex-ample, has a vapor pressure of 2.4µg/m3 and is the least volatile monomer product identified in the literature (Bilde and Pandis, 2001). This vapor pressure is 24 times greater than 0.1µg/m3 of C1∗, implying that unidentified products with lower volatility than pinic acid compose a significant fraction of the particle-phase mass at the lowest
25
loadings. One possibility suggested in the literature is oligomer or peroxide formation (Gao et al., 2004; Kalberer et al., 2004; Tolocka et al., 2004; Docherty et al., 2005). This hypothesis is consistent with the observed O/C atomic ratios (vida supra). In fur-ther comparison, the vapor pressure of cis-pinonic acid (5.2µg/m3; Bilde and Pandis,
ACPD
8, 15343–15373, 2008Elemental composition of
α-pinene SOA particles
J. E. Shilling et al.
Title Page
Abstract Introduction
Conclusions References
Tables Figures
◭ ◮
◭ ◮
Back Close
Full Screen / Esc
Printer-friendly Version
Interactive Discussion
2001) is in the approximate range of product 3 (C∗3=10µg/m3). cis-Pinonic acid has O/C and H/C atomic ratios similar to those of product 3. Full agreement, however, is not found in all comparisons. Although the O/C and H/C atomic ratios of pinonalde-hyde agree well with those of product 4, the vapor pressure of former (3.5×10⁵µg/m3; Hallquist et al., 1997) is 1000-fold higher than that of the latter (C4∗=100µg/m3).
5
In summary, particle composition was successfully correlated with relative vapor pressure trends; however, comparisons of parameterized volatility with measured va-por pressures of products displayed marked variability despite the agreement between parameterized composition and the composition of known products.
3.4 Density
10
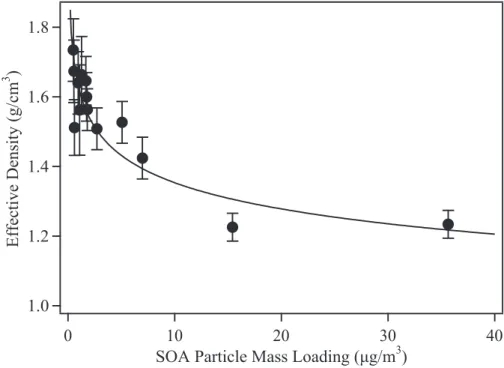
Given that the organic material of the SOA particles is increasingly oxygenated for lower loadings, a reasonable expectation is that the organic density should likewise increase. Figure 6 shows that the effective organic density is 1.73±0.13 g/cm3 for a loading of 0.46µg/m3 but decreases to 1.42±0.06 g/cm3for a loading of 7µg/m3 and to 1.23±0.04 g/cm3 for loadings of 15.9µg/m3 and greater (DeCarlo et al., 2004;
Ka-15
trib et al., 2005). The uncertainty of ±0.13 for the measured density of 1.73 g/cm3 at 0.46µg/m3 is relatively high because the low organic mass loading and the corre-spondingly high relative inorganic mass loading of seed particles affect the accuracy of the analysis. Other workers report densities of 1.19 to 1.52 g/cm3for organic load-ings of 5 to 220µg/m3 for SOA particles formed by the dark ozonolysis of α-pinene
20
(Gao et al., 2004; Bahreini et al., 2005; Kostenidou et al., 2007; Song et al., 2007), in agreement with the densities determined in this study at loadings greater than 7µg/m3. In the laboratory and the field, accurate measurements of organic density are es-sential for conversion of SMPS measurements of a volume concentration to a mass loading. In addition, parameterizations employed in chemical transport models for
par-25
or-ACPD
8, 15343–15373, 2008Elemental composition of
α-pinene SOA particles
J. E. Shilling et al.
Title Page
Abstract Introduction
Conclusions References
Tables Figures
◭ ◮
◭ ◮
Back Close
Full Screen / Esc
Printer-friendly Version
Interactive Discussion
ganic particle mass loading.
4 Conclusions and atmospheric implications
The chemical composition of SOA particles produced from the dark ozonolysis ofα -pinene was characterized for increasing organic particle mass loading. The gas-phase chemistry and the aging of the aerosol were constant across experiments, thus
iso-5
lating the effects of gas-particle partitioning from other processes. The particle mass spectra depended on the organic loading, and an analysis of the high-resolution mass spectra showed that the organic particle mass became increasingly oxygenated for lower loadings. The changes in the particle composition were most sensitive to load-ing from 0.5 to 15µg/m3, with smaller changes in composition for loadings from 15
10
to >140µg/m3. The chemical composition for variable loading, expressed as O/C and H/C atomic ratios, was accurately parameterized with four basis-set products of decadal volatility.
The increase in the O/C atomic ratio for lower mass loadings and the corresponding decrease in the H/C ratio can be rationalized in large part by the variable partitioning
15
of semivolatile molecules into the particle phase. In favor of this explanation compared to others, such as particle-phase reactive chemistry, is that the modeled gas-phase chemistry (Table 1) and the residence time in the chamber are nearly identical in all experiments. At low loadings (implying low vapor pressures), the increase of the O/C ratio is consistent with the expected structure-activity correlation between increases
20
in oxygen-bearing functional groups and reductions in vapor pressure (Pankow and Asher, 2008). Nevertheless, the possibilities of second-order gas-phase reactions or heterogeneous chemistry cannot be completely excluded as contributors. To consider the possibility of changed gas-phase chemistry in more detail, we use the MCM model v3.1 to investigate possible differences in the gas-phase chemistry due to second-order
25
radical reactions (Saunders et al., 2003). Table 1 shows the product distribution for sim-ulations run at 0.9, 6.7, and 91.1 ppbv ofα-pinene. The relative distributions of stable
ACPD
8, 15343–15373, 2008Elemental composition of
α-pinene SOA particles
J. E. Shilling et al.
Title Page
Abstract Introduction
Conclusions References
Tables Figures
◭ ◮
◭ ◮
Back Close
Full Screen / Esc
Printer-friendly Version
Interactive Discussion
products, such as pinic acid, hydroxy pinic acid, pinonaldehyde, and norpinaldehyde, are similar among the three simulations. Although there is some variation in the relative distribution of the peroxy radicals and the peroxides (with the C10 species having the largest variability), the variation appears too small to explain the measured changes in the chemical composition of the particles with loading.
5
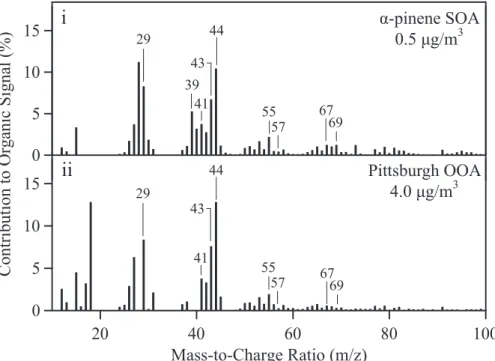
The mass spectra obtained at low loadings in this study compare favorably to those observed at times in the ambient environment. Figure 6 shows a comparison of the spectrum collected at 0.5µg/m3 to a representative OOA spectrum collected in Pitts-burgh, USA, in September 2002 by Zhang et al. (2005b), during which time the average organic mass loading was 4µg/m3. The relative heights of the prominent peaks are
10
similar in the two spectra, in particular the ratio of the signal intensities atm/z43 and 44. This ratio is an indicator of oxidation state (cf. Figs. S1, S2).
Figure 6 shows that the mass spectra collected in a laboratory environmental cham-ber for a biogenic precursor can be similar to those collected for ambient particles provided that laboratory measurements are carried out at mass loadings similar to
15
those occurring in the atmosphere. Regarding anthropogenic precursors, Bahreini et al. (2005) and Robinson et al. (2007) showed that the mass spectra of SOA particles generated in an environmental chamber also can be similar to atmospheric observa-tions. When taken together, the implication of those studies and ours is that the dif-ferences in AMS spectra at unit mass resolution of SOA particles generated from
bio-20
genic and anthropogenic precursors are not large. Therefore, in a regulatory context the attribution from mass spectra alone (e.g., by factor analysis) of biogenic compared to anthropogenic SOA particle mass and hence source controls must be approached cautiously (Zhang et al., 2005a, b; Marcolli et al., 2006; Lanz et al., 2007; Lanz et al., 2008; Ulbrich et al., 2008). In particular, the library mass spectra to which results
25
from factor analysis are compared must be collected under conditions similar to those occurring in the atmosphere.
ACPD
8, 15343–15373, 2008Elemental composition of
α-pinene SOA particles
J. E. Shilling et al.
Title Page
Abstract Introduction
Conclusions References
Tables Figures
◭ ◮
◭ ◮
Back Close
Full Screen / Esc
Printer-friendly Version
Interactive Discussion
of field data and guiding regulatory development. Moreover, the empirical formulas can be compared to classically identified particle-phase products as an overall constraint on chemical closure, both for field and chamber measurements. In the future, chemical transport models of SOA formation and aging may be capable of including chemically resolved information (based on the laboratory findings) for further comparison to
atmo-5
spheric measurements.
Acknowledgements. This material is based upon work supported by the National Science Foundation under Grant No. ATM-0513463. The development of the method for quantifying O/C and H/C was supported by NSF grant ATM-0449815 and EPA grant STAR-RD-83216101-0. This paper has not been reviewed by any funding agency and thus any opinions, findings, 10
and conclusions or recommendations expressed in this material are those of the authors and do not necessarily reflect the views of the NSF or the EPA. SMK and PFD acknowledge support from the EPA STAR fellowship program. TR acknowledges support from the Danish Agency for Science Technology and Innovation under Grant No. 272-06-0318. QC and ACA acknowledge support from the NASA ESS fellowship program.
15
ACPD
8, 15343–15373, 2008Elemental composition of
α-pinene SOA particles
J. E. Shilling et al.
Title Page
Abstract Introduction
Conclusions References
Tables Figures
◭ ◮
◭ ◮
Back Close
Full Screen / Esc
Printer-friendly Version
Interactive Discussion
References
Aiken, A. C., DeCarlo, P. F., and Jimenez, J. L.: Elemental analysis of organic species with electron ionization high-resolution mass spectrometry, Anal. Chem., 79, 8350–8358, 2007.
Aiken, A. C., DeCarlo, P. F., Kroll, J. H., Worsnop, D. R., Huffman, J. A., Docherty, K., Ulbrich,
I. M., Mohr, C., Kimmel, J. R., Sueper, D., Zhang, Q., Sun, Y., Trimborn, A., Northway, M., 5
Ziemann, P. J., Canagaratna, M. R., Alfarra, R., Prevot, A. S. H., Dommen, J., Duplissy, J., Metzger, A., Baltensperger, U., and Jimenez, J. L.: O/C and OM/OC ratios of primary, secondary, and ambient organic aerosols with high resolution time-of-flight aerosol mass spectrometry, Environ. Sci. Technol., 42, 4478–4485, 2008.
Alfarra, M. R., Paulsen, D., Gysel, M., Garforth, A. A., Dommen, J., Prevot, A. S. H., Worsnop, 10
D. R., Baltensperger, U., and Coe, H.: A mass spectrometric study of secondary organic aerosols formed from the photooxidation of anthropogenic and biogenic precursors in a re-action chamber, Atmos. Chem. Phys., 6, 7747–7789, 2006,
http://www.atmos-chem-phys.net/6/7747/2006/.
Allan, J. D., Coe, H., Bower, K. N., Alfarra, M. R., Delia, A. E., Jimenez, J. L., Middlebrook, 15
A. M., Drewnick, F., Onasch, T. B., Canagaratna, M. R., Jayne, J. T., and Worsnop, D. R.: Technical note: Extraction of chemically resolved mass spectra from Aerodyne aerosol mass spectrometer data, J. Aerosol Sci., 35, 909–922, 2004.
Bahreini, R., Keywood, M. D., Ng, N. L., Varutbangkul, V., Gao, S., Flagan, R. C., Seinfeld, J. H., Worsnop, D. R., and Jimenez, J. L.: Measurement of secondary organic aerosol from oxida-20
tion of cycloalkenes, terpenes, and m-xylene using an Aerodyne aerosol mass spectrometer, Environ. Sci. Technol., 39, 5674–5688, 2005.
Baltensperger, U., Kalberer, M., Dommen, J., Paulsen, D., Alfarra, M. R., Coe, H., Fisseha, R., Gascho, A., Gysel, M., Nyeki, S., Sax, M., Steinbacher, M., Prevot, A. S. H., Sjogren, S., Weingartner, E., and Zenobi, R.: Secondary organic aerosols from anthropogenic and 25
biogenic precursors, Faraday Discuss., 130, 265–278, 2005.
Bilde, M. and Pandis, S. N.: Evaporation rates and vapor pressures of individual aerosol species formed in the atmospheric oxidation of alpha- and beta-pinene, Environ. Sci. Tech-nol., 35, 3344–3349, 2001.
Bowman, F. M. and Karamalegos, A. M.: Estimated effects of composition on secondary
or-30
ganic aerosol mass concentrations, Environ. Sci. Technol., 36, 2701–2707, 2002.
ACPD
8, 15343–15373, 2008Elemental composition of
α-pinene SOA particles
J. E. Shilling et al.
Title Page
Abstract Introduction
Conclusions References
Tables Figures
◭ ◮
◭ ◮
Back Close
Full Screen / Esc
Printer-friendly Version
Interactive Discussion
T. B., Drewnick, F., Coe, H., Middlebrook, A., Delia, A., Williams, L. R., Trimborn, A. M., Northway, M. J., DeCarlo, P. F., Kolb, C. E., Davidovits, P., and Worsnop, D. R.: Chemi-cal and microphysiChemi-cal characterization of ambient aerosol with the Aerodyne aerosol mass spectrometer, Mass. Spectrom. Rev., 26, 185–222, 2007.
Chung, S. H. and Seinfeld, J. H.: Global distribution and climate forcing of carbonaceous 5
aerosols, J. Geophys. Res., 107, 4407, 2002.
DeCarlo, P., Slowik, J., Worsnop, D., Davidovits, P., and Jimenez, J.: Particle morphology and density characterization by combined mobility and aerodynamic diameter measurements, Part 1: Theory, Aerosol Sci. Technol., 38, 1185–1205, 2004.
DeCarlo, P. F., Kimmel, J. R., Trimborn, A., Jayne, J. T., Aiken, A. C., Gonin, M., Fuhrer, K., 10
Horvath, T., Docherty, K. S., Worsnop, D. R., and Jimenez, J. L.: A field-deployable high-resolution time-of-flight aerosol mass spectrometer, Anal. Chem., 78, 8281–8289, 2006. Docherty, K. S., Wu, W., Lim, Y. B., and Ziemann, P. J.: Contributions of organic peroxides to
secondary aerosol formed from reaction of monoterpenes with O3, Environ. Sci. Technol.,
39, 4049–4059, 2005. 15
Donahue, N. M., Robinson, A. L., Stanier, C. O., and Pandis, S. N.: The coupled partitioning, dilution, and chemical aging of semivolatile organics, Environ. Sci. Technol., 40, 2635–2643, 2006.
Duplissy, J., Gysel, M., Alfarra, M. R., Dommen, J., Metzger, A., Prevot, A. S. H., Weingart-ner, E., Laaksonen, A., Raatikainen, T., Good, N., TurWeingart-ner, S. F., McFiggans, G., and Bal-20
tensperger, U.: The cloud forming potential of secondary organic aerosol under near atmo-spheric conditions, Geophys. Res. Lett., 35, L03818, doi:10.1029/2007GL031075, 2008. Gao, S., Keywood, M., Ng, N. L., Surratt, J., Varutbangkul, V., Bahreini, R., Flagan, R. C.,
and Seinfeld, J. H.: Low-molecular-weight and oligomeric components in secondary or-ganic aerosol from the ozonolysis of cycloalkenes and alpha-pinene, J. Phys. Chem. A, 108, 25
10 147–10 164, 2004.
Hallquist, M., Wangberg, I., and Ljungstrom, E.: Atmospheric fate of carbonyl oxidation
prod-ucts originating fromα-pinene andδ3-carene: Determination of rate of reaction with OH and
NO3radicals, UV absorption cross sections, and vapor pressures, Environ. Sci. Technol., 31,
3166–3172, 1997. 30
Heald, C. L., Jacob, D. J., Park, R. J., Russell, L. M., Huebert, B. J., Seinfeld, J. H., Liao, H., and Weber, R. J.: A large organic aerosol source in the free troposphere missing from current models, Geophys. Res. Lett., 32, L18809, doi:10.1029/2005GL023831, 2005.
ACPD
8, 15343–15373, 2008Elemental composition of
α-pinene SOA particles
J. E. Shilling et al.
Title Page
Abstract Introduction
Conclusions References
Tables Figures
◭ ◮
◭ ◮
Back Close
Full Screen / Esc
Printer-friendly Version
Interactive Discussion
Jang, M. and Kamens, R. M.: Newly characterized products and composition of secondary
aerosols from the reaction ofα-pinene with ozone, Atmos. Environ., 33, 459–474, 1999.
Jayne, J. T., Leard, D. C., Zhang, X., Davidovits, P., Smith, K. A., Kolb, C. E., and Worsnop, D. R.: Development of an aerosol mass spectrometer for size and composition analysis of submicron particles, Aerosol Sci. Technol., 33, 70, 2000.
5
Jenkin, M.: Modeling the formation and composition of secondary organic aerosol fromα- and
β-pinene with O3, Atmos. Chem. Phys., 2004, 1741–1754, 2004,
http://www.atmos-chem-phys.net/2004/1741/2004/.
Jimenez, J. L., Shi, Q., Kolb, C. E., Worsnop, D. R., Yourshaw, I., Seinfeld, J. H., Flagan, R. C., Zhang, X., Smith, K. A., Morris, J. W., and Davidovits, P.: Ambient aerosol sampling using 10
the aerodyne aerosol mass spectrometer, J. Geophys. Res., 108, 8425, 2003.
Johnson, D., Utembe, S. R., Jenkin, M. E., Derwent, R. G., Hayman, G. D., Alfarra, M. R., Coe, H., and McFiggans, G.: Simulating regional scale secondary organic aerosol formation during the Torch 2003 campaign in the southern UK, Atmos. Chem. Phys., 6, 403–418, 2006, http://www.atmos-chem-phys.net/6/403/2006/.
15
Kalberer, M., Paulsen, D., Sax, M., Steinbacher, M., Dommen, J., Prevot, A. S. H., Fisseha, R., Weingartner, E., Frankevich, V., Zenobi, R., and Baltensperger, U.: Identification of polymers as major components of atmospheric organic aerosols, Science, 303, 1659–1662, 2004. Katrib, Y., Martin, S. T., Rudich, Y., Davidovits, P., Jayne, J. T., and Worsnop, D. R.: Density
changes of aerosol particles as a result of chemical reaction, Atmos. Chem. Phys., 5, 275– 20
291, 2005,
http://www.atmos-chem-phys.net/5/275/2005/.
King, S. M., Rosenorn, T., Chen., Q., Shilling, J. E., and Martin, S. T.: CCN activity of mixed sulfate/SOA aerosols, Geophys. Res. Lett., 34, L24806, 10.1029/2007GL030390, 2007. Kleindienst, T. E., Smith, D. F., Li, W., Edney, E. O., Driscoll, D. J., Speer, R. E., and Weathers, 25
W. S.: Secondary organic aerosol formation from the oxidation of aromatic hydrocarbons in the presence of dry submicron ammonium sulfate aerosol, Atmos. Environ., 33, 3669–3681, 1999.
Kostenidou, E., Pathak, R. K., and Pandis, S. N.: An algorithm for the calculation of secondary organic aerosol density combining AMS and SMPS data, Aerosol Sci. Technol., 41, 1002– 30
1010, 2007.
ACPD
8, 15343–15373, 2008Elemental composition of
α-pinene SOA particles
J. E. Shilling et al.
Title Page
Abstract Introduction
Conclusions References
Tables Figures
◭ ◮
◭ ◮
Back Close
Full Screen / Esc
Printer-friendly Version
Interactive Discussion
Lanz, V. A., Alfarra, M. R., Baltensperger, U., Buchmann, B., Hueglin, C., and Prevot, A. S. H.: Source apportionment of submicron organic aerosols at an urban site by factor analytical modeling of aerosol mass spectra, Atmos. Chem. Phys., 7, 1503–1522, 2007,
http://www.atmos-chem-phys.net/7/1503/2007/.
Lanz, V. A., Alfarra, M. R., Baltensperger, U., Buchmann, B., Hueglin, C., Szidat, S., Wehrli, 5
M. N., Wacker, L., Weimer, S., Caseiro, A., Puxbaum, H., and Prevot, A. S. H.: Source attribution of submicron organic aerosols during wintertime inversions by advance factor analysis of aerosol mass spectra, Environ. Sci. Technol., 42, 214–220, 2008.
Marcolli, C., Canagaratna, M. R., Worsnop, D. R., Bahreini, R., deGouw, J. A., Warneke, C., Goldan, P. D., Kuster, W. C., Wiliams, E. J., Lerner, B. M., Roberts, J. M., Meagher, J. 10
F., Fehsenfeld, F. C., Marchewka, M. L., Bertman, S. B., and Middlebrook, A. M.: Cluster analysis of the organic peaks in bulk mass spectra obtained during the 2002 New England Air Quality study with an Aerodyne aerosol mass spectrometer, Atmos. Chem. Phys., 6, 5649-5666, 2006,
http://www.atmos-chem-phys.net/6/5649/2006/. 15
Pankow, J. F.: An absorption-model of gas-particle partitioning of organic-compounds in the atmosphere, Atmos. Environ., 28, 185–188, 1994a.
Pankow, J. F.: An absorption-model of the gas aerosol partitioning involved in the formation of secondary organic aerosol, Atmos. Environ., 28, 189–193, 1994b.
Pankow, J. F. and Asher, W. E.: Simpol.1: A simple group contribution method for predicting va-20
por pressures and enthalpies of vaporization of multifunctional organic compounds, Atmos. Chem. Phys., 8, 2773–2796, 2008,
http://www.atmos-chem-phys.net/8/2773/2008/.
Presto, A. A. and Donahue, N. M.: Investigation of alpha-pinene plus ozone secondary organic aerosol formation at low total aerosol mass, Environ. Sci. Technol., 40, 3536–3543, 2006. 25
Saunders, S. M., Jenkin, M. E., Derwent, R. G., and Pilling, M. J.: Protocol for the development of the master chemical mechanism, MCM v3 (part a): Tropospheric degradation of non-aromatic volatile organic compounds, Atmos. Chem. Phys., 3, 161–180, 2003,
http://www.atmos-chem-phys.net/3/161/2003/.
Seinfeld, J. H., Kleindienst, T. E., Edney, E. O., and Cohen, J. B.: Aerosol growth in a steady-30
state, continuous flow chamber: Application to studies of secondary aerosol formation, Aerosol Sci. Technol., 37, 728–734, 2003.
Seinfeld, J. H. and Pankow, J. F.: Organic atmospheric particulate material, Annu. Rev. Phys.
ACPD
8, 15343–15373, 2008Elemental composition of
α-pinene SOA particles
J. E. Shilling et al.
Title Page
Abstract Introduction
Conclusions References
Tables Figures
◭ ◮
◭ ◮
Back Close
Full Screen / Esc
Printer-friendly Version
Interactive Discussion
Chem., 54, 121–140, 2003.
Shilling, J. E., Chen, Q., Rosenoern, T., King, S. M., Kroll, J. H., Worsnop, D. R., McKinney, K. A., and Martin, S. T.: Particle mass yield in secondary organic aerosol formed by the dark
ozonolysis ofα-pinene Atmos. Chem. Phys., 8, 2073–2088, 2008,
http://www.atmos-chem-phys.net/8/2073/2008/. 5
Song, C., Zaveri, R. A., Alexander, M. L., Thorton, J. A., Madronich, S., Ortega, J. V., Zelenyuk,
A., Yu, X.-Y., Laskin, A., and Maughan, D. A.: Effect of hydrophobic primary organic aerosols
on secondary organic aerosol formation from ozonolysis ofα-pinene, Geophys. Res. Lett.,
37, L20803, doi:10.1029/2007GL030720, 2007.
Takegawa, N., Miyakawa, T., Kawamura, K., and Kondo, Y.: Contribution of selected dicar-10
boxylic and ω-oxycarboxylic acids in ambient aerosol to the m/z 44 signal of an Aerodyne
aerosol mass spectrometer, Aerosol Sci. Technol., 41, 418–437, 2007.
Takegawa, N., Miyakawa, T., Kondo, Y., Blake, D. R., Kanaya, Y., Koike, M., Fukada, M., Komazaki, Y., Miyazaki, Y., Shimono, A., and Takeuchi, T.: Evolution of submicron organic aerosol in polluted air exported from Tokyo, Geophys. Res. Lett., 33, L15814, 15
10.1029/2006GL025815, 2006.
Tolocka, M. P., Jang, M., Ginter, J. M., Cox, F. J., Kamens, R. M., and Johnston, M. V.: For-mation of oligomers in secondary organic aerosol, Environ. Sci. Technol., 38, 1428–1434, 2004.
Ulbrich, I. M., Canagaratna, M. R., Zhang, Q., Worsnop, D. R., and Jimenez, J. L.: Interpretation 20
of organic components from positive matrix factorization of aerosol mass spectrometric data, Atmos. Chem. Phys. Discuss., 8, 6729–6791, 2008,
http://www.atmos-chem-phys-discuss.net/8/6729/2008/.
Volkamer, R., Jimenez, J. L., San Martini, F., Dzepina, K., Zhang, Q., Salcedo, D., Molina, L. T., Worsnop, D. R., and Molina, M. J.: Secondary organic aerosol formation from anthro-25
pogenic air pollution: Rapid and higher than expected, Geophys. Res. Lett., 33, L17811, doi:10.1029/2006GL026899, 2006.
Yu, J., III, D. R. C., Griffin, R. J., Flagan, R. C., and Seinfeld, J. H.: Gas-phase ozone oxidation
of monoterpenes: Gaseous and particulate products, J. Atmos. Chem., 34, 207–258, 1999. Zhang, J., Huf-Hartz, K. E., Pandis, S. N., and Donahue, N. M.: Secondary organic aerosol for-30
mation from limonene ozonolysis: Homogeneous and heterogeneous influences as a
func-tion of NOx, J. Phys. Chem. A, 110, 11 053–11 063, 2006.
ACPD
8, 15343–15373, 2008Elemental composition of
α-pinene SOA particles
J. E. Shilling et al.
Title Page
Abstract Introduction
Conclusions References
Tables Figures
◭ ◮
◭ ◮
Back Close
Full Screen / Esc
Printer-friendly Version
Interactive Discussion
J. L.: Deconvolution and quantification of hydrocarbon-like and oxygenated organic aerosols based on aerosol mass spectrometry, Environ. Sci. Technol., 39, 4938–4952, 2005a. Zhang, Q., Worsnop, D. R., Canagaratna, M. R., and Jimenez, J. L.: Hydrocarbon-like and
oxygenated organic aerosols in Pittsburgh: Insights into sources and processes of organic aerosols, Atmos. Chem. Phys., 5, 3289–3311, 2005b,
5
http://www.atmos-chem-phys.net/5/3289/2005/.
Zhang, Q., Canagaratna, M. R., Jayne, J. T., Worsnop, D. R., and Jimenez, J.-L.: Time- and size-resolved chemical compositions of submicron particles in Pittsburgh: Implications for aerosol sources and processes, J. Geophys. Res., 110, D070S079, doi:10.1029/2004JD004649, 2005c.
10
Zhang, Q., Jimenez, J. L., Canagaratna, M. R., Allan, J. D., Coe, H., Ulbrich, I., Alfarra, M. R., Takami, A., Middlebrook, A. M., Sun, Y. L., Dzepina, K., Dunlea, E., Docherty, K., De-Carlo, P. F., Salcedo, D., Onasch, T., Jayne, J. T., Miyoshi, T., Shimono, A., Hatakeyama, S., Takegawa, N., Kondo, Y., Schneider, J., Drewnick, F., Borrmann, S., Weimer, S., Demerjian,
K., Williams, P., Bower, K., Bahreini, R., Cottrell, L., Griffin, R. J., Rautianinen, J., Sun, J.
15
Y., Zhang, Y. M., and Worsnop, D. R.: Ubiquity and dominance of oxygenated species in or-ganic aerosols in anthropogenically-influenced nothern hemisphere midlatitudes, Geophys. Res. Lett., 34, L13801, doi:10.1029/2007GL029979, 2007.
ACPD
8, 15343–15373, 2008Elemental composition of
α-pinene SOA particles
J. E. Shilling et al.
Title Page
Abstract Introduction
Conclusions References
Tables Figures
◭ ◮
◭ ◮
Back Close
Full Screen / Esc
Printer-friendly Version
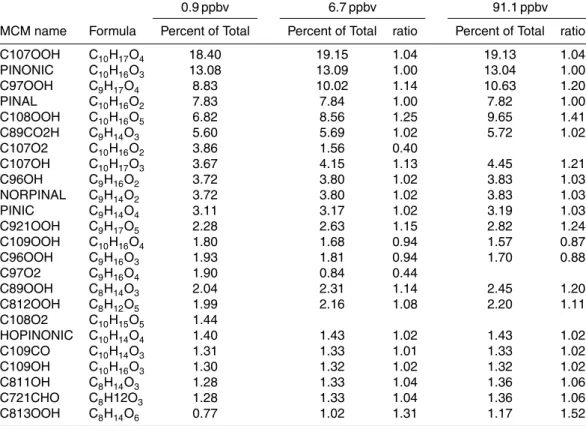
Interactive Discussion Table 1.Gas-phase products predicted by the MCM model v3.1 (Saunders et al., 2003) for the
dark ozonolysis of 0.9, 6.7, and 91.1 ppbv reactedα-pinene. Results are shown as the percent
contribution of each species on a number-concentration basis to the total of all products. For 6.7 and 91.1 ppbv, also shown are the ratios of the percent contribution of each species at those
concentrations to that at 0.9 ppbv. Conditions: 25◦C, 40% RH, dry (NH4)2SO4seed particles,
300 ppbv ozone, 3.4 h residence time, and 0.94 to 95 ppmv 1-butanol (1040×α-pinene). The
model does not treat formation of SOA particle mass.
0.9 ppbv 6.7 ppbv 91.1 ppbv
MCM name Formula Percent of Total Percent of Total ratio Percent of Total ratio
C107OOH C10H17O4 18.40 19.15 1.04 19.13 1.04
PINONIC C10H16O3 13.08 13.09 1.00 13.04 1.00
C97OOH C9H17O4 8.83 10.02 1.14 10.63 1.20
PINAL C10H16O2 7.83 7.84 1.00 7.82 1.00
C108OOH C10H16O5 6.82 8.56 1.25 9.65 1.41
C89CO2H C9H14O3 5.60 5.69 1.02 5.72 1.02
C107O2 C10H16O2 3.86 1.56 0.40
C107OH C10H17O3 3.67 4.15 1.13 4.45 1.21
C96OH C9H16O2 3.72 3.80 1.02 3.83 1.03
NORPINAL C9H14O2 3.72 3.80 1.02 3.83 1.03
PINIC C9H14O4 3.11 3.17 1.02 3.19 1.03
C921OOH C9H17O5 2.28 2.63 1.15 2.82 1.24
C109OOH C10H16O4 1.80 1.68 0.94 1.57 0.87
C96OOH C9H16O3 1.93 1.81 0.94 1.70 0.88
C97O2 C9H16O4 1.90 0.84 0.44
C89OOH C8H14O3 2.04 2.31 1.14 2.45 1.20
C812OOH C8H12O5 1.99 2.16 1.08 2.20 1.11
C108O2 C10H15O5 1.44
HOPINONIC C10H14O4 1.40 1.43 1.02 1.43 1.02
C109CO C10H14O3 1.31 1.33 1.01 1.33 1.02
C109OH C10H16O3 1.30 1.32 1.02 1.32 1.02
C811OH C8H14O3 1.28 1.33 1.04 1.36 1.06
C721CHO C8H12O3 1.28 1.33 1.04 1.36 1.06
ACPD
8, 15343–15373, 2008Elemental composition of
α-pinene SOA particles
J. E. Shilling et al.
Title Page
Abstract Introduction
Conclusions References
Tables Figures
◭ ◮
◭ ◮
Back Close
Full Screen / Esc
Printer-friendly Version
Interactive Discussion Table 2. Four model products i describing the partitioning of SOA molecules between the
gas and particle phases for the dark ozonolysis of α-pinene. Shown are the mass yieldαi,
the decadal volatilityCi∗ (µg/m3), the atomic ratios (O/C)i and (H/C)i, and the corresponding
empirical formulas on a one-carbon basis. Determination ofαi and Ci∗ from the mass yield
is described in Shilling et al. (2008). Donahue et al. (2006) describe the basis-set model of decadal volatility to parameterize yield data.
C∗i(µg/m3) αi (O/C)i (H/C)i Empirical Formula
Product 1 0.1 0.080 0.48 1.32 C1H1.32O0.48
Product 2 1 0.019 0.39 1.36 C1H1.36O0.39
Product 3 10 0.180 0.24 1.57 C1H1.57O0.24
Product 4 100 0.030 0.14 1.76 C1H1.76O0.14
ACPD
8, 15343–15373, 2008Elemental composition of
α-pinene SOA particles
J. E. Shilling et al.
Title Page Abstract Introduction Conclusions References Tables Figures ◭ ◮ ◭ ◮ Back Close
Full Screen / Esc
Printer-friendly Version Interactive Discussion 12 8 4 0 100 90 80 70 60 50 40 30 20 10
Mass-to-Charge Ratio (m/z) 12
8 4 0
Contribution to Organic Signal (%
) 12
8 4 0
0.5 μg/m3
6.4 μg/m3
36.8 μg/m3 29 39 41 43 57 55 69 67 44 29 39 41 43 57 44 55 69 67 57 55 69 67 29 39 41 4344 12 9 6 3 0
Contribution to Organic Signal (%, m/z 43,44)
140 120 100 80 60 40 20 0
SOA Particle Mass Loading (μg/m3 )
6
4
2
0
Contribution to Organic Signal (%, m/z 55)
m/z 43 m/z 44 m/z 55 A B iii ii i * * * * * *
ACPD
8, 15343–15373, 2008Elemental composition of
α-pinene SOA particles
J. E. Shilling et al.
Title Page Abstract Introduction Conclusions References Tables Figures ◭ ◮ ◭ ◮ Back Close
Full Screen / Esc
Printer-friendly Version Interactive Discussion 12 8 4 0 100 80 60 40 20
Mass-to-Charge Ratio (m/z) 12
8 4 0
Contribution to Organic Signal (%
) 12
8 4 0
CxHy+ Family
CxHyOz+ Family
39 41 43 57 44 55 69 67 29 39 41 43 57 44 55 69 67 29 57 55 69 67 29 4344 39 41 56 54 52 50 48 46 44 42
Contribution to Organic Signal (%
) 140 120 100 80 60 40 20 0
SOA Particle Mass Loading (μg/m3
)
CxHy+ Family
CxHyOz+ Family
A
B
iii ii i
0.5 μg/m3
6.4 μg/m3
36.8 μg/m3
* *
*
*
Fig. 2. (A)High-resolution mass spectra presented at unit mass resolution. The intensity bar at eachm/zvalue shows in green the relative contribution of fragments containing C and H (i.e., the CxH+y family) and in pink of fragments containing C, H, and O (i.e., the CxHyO+z family). Figure S2 shows an example of the deconvolution of the high-resolution mass spectra into the relative contributions by each family (DeCarlo et al., 2006). Reaction conditions and labels are as in Fig. 1, and the high-resolution spectra were collected contemporaneously with the data collection for Fig. 1. (B)Percent contribution of the CxH+y and CxHyO+z families to the total organic signal for increasing organic particle mass loading. Lines are shown to guide the eye.
ACPD
8, 15343–15373, 2008Elemental composition of
α-pinene SOA particles
J. E. Shilling et al.
Title Page
Abstract Introduction
Conclusions References
Tables Figures
◭ ◮
◭ ◮
Back Close
Full Screen / Esc
Printer-friendly Version
Interactive Discussion 0.50
0.45
0.40
0.35
0.30
Oxygen-to-Carbon Ratio
140 120 100 80 60 40 20 0
SOA Particle Mass Loading (μg/m3
)
1.55
1.50
1.45
1.40
1.35
Hydrogen-to-Carbon Ratio
Oxygen-to-Carbon Ratio Hydrogen-to-Carbon Ratio
* *
* *
ACPD
8, 15343–15373, 2008Elemental composition of
α-pinene SOA particles
J. E. Shilling et al.
Title Page
Abstract Introduction
Conclusions References
Tables Figures
◭ ◮
◭ ◮
Back Close
Full Screen / Esc
Printer-friendly Version
Interactive Discussion
0.30
0.25
0.20
0.15
0.10
0.05
0.00
Yield
4 5 6
1
2 3 4 5 6
10
2 3 4 5 6
100
SOA Particle Mass Loading (μg/m
3)
Product 1 - C
1H
1.32O
0.48Product 2 - C
1H
1.36O
0.39Product 3 - C
1H
1.57O
0.24Product 4 - C
1H
1.76O
0.14Fig. 4.Chemically resolved SOA particle mass yield for increasing organic particle mass load-ing. The bar at each of these mass loading shows the relative contribution of the four basis-set products. The inset shows the chemical formula of each of these products on a one-carbon ba-sis (i.e., empirical formula). Table 2 summarizes the parameters of the four baba-sis-set products, including their decadal volatility.
ACPD
8, 15343–15373, 2008Elemental composition of
α-pinene SOA particles
J. E. Shilling et al.
Title Page
Abstract Introduction
Conclusions References
Tables Figures
◭ ◮
◭ ◮
Back Close
Full Screen / Esc
Printer-friendly Version
Interactive Discussion
Effective Density (g/cm
3 )
SOA Particle Mass Loading (μg/m3
) 1.8
1.6
1.4
1.2
1.0
40 30
20 10
0
Fig. 5. Effective density of the SOA organic particle mass for increasing loading. Density and
effective density equal one another for spherical particles. Effective density was calculated
ACPD
8, 15343–15373, 2008Elemental composition of
α-pinene SOA particles
J. E. Shilling et al.
Title Page
Abstract Introduction
Conclusions References
Tables Figures
◭ ◮
◭ ◮
Back Close
Full Screen / Esc
Printer-friendly Version
Interactive Discussion
15
10
5
0
Contribution to Organic Signal (%)
100 80
60 40
20
Mass-to-Charge Ratio (m/z) 15
10
5
0
α-pinene SOA
0.5 μg/m3
Pittsburgh OOA
4.0 μg/m3
39 41 43
57 44
55
69 67 29
41 43
57 44
55
69 67 29
ii
i
Fig. 6.Comparison of (i) the mass spectrum collected in the Harvard Environmental Chamber
for a loading of 0.5µg/m3 (cf. Fig. 1) to (ii) the OOA-component mass spectrum obtained by
multifactor analysis of ambient observations in Pittsburgh, USA, during September 2002 (Zhang
et al., 2005b). The organic mass loading averaged 4µg/m3at that time.