Transcription Factors in
Escherichia coli
Hao Bai1.*, Matthew D. Rolfe2., Wenjing Jia2
, Simon Coakley1, Robert K. Poole2, Jeffrey Green2*,
Mike Holcombe1
1Department of Computer Science, University of Sheffield, Sheffield, United Kingdom,2Department of Molecular Biology and Biotechnology, University of Sheffield, Sheffield, United Kingdom
Abstract
In the presence of oxygen (O2) the model bacteriumEscherichia coliis able to conserve energy by aerobic respiration. Two major terminal oxidases are involved in this process - Cyo has a relatively low affinity for O2but is able to pump protons and
hence is energetically efficient; Cyd has a high affinity for O2 but does not pump protons. When E. coli encounters
environments with different O2availabilities, the expression of the genes encoding the alternative terminal oxidases, the
cydABandcyoABCDEoperons, are regulated by two O2-responsive transcription factors, ArcA (an indirect O2sensor) and
FNR (a direct O2sensor). It has been suggested that O2-consumption by the terminal oxidases located at the cytoplasmic
membrane significantly affects the activities of ArcA and FNR in the bacterial nucleoid. In this study, an agent-based
modeling approach has been taken to spatially simulate the uptake and consumption of O2byE. coliand the consequent
modulation of ArcA and FNR activities based on experimental data obtained from highly controlled chemostat cultures. The
molecules of O2, transcription factors and terminal oxidases are treated as individual agents and their behaviors and
interactions are imitated in a simulated 3-DE. coli cell. The model implies that there are two barriers that dampen the
response of FNR to O2, i.e. consumption of O2 at the membrane by the terminal oxidases and reaction of O2 with
cytoplasmic FNR. Analysis of FNR variants suggested that the monomer-dimer transition is the key step in FNR-mediated repression of gene expression.
Citation:Bai H, Rolfe MD, Jia W, Coakley S, Poole RK, et al. (2014) Agent-Based Modeling of Oxygen-Responsive Transcription Factors inEscherichia coli. PLoS Comput Biol 10(4): e1003595. doi:10.1371/journal.pcbi.1003595
Editor:Feilim Mac Gabhann, Johns Hopkins University, United States of America ReceivedJuly 12, 2013;AcceptedMarch 14, 2014;PublishedApril 24, 2014
Copyright:ß2014 Bai et al. This is an open-access article distributed under the terms of the Creative Commons Attribution License, which permits unrestricted use, distribution, and reproduction in any medium, provided the original author and source are credited.
Funding:This work was supported by the Biotechnology and Biological Sciences Council UK through the SysMO initiative and project grant BB/I004122/1. The funders had no role in study design, data collection and analysis, decision to publish, or preparation of the manuscript.
Competing Interests:The authors have declared that no competing interests exist. * E-mail: [email protected] (HB); [email protected] (JG)
.These authors contributed equally to this work.
Introduction
The bacteriumEscherichia coliis a widely used model organism to study bacterial adaptation to environmental change. As an enteric bacterium,E. colihas to cope with an O2-starved niche in the host
and an O2-rich environment when excreted. In order to exploit
the energetic benefits that are conferred by aerobic respiration,E. colihas two major terminal oxidases: cytochromebd-I (Cyd) and cytochrome bo9 (Cyo) that are encoded by the cydAB and
cyoABCDEoperons, respectively [1,2]. Cyd has a high affinity for O2 and is induced at low O2 concentrations (micro-aerobic
conditions), whereas Cyo has a relatively low affinity for O2and is
predominant at high O2concentrations (aerobic conditions) [3].
These two terminal oxidases contribute differentially to energy conservation because Cyo is a proton pump, whereas Cyd is not [1,2]; however, the very high affinity of Cyd for O2 allows the
bacterium to maintain aerobic respiration at nanomolar concen-trations of O2, thereby maintaining aerobic respiratory activity
rather than other, less favorable, metabolic modes [4–6]. The transcription factors, ArcA and FNR, regulatecydABand
cyoABCDE expression in response to O2 supply [7]. FNR is an
iron-sulfur protein that senses O2in the cytoplasm [8,9]. In the
absence of O2the FNR iron-sulfur cluster is stable and the protein
forms dimers that are competent for site-specific DNA-binding and regulation of gene expression [10]. The FNR iron-sulfur cluster reacts with O2in such a way that the DNA-binding dimeric
form of FNR is converted into a non-DNA-binding monomeric species [10]. Under anaerobic conditions, FNR acts as a global regulator in E. coli [11–13], including thecydAB and cyoABCDE
operons, which are repressed by FNR when the O2 supply is
restricted [7]. Under aerobic conditions, repression ofcydAB and
cyoABCDEis relieved and Cyd and Cyo proteins are synthesized [3]. In contrast, ArcA responds to O2availability indirectly via the
membrane-bound sensor ArcB. In the absence of O2 ArcB
responds to changes in the redox state of the electron transport chain and the presence of fermentation products by autopho-sphorylating [14–16]. Phosphorylated ArcB is then able to transfer phosphate to the cytoplasmic ArcA regulator (ArcA,P), which
then undergoes oligomerization to form a tetra-phosphorylated octomer that is capable of binding at multiple sites in theE. coli
genome [17,18], including those in the promoter regions ofcydAB
andcyoABCDEto enhance synthesis of Cyd and inhibit production of Cyo [7,17]. Because the terminal oxidases (Cyd and Cyo) consume O2at the cell membrane, a feedback loop is formed that
-combining direct and indirect O2sensing with ArcA,P and FNR
repression of cyoABCDE, and ArcA,P activation and FNR
repression of cydAB - result in maximal Cyd production when the O2supply is limited (micro-aerobic conditions) and maximal
Cyo content when O2is abundant (aerobic conditions) [3].
Although the cellular locations of the relevant genes (cydABand
cyoABCDE), the regulators (ArcBA and FNR) and the oxidases (Cyd and Cyo) are likely to be fundamentally important in the regulation of this system, the potential significance of this spatial organization has not been investigated. Therefore, a detailed agent-based model was developed to simulate the interaction between O2 molecules and the electron transport chain
compo-nents, Cyd and Cyo, and the regulators, FNR and ArcBA, to shed new light on individual events within local spatial regions that could prove to be important in regulating this core component of theE. colirespiratory process.
Results/Discussion
The starting point for this work was the suggestion that spatial effects play an important role in controlling the response of theE. colitranscription factor FNR to changes in O2availability [15].
Early work showed that when dissolved O2was detectable in the
culture medium the activity of FNR decreased, exhibiting,50%
activity in the range 2–5mM dissolved O2and that under these
conditions the external concentration of O2was equivalent to that
in the bacterial cytoplasm [19,20]. However, when the cultures were supplied with low concentrations of O2 in the input gas,
dissolved O2 in the culture medium could not be measured
conventionally, because the O2 is consumed by the respiratory
activity of the bacteria. Therefore, a physiological measure of O2
availability (the aerobiosis scale) was adopted to investigate the effects of low O2 concentrations on bacteria [21]. On the
aerobiosis scale, the minimum O2input that results in
undetect-able excretion of the fermentation product acetate under carbon-limiting conditions is defined as 100% aerobiosis (100% AU). As the amount of O2supplied to cultures decreases the specific rate of
acetate production (qacetate) increases to a maximum under
anaerobic conditions (0% AU). Between these limits (0–100%
AU) lies the micro-aerobic range, defined by the linear decrease in
qacetate as the O2 transfer rate increases, i.e. there is an inverse
correlation between qacetate and aerobiosis [21]. When the O2
supply exceeds the minimum required to abolish acetate excretion the AU value extends beyond 100%, reaching 217% when the culture medium is O2saturated. This physiological measurement
of O2availability is reliable for cultures grown at values as low as
4% AU [21]. In previous experiments using this approach steady-state chemostat cultures were established at fixed points on the aerobiosis scale and samples were taken for measurement of the numbers of Cyd and Cyo molecules per bacterial cell (Table 1) [3]. In addition, Western blotting showed that the concentration of FNR in the cell was constant at 3000 protomers per bacterium across the aerobiosis scale (Table 1).
The agent-based model was constructed to simulate interactions between three groups of agents: O2molecules, terminal oxidases,
(Cyd and Cyo) and regulators (FNR and ArcBA), which interact with O2 directly or indirectly. As shown in Figure 2, the initial
state of the model is defined in the file 0.xml, which contains information on agent properties such as Id, type, status, position etc. – the data in Table 1 was used to provide numbers of Cyd, Cyo, ArcA and FNR molecules. There is no information available on the abundance of ArcB in the cell and thus it was assumed that there are 1000 ArcB molecules per cell based on the,10:1 ratio of
response-regulator to sensor kinase of another E. coli two-component system, PhoBR [22]. At the beginning of the simulation, the 0.xml file is read to establish the 3-DE. colicell. From the initial state, the agents start moving randomly within their 3-D activity space, and interact with each other according to a set of pre-defined interaction rules and interaction radii (Tables 2 and 3), leading to an emergent state.
The algorithm of supplying O2to the cell responds to given AU
levels and automatically calculates the rate of O2 molecules
supplied to the cell. Whilst the model runs, agent information is updated and stored as a series of XML files for further analysis and visualization.
Modeling the regulatory response to O2availability The dynamics of the system were investigated by running the simulation through two cycles of transitions from 0–217% AU. Figure 3a shows a top view of a 3-DE. colicell at 0% AU (steady-state anaerobic conditions). Under these conditions, the FNR molecules are present as dimers, all ArcB molecules are phosphorylated and the ArcA is octameric. The DNA binding sites for ArcA (120 in the model) and FNR (350 in the model) in the nucleoid are fully occupied. The number of ArcA sites was chosen from the data reported by Liu and De Wulf [18]. The model must include a mechanism for ArcA,P to leave regulated
promoters. Upon introduction of O2into anaerobic steady-state
chemostat cultures ,5 min was required to inactivate
ArcA-mediated transcription [15]. In the agent-based model presented here, each iteration represents 0.2 sec. Therefore, assuming that ArcA,P leaving the 120 DNA sites is a first order process, then tK is,45 sec, which is equivalent to,0.3% ArcA,P leaving the
DNA per iteration (Table 3). The number of FNR binding sites was based on ChIP-seq and ChIP-Chip measurements, which detected ,220 FNR sites and a genome sequence analysis that
predicted,450 FNR sites; thus a mid-range value of 350 was
chosen [23–25]. Interaction with O2 causes FNR to dissociate
from the DNA (Table 3). Under fully aerobic conditions (217% AU) the FNR dimers are disassembled to monomers, and the different forms of ArcA coexist (Figure 3b). The ArcA- and FNR-DNA binding sites in the nucleoid are mostly unoccupied due to the lower concentrations of FNR dimers and ArcA octamers. Author Summary
The model bacterium Escherichia coli has a modular
electron transport chain that allows it to successfully
compete in environments with differing oxygen (O2)
availabilities. It has two well-characterized terminal
oxi-dases, Cyd and Cyo. Cyd has a very high affinity for O2,
whereas Cyo has a lower affinity, but is energetically more efficient. Expression of the genes encoding Cyd and Cyo is
controlled by two O2-responsive regulators, ArcBA and
FNR. However, it is not clear how O2molecules enter theE. colicell and how the locations of the terminal oxidases and the regulators influence the system. An agent-based
model is presented that simulates the interactions of O2
with the regulators and the oxidases in anE. colicell. The
model suggests that O2consumption by the oxidases at
the cytoplasmic membrane and by FNR in the cytoplasm protects FNR bound to DNA in the nucleoid from inactivation and that dimerization of FNR in response to
O2 depletion is the key step in FNR-mediated repression.
Examination of the system as it transits from 0% to 217% AU showed that the DNA-bound, transcriptionally active FNR was initially protected from inactivation by consumption of O2at the
cell membrane by the terminal oxidases and by reaction of O2
with the iron-sulfur clusters of FNR dimers in the bacterial cytoplasm - the progress of this simulation is shown in Video S1.
This new insight into the buffering of the FNR response could serve a useful biological purpose by preventing pre-mature switching off of anaerobic genes when the bacteria are exposed to low concentration O2pulses in the environment.
In the various niches occupied by E. coli, the bacterium can experience the full range of O2concentrations from zero, in the
Table 1.Numbers of Cyd, Cyo, ArcA and FNR molecules perE. colicell at different points on the aerobiosis scale.
AU (%) Cyd (molecules per cell) Cyo (molecules per cell)
Total ArcA monomer (molecules per cell)
Total FNR monomer (molecules per cell)
0 11442 4336 8000 3000
31 51403 6202 8000 3000
85 66729 14017 8000 3000
115 19102 10985 8000 3000
217 10284 9036 8000 3000
The Cyd, Cyo and ArcA numbers are those reported by Rolfe et al. [3]. The number of FNR molecules per cell was calculated by from analysis of Western blots developed with anti-FNR serum for whole cell samples taken from steady-state cultures at the indicated aerobiosis units (AU).
doi:10.1371/journal.pcbi.1003595.t001
Figure 1. Components of the agent-based model.The diagram shows the interactions between and locations of the components of the model. Oxygen molecules (O2) cross the cytoplasmic membrane and enter the bacterial cell where they are reduced to water (H2O) by the action of the membrane-bound terminal oxidases (Cyo and Cyd). The transcription regulator, FNR is located in the cytoplasm and is inactivated by reaction with O2. The active form of FNR represses the expression of both thecydABandcyoABCDEoperons located in the nucleoid. The ArcBA two-component system responds to O2indirectly (dashed line). The availability of O2alters the redox state of the electron transport chain and the production of fermentation products. These changes are sensed by the membrane-bound sensor ArcB, which autophosphorylates when O2is restricted. ArcB transfers phosphate to the cytoplasmic regulator ArcA, which acts to repress expression ofcyoABCDEand activate expression ofcydAB.
anaerobic regions of a host alimentary tract, to full O2saturation
(,200mM, equivalent to,120,000 O2molecules per cell), but fully
aerobic metabolism is supported when the O2supply exceeds 1,000
O2molecules per cell. The profiles of five repetitive simulations for
each agent in the model are presented in Figure 4. From iteration 1 to 5000 and iteration 15000 to 20000, O2was supplied at a constant
value of,6,500 molecules per cell such that the total number of O2
molecules entering the cell increased linearly; when the O2supply
was stopped (5000 to 15000 and 20000 to 30000 iterations) no more
O2entered the cell and thus the number of O2molecules that had
entered the cell remained unchanged during these periods (Figure 4a). When O2became available to the cell (from iteration
1), the sensor ArcB was phosphorylated and started to de-phosphorylate ArcA. Consequently, the number of ArcA octamers bound at their cognate sites in the nucleoid decreased rapidly. The ArcA tetramers and dimers produced during de-phosphorylation of the ArcA octamer were transformed to inactive (de-phosphorylated) ArcA dimers, (Figure 4d–f). Under aerobic conditions (iteration
Figure 2. Components and process of agent-based model simulation.The file 0.xml contains all the settings for the agents involved to provide the initial model state. The FNR system, ArcBA system and terminal oxidases are displayed in light grey, light blue and light red ellipses respectively. The interaction rules and parameters are pre-defined, which determines how and when the interactions take place. For each of the iterations the number of O2molecules supplied to modelled cell is calculated. While model runs, updated information is generated in the same format as the initial file and stored in a series of xml files for further analysis. Experimental data, where available, were used for preparing the initial file and designing the interaction rules and parameters.
5000) all the ArcA was decomposed to inactive ArcA dimers. When the O2 supply was stopped (from iteration 5001), the number of
inactive ArcA dimers decreased rapidly as shown in Figure 4f, being transformed into phosphorylated ArcA dimers, tetramers and octamers (Figure 4c–e). Due to the phosphorylated ArcA dimers
and tetramers combining to form ArcA octamers, their numbers dropped after initially increasing. The rate at which the ArcA octomers accumulated (ArcA activation) after O2withdrawal was
slower than the rate of ArcA inactivation (Figures 4b and c). In this implementation of the modeled transition cycle, the numbers of
Table 2.Agent properties.
Molecule Form Initial number Step length (nm) Initial location Activity space
O2 Molecule 0 Variable1 Outside the cell From outside to inside of the
cell
FNR Monomer 0 15 n/a Inside the cell
Free dimer 1150 15 Evenly distributed in the cell Inside the cell
Dimer bound to DNA 350 0 Inside the nucleoid space Stationary on DNA
ArcA2 Octamer 1000 18 Evenly distributed in the cell Inside the cell
Octamer bound to DNA 120 0 Inside the nucleoid space Stationary on DNA
Tetramer 0 10 n/a Inside the cell
Dimer 0 10 n/a Inside the cell
ArcB3 Protein molecule 1000 5 Inner membrane Inner membrane
Cyo Oxidase molecule Vary at different AU
levels4 5 Inner membrane Inner membrane
Cyd Oxidase molecule Vary at different AU
levels4
5 Inner membrane Inner membrane
The third column lists the number of molecules used to initiate the model. 1See Table 4.
2The ArcA numbers were reported by Rolfe et al. [3]. 3The ArcB numbers are assumed based on the
,10:1 ratio of response-regulator to sensor-kinase for anotherE. colitwo-component system PhoB-PhoR [22]. 4Numbers are listed in Table 1.
doi:10.1371/journal.pcbi.1003595.t002
Table 3.Agent interaction rules.
Molecules Interaction rules1
O2 Interacting with FNR dimer, ArcB, Cyo and Cyd FNR dimer
FNR dimer+O2 !
r1~10
FNR monomer+FNR monomer FNR dimer+binding site !
r2~5
FNR dimer bound to binding site
FNR monomer FNR monomer
+FNR monomer !
r3~6
FNR dimer
FNR dimer bound to
DNA FNR dimer bound to binding site+O2 ! r4~10
FNR monomer+FNR monomer+unoccupied binding site
ArcB ArcB
,P+O2 !
r5~15
ArcB+O2 ArcA octamer ArcA octamer
+ArcB !
r6~35
ArcA tetramer+ArcA dimer,P+ArcA dimer+ArcB,P ArcA tetramer
ArcA tetramer+ArcA tetramer !
r7~3
ArcA octamer
ArcA tetramer+ArcB !
r8~35
ArcA dimer,P+ArcA dimer+ArcB,P ArcA dimer,P ArcA dimer
,P+ArcA dimer,P !
r9~3
ArcA tetramer
ArcA dimer,P+ArcB !
r10~35
ArcA dimer+ArcB,P ArcA dimer
ArcA dimer+ArcB,P !
r11~20
ArcA dimer,P+ArcB
ArcA octamer bound to DNA
ArcA octamer bound to DNA is assigned a probability of 0.3% to leave the DNA in every iteration. This ‘off rate’ is required because ArcA,P dephosphorylation occurs by the action of ArcB at the cell membrane (see text).
Cyo Cyo
+O2 !
r12~3
Cyo+H2O Cyd
Cyd+O2 !
r13~7
Cyd+H2O
The interaction radii (nm) were defined and refined as described in theMethods.
ArcA octamers in the cytoplasm and bound to DNA did not reach that observed in the initial state before the second cycle of O2supply
began, indicating that a longer period is required to return to the fermentation state.
The numbers of FNR dimer bound to binding sites and free FNR dimer (cytoplasmic FNR dimer) decreased when O2 was
supplied to the system (Figures 4g–h), but the rate was slower than that for ArcA inactivation, consistent with O2consumption at the Figure 3. The initial and final states of model with no O2and with excess O2supplied.(a) The initial state of model with no O2(0% AU) supplied to the cell. (b) The final state of model with excess O2(217%) supplied to the cell. Each type of molecule is represented by a different color as shown in the key.
membrane, which can be sensed by ArcB to initiate inactivation of ArcA, but lowers the signal for inactivation of FNR. When O2was
removed from the system (from iteration 5001) FNR was activated over a similar timeframe to ArcA (Figures 4b and g), which was again consistent with previous observations [15]. As with ArcA, free FNR dimers and FNR monomers did not fully return to their initial states after O2 supply was withdrawn in the model,
indicating that further iterations are required to reach steady-state (Figure 4h–i). These results clearly indicate that the model is self-adaptive to the changes in O2availability, and the
reproduc-ible responses prove the reliability and robustness of the model. The ArcBA system simulated in this model is based on a preliminary biological assumption, and the agent-based model presented here should prove a reliable and flexible platform for exploring the key components of the system and testing new experimental findings.
Model validation
In order to validate the model with biological measurements of FNR DNA-binding activity estimated using an FNR-dependent
lacZ reporter, the ArcBA system agents were removed from the model by setting their agent numbers to zero. The ArcBA system is an indirect O2sensor and does not consume O2, hence the FNR
system was not affected by withdrawing ArcBA from the model, but this simplification increased simulation speed.
The O2step length and other model parameters were estimated
using the experimental data obtained at 31% AU. Using the estimated O2step length at 31% AU and defining the step length
of O2 molecule, SO2, as 0 at 0% AU, a linear model,
SO2~k|CO2, was constructed to predict the step lengths of O2 at other AU levels, where k= 2.1 and CO2 represents the O2
concentration at different AU levels (Table 4). The O2step lengths
predicted by this model were used to validate the model at 85%, 115% and 217% AU, and the accuracy of the linear model was shown by the good correlation between the model and experi-mental data.
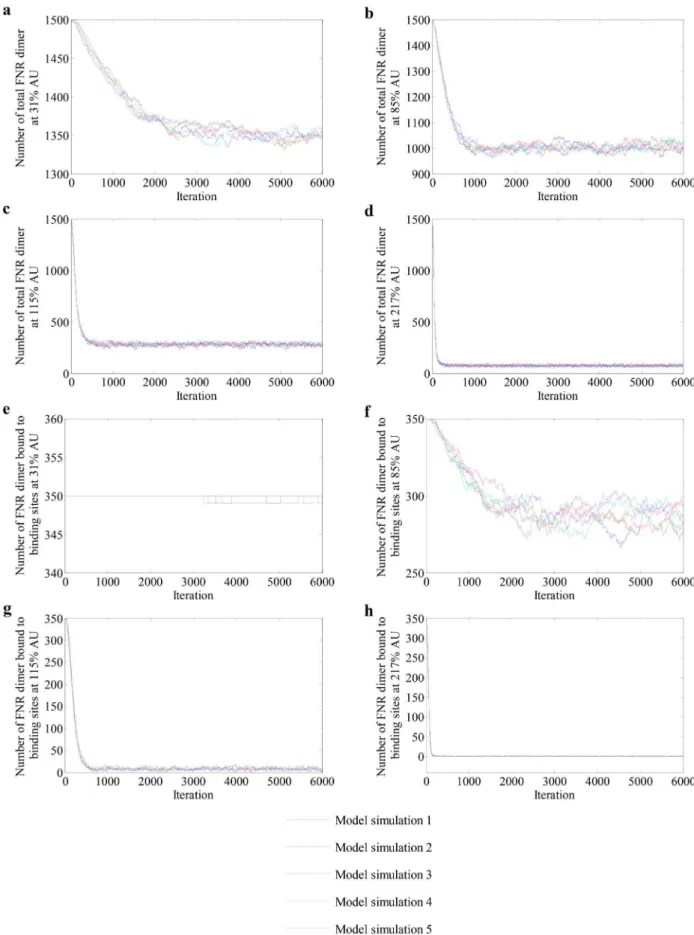
Profiles of five repetitive simulations in which the simplified model was used to predict the numbers of active FNR dimers in steady-state cultures of bacteria grown at different AU values are presented in Figure 5. At 31% AU, the model implied that FNR-mediated gene expression is unaffected compared to an anaerobic culture (0% AU), i.e. the number of FNR binding sites occupied in
the nucleoid remained unchanged (Figures 5a and e). Even at 85% AU, ,80% of the FNR-binding sites remained occupied
(Figures 5b and f). It was only when the O2supply was equivalent
to.115% AU that occupation of the FNR-binding sites in the nucleoid decreased (Figures 5 c, d, g and h). These outputs matched the FNR activities calculated from the measurements of an FNR-dependent reporter (Table 5) and thus demonstrate the abilities of the model to simulate the general behavior of FNR dimers in steady-state cultures ofE. coli.
A second validation approach using two FNR variants that are compromised in their ability to undergo monomer-dimer transi-tions was adopted. The FNR variant FNR I151A can acquire an iron-sufur cluster in the absence of O2, but subsequent
dimeriza-tion is impaired [26]. The FNR D154A variant can also acquire an iron-sulfur cluster under anaerobic conditions, but does not form monomers in the presence of O2 [26]. To mimic the
behavior of these two FNR variants the interaction radius for FNR dimer formation was changed in the model. Thus, the interaction distance for wild-type FNR monomers, which was initially set at 6 nm (r3, Table 3) was increased to 2000 nm for the FNR D154A
variant, essentially fixing the protein as a dimer, or decreased to 2.5 nm for the FNR I151A variant, making this protein predominantly monomeric under anaerobic conditions. The results of simulations run under aerobic (217% aerobiosis) and anaerobic conditions (0% aerobiosis) suggested that under aerobic conditions wild-type FNR and FNR I151A should be unable to inhibit transcription from an FNR-repressed promoter (i.e. the output from the reporter system is 100%), whereas FNR D154A should retain ,50% activity (Table 6). Under anaerobic
conditions, wild-type FNR was predicted to exhibit maximum repressive activity (i.e. 0% reporter output), whereas FNR I151A and FNR D154A mediated slightly enhanced repression compared to the simulated aerobic conditions (Table 6). To test the accuracy of these predictions, the ability of wild-type FNR, FNR I151A and FNR D154A to repress transcription of a synthetic FNR-regulated promoter (FFgalD4) under aerobic and anaerobic conditions was tested [27]. The choice of a synthetic FNR-repressed promoter was made to remove complications that might arise due to iron-sulfur cluster incorporation influencing the protein-protein inter-actions between FNR and RNA polymerase; in the reporter system chosen FNR simply occludes the promoter of the reporter gene and as such DNA-binding by FNR controls promoter
Table 4.Relative parameters for O2molecules.
AU (%) O2in input gas (%) O2molecules per cell per iteration Step length of O2molecule (nm)
0 0 0 0
31 2.8 13 6
85 8.1 37 14.562.5
115 11.1 51 25.560.5
217 21.1 97 41.561.5
The percentages of O2in the input gas at different AU levels (first column) are listed in the second column. The third column presents the calculated numbers of O2 molecules supplied to a cell. The step length values are listed in the fourth column are obtained from a set of model tests at 31% AU only and were validated at 85%, 115% and 217% AU.
doi:10.1371/journal.pcbi.1003595.t004
Figure 4. Model simulation output: quantitative variation of ArcA and FNR molecules in response to O2availabilities.(a) Cumulative
number of O2molecules that have entered the modeled cell. (b–f) The changes in the numbers of ArcA octamers bound to DNA, free ArcA octamers, ArcA tetramers, active (phosphorylated) ArcA dimers, and inactive (de-phosphorylated) ArcA dimers. (g–i) The profiles of FNR dimers bound to DNA, free FNR dimers and FNR monomers. The data were taken from 5 repeats of model simulation with 30,000 iterations per run.
Figure 5. Profiles of FNR dimers at different AU levels.(a–d) Variation of the numbers of total FNR dimers and (e–h) numbers of FNR dimers bound to DNA at AU levels 31%, 85%, 115% and 217% respectively.
activity. The experimental data obtained matched the general response of the FNR variants in the simulation, but not very precisely for FNR D154A, with the experimental data indicating more severe repression by FNR D154A under both aerobic and anaerobic conditions than predicted (Table 6). This suggested that the interaction radius (r2= 5 nm; Table 3), which controls the
binding of FNR to its DNA target required adjustment to enhance DNA-binding of the FNR D154A variant. Therefore, the simulations were rerun after adjusting r2 to 7 nm for all the
FNR proteins considered here. The results of the simulations for both FNR variants now matched the experimental data well (Table 6). However, it was essential to ensure that the adjustment to r2did not significantly influence the model output for wild-type
FNR. Therefore, simulations of the behaviour of wild-type FNR at 31, 85, 115 and 217% aerobiosis were repeated using the adjusted r2 value of 7 nm. The model output was very similar to those
obtained when r2was at the initial value of 5 nm (Table 7). These
analyses imply that for FNR D154A, which is essentially fixed in a dimeric state, the rate of binding to the target DNA governs transcriptional repression, but for wild-type FNR the upstream monomer-dimer transition is the primary determinant controlling the output from the reporter.
Concluding remarks
The FNR switch has been the subject of several attempts to integrate extensive experimental data into coherent models that account for changes in FNR activity and target gene regulation in response to O2 availability [15,28–31]. These models have
provided estimates of active and inactive FNR in E. coli cells exposed to different O2concentrations and the dynamic behavior
of the FNR switch. The ability of FNR to switch rapidly between active and inactive forms is essential for it to fulfill its physiological role as a global regulator and the models are able to capture this dynamic behavior. Thus, it is thought that the ‘futile’ cycling of FNR between inactive and active forms under aerobic conditions has evolved to facilitate rapid activation of FNR upon withdrawal of O2and hence the physiological imperative for rapid activation
has determined the structure of the FNR regulatory cycle [30,31]. However, it is less clear from these approaches how the system avoids undesirable switching between active and inactive states at low O2 availabilities (micro-aerobic conditions, .0%–,100%
AU). To achieve rapid FNR response times it has been suggested that minimizing the range of O2concentrations that constitute a
micro-aerobic environment, from the viewpoint of FNR, is advantageous [31]. Unlike previous models of the FNR switch,
Table 5.Comparison between experimental and simulation results for wild-type FNR.
Simulation results Experimental results
Aerobiosis units (%)
Total FNR dimer (molecules per cell)
FNR dimer bound to binding sites (molecules per cell)
Predicted output from an FNR-dependent promoter (% of maximum)
Total FNR dimer (molecules per cell)1
Measured output from an FNR-dependent promoter (% of maximum)2
0 1500 350 100 1500 10063
31 135066 350 100 1377 9564
85 1033616 287616 8264.6 1020 6767
115 280615 763 260.9 248 1363
217 7368 0 0 60 0
The model simulation data was taken by averaging the model outputs at steady-state. For these results, the values shown are the averages and standard deviations. The last column shows experimentally determined transcription from the FNR-dependentFF-41.5-lacZpromoter; the transcriptional output at 0% AU was set to 100. 1The total numbers of FNR dimers were calculated from the Western blots and FNR-dependent promoter activities.
2
The measured output from an FNR-dependent promoter was reported by [15,38]. doi:10.1371/journal.pcbi.1003595.t005
Table 6.Comparison between experimental and simulation results for FNR variants.
Expression from an FNR-repressed promoter (%)
Strain Aerobic Anaerobic
Simulation
(r3= 5 nm)1 Experiment2
Simulation (r3= 7 nm)
Simulation
(r3= 5 nm) Experiment Simulation (r3= 7 nm)
FNR 100 108.262.2 99.7 0 13.061.2 0
FNR I151A 100 126.762.8 100 87.561.4 83.364.4 79.660.7
FNR D154A 52.061.2 26.261.2 30.460.6 52.062.1 32.663 31.561.3
1For the simulations, the standard deviations were calculated from 5 repeats for FNR and 13 repeats for FNR I151A and FNR D154A. The aerobic condition in simulation was modelled at AU level 217%, and the anaerobic condition was modelled at AU level 0%. r3is the interaction radius between the FNR dimer and its cognate DNA-binding site.
2For the experimental data 100% expression was set as theb-galactosidase activity obtained in the absence of FNR. Measurements were made from three independent cultures.
the agent-based model described here recognizes the importance of geometry and location in biology. This new approach reveals that spatial effects play a role in controlling the inactivation of FNR in low O2environments. Consumption of O2 by terminal
oxidases at the cytoplasmic membrane and reaction of O2with the
iron-sulfur clusters of FNR in the cytoplasm present two barriers to inactivation of FNR bound to DNA in the nucleoid, thereby minimizing exposure of FNR to micro-aerobic conditions by maintaining an essentially anaerobic cytoplasm for AU values up to ,85%. It is suggested that this buffering of FNR response
makes the regulatory system more robust by preventing large amplitude fluctuations in FNR activity when the bacteria are exposed to micro-aerobic conditions or experience environments in which they encounter short pulses of low O2concentrations.
Furthermore, investigation of FNR variants with altered oligo-merization properties suggested that the monomer-dimer transi-tion, mediated by iron-sulfur cluster acquisitransi-tion, is the primary regulatory step in FNR-mediated repression of gene expression. It is expected that the current model will act as a foundation for future investigations, e.g. predicting the effects of adding or removing a class of agent to identify the significant regulatory components of the system.
Methods
Measurement of the rate of O2supply
Knowledge of the rate of O2supply,RO2, to theE. colicells was required in order to simulate the response of the regulators of
cydABandcyoABCDEto different O2availabilities. Therefore,
un-inoculated chemostat vessels were used to measure dissolved O2
concentrations, DO2, as a function of the percentage O2in the
input gas,Pi, in the absence of bacteria. This allowed the rate at
which O2dissolves in the culture medium to be calculated from
the equation:DO2~RO2|Pi, yieldingRO2= 5.898mmol/L/min. The number of O2molecules distributed to a single bacterial cell
was then calculated from the following equation:
NumO2~DO2|NA|Vcell|n (where, NA is the Avogadro
con-stant (6.02261023),Vcellis the volume ofE. colicell (0.3925mm3)
and as a constant for this equation,n(3.361029) includes the unit transformations, min to sec (6021) andmmol to mol (1026), and the time unit represented by an iteration (0.2 sec).
Control of agent mobility
In the model the individual agents (Cyd, Cyo, ArcB, ArcA, FNR and O2) are able to move and interact within the confines of their
respective locations in a 3-D-cylinder representing theE. colicell. To control the velocity of agents, the maximal distances they can
move in 3-D space during one iteration (step length) were pre-defined (Table 4). Thus, a step length is pre-pre-defined in program header file (.h) and for each movement, this is multiplied by a randomly generated value within [0,1] to obtain a random moving distance, which in turn is directed towards a 3-D direction (movement vector) that was also randomly generated within defined spatial regions. An example is shown in Figure 6 to illustrate the movements of an O2molecule when it enters the cell.
Estimating interaction radii
Interactions between agents depend upon the biological rules governing their properties and being in close enough proximity to react. The interaction radius of an agent encapsulates the 3-D space within which reactions occur. As the interaction radii cannot be measured, they were first estimated on the basis of known biological properties. For the radii r1…4, r12 and r13 (Table 3),
arbitrary values were initially set at 31% AU, and the model was then trained to match the experimental result for the number of FNR dimers at 31% AU (Table 5). The modeled output of FNR dimer number at steady-state was compared with the experimental data, and the difference suggested re-adjustment of interaction radii. The adjusted radii were then tested against the FNR dimer numbers at 85%, 115% and 217% AU (Table 5) during model validation, and the results indicate that the interaction radii values are capable of describing the behavior of the system. The
Figure 6. The 3-D movement of an O2 molecule during five
successive iterations. Within a pre-defined limit (step length) the agent moves a random distance per iteration. For O2this is also used to imitate the diffusion along the concentration gradient according to Fick’s first law, in which the flux goes from regions of high concentration to regions of low concentration with a magnitude that is proportional to the concentration gradient (spatial derivative). The adjustment of step length of O2(Table 4) affects the spatial moving speed, which is simply represented as the greater the step length, the faster the movement. The angle range was defined for O2molecules that are outside the cell to enable them move towards cell. The O2 molecules inside the cell and all other molecules move in any direction within their defined spatial regions.
doi:10.1371/journal.pcbi.1003595.g006
Table 7.The effect of interaction distance (r3) for binding of FNR dimers to target DNA on wild-type FNR activity.
FNR dimer bound to binding sites (% of maximum)
Interaction
radius 31% AU 85% AU 115% AU 217% AU
r3= 5 nm1 100 8264.6 260.9 0
r3= 7 nm 100 89.860.7 4.560.6 0.3
The standard deviations for r3= 5 nm were obtained from 5 repeats and for r3= 7 nm 10 repeats of the simulation.
1r
3is the interaction radius between the FNR dimer and its cognate DNA-binding site.
interaction radii of Cyd and Cyo with O2 reflect their relative
affinities for O2 (i.e. Cyd has a high O2affinity and thus reacts
more readily, 7 nm interaction radius, than Cyo, which has a lower affinity for O2, 3 nm interaction radius). As, thus far, no
accurate biological data is available for ArcBA system, the radii
r5…11 were arbitrarily defined and were refined by training the
model to match current biological expectations.
Model description
The rod-shaped E. coli cell was modeled as a cylinder (500 nm62000 nm) [32] with the nucleoid represented as a sphere with a diameter of 250 nm at the centre of the cell. The experimentally-based parameters and locations of the agents in their initial state are listed in Table 2. As the number of ArcB molecules has not been determined experimentally, this value was arbitrarily assigned (see above). The interaction rules for the agents are shown in Table 3 (additional descriptions of an exemplar agent (O2) and the rules for ArcBA and FNR are provided in Figure S1,
Table S1 and Text S1). These rules, combined with the interaction radii, determine the final status of the system. The scale of the model is such that high performance computers are required to implement it, and the flexible agent-based supercomputing framework, FLAME (http://www.flame.ac.uk) acted as the framework to enable the simulation [33,34]. For more information on FLAME see Figure S2 and Text S2.
Measurement of the activities of FNR and FNR variantsin vivo
Plasmids encoding the FNR variants were constructed by site-directed mutagenesis (Quikchange, Agilent) of pGS196, which contains a 5.65 kb fragment of wild-typefnrligated into pBR322 [35]. The three isogenic plasmids pGS196 (FNR), pGS2483 (FNR I151A) and pGS2405 (FNR D154A) were used to transformE. coli
JRG4642 (an fnr lac mutant strain) containing a pRW50-based reporter plasmid carrying thelac-operon under the control of the
FFgalD4promoter [27].
b-Galactosidase assays were carried out as described previously on strains grown in LBK medium at pH 7.2 containing 20 mM glucose [36,37]. Cultures were grown either aerobically (25 ml culture in a 250 ml flask at 250 rpm agitation with 1:100 inoculation) or anaerobically (statically in a fully sealed 17 ml tube with 1:50 inoculation). Cultures (three biological replicates)
were grown until mid-exponential phase (OD600= 0.35) before
assaying forb-galactosidase activity.
Supporting Information
Figure S1 Stategraph for O2 molecules. In order to describe the model clearly, every agent is given a formal description to illustrate its states, memory, functions, and relevant messages that it sends out or receives from other agents (see Table S1). The stategraph for an oxygen agent is shown in the diagram. (TIFF)
Figure S2 Building a FLAME simulation file.The agent definition (written in XMML) is parsed by a FLAME model parser, calledxparser, which generates the simulation code. In the GCC environment, the code is compiled with the message board library,libmboard. The initial agent population settings are set in 0.xml file as the starting status of the model.
(TIFF)
Table S1 Agent description for the O2molecule. (DOCX)
Text S1 Additional description of interaction rules for the regulatory systems, ArcBA and FNR.
(DOCX)
Text S2 The agent-based modeling framework: FLAME. (DOCX)
Video S1 Simulation of ArcBA and FNR activities in response to O2over two 0–217% AU cycles.
(MP4)
Acknowledgments
The authors thank Afsaneh Maleki-Dizaji for initializing the model structure, Melanie Stapleton for pGS2405 and the other members of the SysMo-SUMO2 consortium for many useful discussions: M. Ederer, D.
Knies, O. Sawodny, G. Sanguinetti, B. Cseke, K. Bettenbrock, S. Stagge, S. Steinsiek, P. Sharma, F. Bruggeman and J. Teixeira de Mattos.
Author Contributions
Conceived and designed the experiments: HB MDR WJ RKP JG MH. Performed the experiments: HB MDR. Analyzed the data: HB MDR. Contributed reagents/materials/analysis tools: SC. Wrote the paper: HB WJ JG MH.
References
1. Gennis RB, Stewart V (1996) Respiration, in Escherichia coli and Salmonella Cellular and Molecular Biology: ASM Press, Washington DC. 217–261 p.
2. Trumpower BL, Gennis RB (1994) Energy transduction by cytochrome complexes in mitochondrial and bacterial respiration: the enzymology of coupling electron transfer reactions to transmembrane proton translocation. Annu Rev Biochem 63: 675–716.
3. Rolfe MD, Ter Beek A, Graham AI, Trotter EW, Asif HM, et al. (2011) Transcript profiling and inference ofEscherichia coliK-12 ArcA activity across the range of physiologically relevant oxygen concentrations. J Biol Chem 286: 10147–10154.
4. D’Mello R, Hill S, Poole RK (1995) The oxygen affinity of cytochromebo9in
Escherichia coli determined by the deoxygenation of oxyleghemoglobin and oxymyoglobin: Kmvalues for oxygen are in the submicromolar range. J Bacteriol 177: 867–870.
5. D’Mello R, Hill S, Poole RK (1996) The cytochromebdquinol oxidase in
Escherichia colihas an extremely high oxygen affinity and two oxygen-binding haems: implications for regulation of activity in vivo by oxygen inhibition. Microbiology 142: 755–763.
6. Stolper DA, Revsbech NP, Canfield DE (2010) Aerobic growth at nanomolar oxygen concentrations. Proc Natl Acad Sci U S A 107: 18755–18760. 7. Cotter PA, Gunsalus RP (1992) Contribution of thefnrandarcAgene products in
coordinate regulation of cytochromeoandd oxidase (cyoABCDEandcydAB) genes inEscherichia coli. FEMS Microbiol Lett 70: 31–36.
8. Crack JC, Green J, Thomson AJ, Le Brun NE (2012) Iron-sulfur cluster sensor-regulators. Curr Opin Chem Biol 16: 35–44.
9. Crack JC, Green J, Cheesman MR, Le Brun NE, Thomson AJ (2007) Superoxide-mediated amplification of the oxygen-induced switch from [4Fe-4S] to [2Fe-2S] clusters in the transcriptional regulator FNR. Proc Natl Acad Sci U S A 104: 2092–2097.
10. Crack JC, Green J, Hutchings MI, Thomson AJ, Le Brun NE (2012) Bacterial iron-sulfur regulatory proteins as biological sensor-switches. Antioxid Redox Signal 17: 1215–1231.
11. Constantinidou C, Hobman JL, Griffiths L, Patel MD, Penn CW, et al. (2006) A reassessment of the FNR regulon and transcriptomic analysis of the effects of nitrate, nitrite, NarXL, and NarQP asEscherichia coliK12 adapts from aerobic to anaerobic growth. J Biol Chem 281: 4802–4815.
12. Salmon K, Hung SP, Mekjian K, Baldi P, Hatfield GW, et al. (2003) Global gene expression profiling inEscherichia coliK12. The effects of oxygen availability and FNR. J Biol Chem 278: 29837–29855.
13. Kang Y, Weber KD, Qiu Y, Kiley PJ, Blattner FR (2005) Genome-wide expression analysis indicates that FNR ofEscherichia coliK-12 regulates a large number of genes of unknown function. J Bacteriol 187: 1135–1160. 14. Iuchi S, Lin EC (1991) Adaptation ofEscherichia colito respiratory conditions:
regulation of gene expression. Cell 66: 5–7.
16. Georgellis D, Kwon O, Lin EC (2001) Quinones as the redox signal for the arc two-component system of bacteria. Science 292: 2314–2316.
17. Salmon KA, Hung SP, Steffen NR, Krupp R, Baldi P, et al. (2005) Global gene expression profiling inEscherichia coli K12: effects of oxygen availability and ArcA. J Biol Chem 280: 15084–15096.
18. Liu X, De Wulf P (2004) Probing the ArcA-P modulon ofEscherichia coliby whole genome transcriptional analysis and sequence recognition profiling. J Biol Chem 279: 12588–12597.
19. Becker S, Holighaus G, Gabrielczyk T, Unden G (1996) O2as the regulatory signal for FNR-dependent gene regulation inEscherichia coli. J Bacteriol 178: 4515–4521.
20. Marshall FA, Messenger SL, Wyborn NR, Guest JR, Wing H, et al. (2001) A novel promoter architecture for microaerobic activation by the anaerobic transcription factor FNR. Mol Microbiol 39: 747–753.
21. Alexeeva S, Hellingwerf KJ, Teixeira de Mattos MJ (2002) Quantitative assessment of oxygen availability: perceived aerobiosis and its effect on flux distribution in the respiratory chain ofEscherichia coli. J Bacteriol 184: 1402– 1406.
22. Gao R, Stock AM (2013) Probing kinase and phosphatase activities of two-component systems in vivo with concentration-dependent phosphorylation profiling. Proc Natl Acad Sci U S A 110: 672–677.
23. Myers KS, Yan H, Ong IM, Chung D, Liang K, et al. (2013) Genome-scale analysis ofEscherichia coliFNR reveals complex features of transcription factor binding. PLoS Genet 9: e1003565.
24. Grainger DC, Aiba H, Hurd D, Browning DF, Busby SJ (2007) Transcription factor distribution inEscherichia coli: studies with FNR protein. Nucleic Acids Res 35: 269–278.
25. Robison K, McGuire AM, Church GM (1998) A comprehensive library of DNA-binding site matrices for 55 proteins applied to the completeEscherichia coli
K-12 genome. J Mol Biol 284: 241–254.
26. Moore LJ, Mettert EL, Kiley PJ (2006) Regulation of FNR dimerization by subunit charge repulsion. J Biol Chem 281: 33268–33275.
27. Williams SM, Wing HJ, Busby SJW (1998) Repression of transcription initiation by theEscherichia coliFNR protein: repression by FNR can be simple. FEMS Microbiol Lett 163: 203–208.
28. Partridge JD, Sanguinetti G, Dibden DP, Roberts RE, Poole RK, et al. (2007) Transition ofEscherichia colifrom aerobic to micro-aerobic conditions involves fast and slow reacting components. J Biol Chem 282:11230–11237. 29. Peercy BE, Cox SJ, Shalel-Levanon S, San K-Y, Bennett G (2006) A kinetic
model of oxygen regulation of cytochrome production in Escherichia coli. J Theoretical Biol 242: 547–563.
30. Tolla DA, Savageau MA (2010) Regulation of aerobic-to-anaerobic transitions by the FNR cycle inEscherichia coli. J Mol Biol 397: 893–905.
31. Tolla DA, Savageau MA (2011) Phenotypic repertoire of the FNR regulatory network inEscherichia coli. Mol Microbiol 79: 149–165.
32. Nelson DE, Young KD (2000) Penicillin binding protein 5 affects cell diameter, contour, and morphology ofEscherichia coli. J Bacteriol 182: 1714–1721. 33. Greenough C, Worth D, Chin S, Holcombe M, Coakley S (2008) The
exploitation of parallel high performance systems in the FLAME agent-based simulation framework. RAL Technical Reports RAL-TR-2008–022. 34. Richmond P, Walker D, Coakley S, Romano D (2010) High performance
cellular level agent-based simulation with FLAME for the GPU. Brief Bioinform 11: 334–347.
35. Spiro S, Guest JR (1988) Inactivation of the FNR protein ofEscherichia coliby targeted mutagenesis in the N-terminal region. Mol Microbiol 2: 701–707. 36. Miller JH 1972. Assay ofb-galactosidase. InExperiments in molecular genetics(ed.
Miller JH), pp. 352–355 New York, NY: Cold Spring Harbor Laboratory. 37. Wyborn NR, Messenger SL, Henderson RA, Sawers G, Roberts RE, et al.
(2002) Expression of theEscherichia coli yfiDgene responds to intracellualr pH and reduces the accumulation of acidic metabolic end products. Microbiology 148: 1015–1026.