www.hydrol-earth-syst-sci.net/11/1811/2007/ © Author(s) 2007. This work is licensed under a Creative Commons License.
Earth System
Sciences
Assessment of alternative land management practices using
hydrological simulation and a decision support tool: Arborea
agricultural region, Sardinia
P. Cau1and C. Paniconi2
1Center for Advanced Studies, Research and Development in Sardinia (CRS4), Parco Scientifico e Tecnologico, POLARIS, Edificio 1, C.P. 94, 09010 Pula (Cagliari), Italy
2Institut National de la Recherche Scientifique – Centre Eau, Terre et Environnement (INRS-ETE), Universit´e du Qu´ebec, 490 de la Couronne, Qu´ebec, G1K 9A9, Canada
Received: 8 January 2007 – Published in Hydrol. Earth Syst. Sci. Discuss.: 10 April 2007 Revised: 8 August 2007 – Accepted: 16 November 2007 – Published: 23 November 2007
Abstract. Quantifying the impact of land use on water sup-ply and quality is a primary focus of environmental manage-ment. In this work we apply a semidistributed hydrological model (SWAT) to predict the impact of different land man-agement practices on water and agricultural chemical yield over a long period of time for a study site situated in the Arborea region of central Sardinia, Italy. The physical pro-cesses associated with water movement, crop growth, and nutrient cycling are directly modeled by SWAT. The model simulations are used to identify indicators that reflect crit-ical processes related to the integrity and sustainability of the ecosystem. Specifically we focus on stream quality and quantity indicators associated with anthropogenic and nat-ural sources of pollution. A multicriteria decision support system is then used to develop the analysis matrix where wa-ter quality and quantity indicators for the rivers, lagoons, and soil are combined with socio-economic variables. The DSS is used to assess four options involving alternative water-sheds designated for intensive agriculture and dairy farming and the use or not of treated wastewater for irrigation. Our analysis suggests that of the four options, the most widely acceptable consists in the transfer of intensive agricultural practices to the larger watershed, which is less vulnerable, in tandem with wastewater reuse, which rates highly due to water scarcity in this region of the Mediterranean. More gen-erally, the work demonstrates how both qualitative and quan-titative methods and information can assist decision making in complex settings.
Correspondence to:P. Cau ([email protected])
1 Introduction
1.1 Context
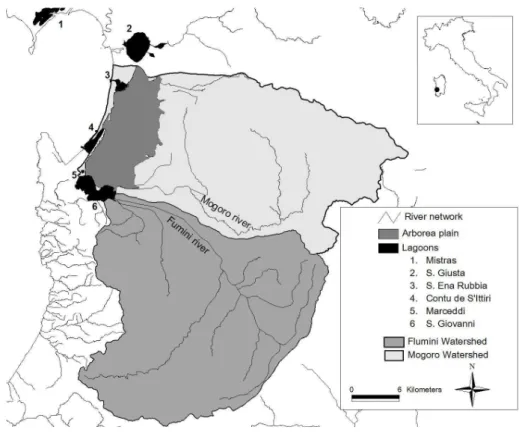
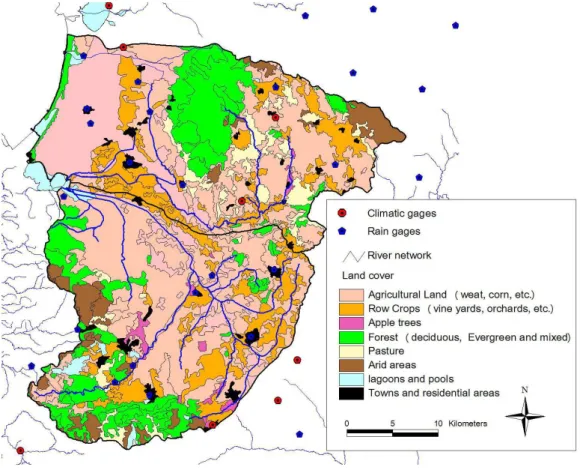
Fig. 1.Location of the study area.
1.2 Description of the study area
Situated in the western Mediterranean Sea, the climate of the Arborea plain is typical Mediterranean, with long, hot, dry summers and short, mild, rainy winters. The prevailing wind is north-westerly and blows over Sardinia in all sea-sons. Several natural permanent pools or lagoons (Mistras, Marceddi, S. Giovanni, S’Ena e Rubbia, Corru de S’Ittiri, and S. Giusta) and some seasonal ones which dry up com-pletely during the summer are situated in the plain along the coast. The salt content varies significantly from one lagoon to another, the Mistras lagoon being the one with the highest salt content and the S. Giusta lagoon the lowest. The lagoons are recharged directly by rainfall, they collect surface runoff, and they interact with the rivers, groundwater, and the sea. The lagoons cover an area of about 60 km2, and comprise one of the largest wetlands in Europe. The main rivers (the Mogoro Diversi and the Flumini Mannu) are generally fast flowing, with a relatively high water volume in winter that reduces to a trickle in summer. Both rivers discharge their waters directly to the Marceddi lagoon (Fig. 1).
During the last decades, the plain has gone through pro-found changes. The current situation, not uncommon in Mediterranean areas, is the product of many years of poor management policies that often neglected the need to pro-tect water and soil resources. Historically, the coastal part of the Arborea plain was an insalubrious morass, sparsely
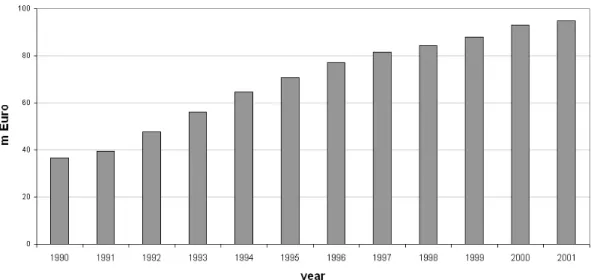
Fig. 2.Assegnatari Associati Arborea (3A) co-operative income in the period 1990–2001.
population, is fish farming, with two fisheries present in the lagoons. The fishermen are attentive to the conservation of the habitat and the management of the lagoons, and it is easy to appreciate how these can be adversely impacted by agri-cultural activities in the plain and further upstream.
1.3 Objectives of the study
Adequate water supply is a major problem in Mediterranean areas, with its hot dry summers and recurring droughts. The most recent prolonged drought (ending in 2003) led to se-vere rationing measures on urban, agricultural, and indus-trial water use. A substantial increase in groundwater with-drawal, much of it unregulated, has consequently been doc-umented, especially along coastal areas. The aquifer sys-tem in the Arborea region is comprised of two main units, a shallow phreatic aquifer (few tens of meters) and a deeper aquifer (few hundreds of meters), separated by an aquitard of variable thickness. Due to inadequate water management policies and aquifer overpumping, the lower aquifer unit has been heavily contaminated by seawater intrusion. Because of the high permeability of the soil used to cover the morass, the shallow phreatic aquifer is also polluted, in this case by fertil-izers, pesticides, and nitrates from the zootechnical and agri-cultural activities. Thus soils, groundwaters, streams, and lagoons are highly impacted from the intensive water use ac-tivities in the Arborea region. To reduce the impact of the fer-tilizers and pesticides on the phreatic aquifer of the Arborea plain, agro-zootechnical production in the region needs to be limited and/or wastewater needs to be collected and routed to a treatment plant.
Due to the economic importance of the farming activi-ties, the land use options that are being evaluated to allevi-ate wallevi-ater contamination, without unduly harming or altering
2 Methodology
2.1 SWAT model
The hydrological model used is the Soil and Water Assess-ment Tool (SWAT), version 2000 (Di Luzio et al., 2001), a watershed-scale model developed by the USDA Agricul-tural Research Service (ARS). SWAT can be used to pre-dict the impact of land management practices on water, sed-iment, and agricultural chemical yields in large complex wa-tersheds with varying soils, land use, and management con-ditions over long periods of time. The physical processes associated with water movement, sediment movement, crop growth, nutrient cycling, and other phenomena are directly modeled by SWAT (Neitsch et al., 2001). SWAT provides water balance estimates at the catchment scale and simulates the gradual build up of nitrates, phosphorous, and pesticides on downstream water bodies. The fate and transport of nu-trients and pesticides in a watershed depends on the trans-formations the compounds undergo in the soil (land phase) and stream environment (routing phase). SWAT models the complete nutrient cycle for nitrogen and phosphorus as well as the degradation of pesticides within each hydrologic re-sponse unit (HRU) of the watershed. Hydrologic rere-sponse units are portions of subbasins that possess unique soil/land use/management attributes. This subdivision of a watershed enables the model to reflect differences in evapotranspiration, runoff, movement and transformation of chemicals, etc., for various crops and soils. This increases accuracy and gives a much better physical description of the catchment’s water balance and water quality.
Hydrological processes are first simulated in SWAT for the land phase at the HRU spatial unit. This yields the water, sed-iment, nutrient, and pesticide loadings to the main channel in each subbasin. In a second phase, the water, sediments, etc are routed through the channel network of the watershed to the outlet. For each subbasin there is one reach, one outlet, and many HRUs. Water quality and quantity states are given for each outlet at a daily temporal scale.
The nitrogen cycle, modeled by SWAT, is a dynamic sys-tem that includes the water, atmosphere and soil. Nitrogen’s ability to vary its valence state makes it a highly mobile ele-ment, and thus predicting the movement of different nitrogen compounds in the soil is critical to the successful manage-ment of this elemanage-ment in the environmanage-ment. The three major forms of nitrogen in mineral soils are organic nitrogen as-sociated with humus, mineral forms of nitrogen held by soil colloids, and mineral forms of nitrogen in solution. SWAT allows nitrogen to be added to the soil by fertilizer, manure, or residue application, fixation by symbiotic or nonsymbi-otic bacteria, and rain, while it can be removed from the soil by plant uptake, leaching, volatilization, denitrification, and erosion (Neitsch et al., 2001). Although plant phosphorus de-mand is considerably less than nitrogen dede-mand, and its sol-ubility is limited in most environments, phosphorus is also
required for many essential functions. The most important of these is its role in energy storage and transfer. Energy obtained from photosynthesis and metabolism of carbohy-drates is stored in phosphorus compounds for later use in growth and reproductive processes. The three major forms of phosphorus in mineral soils modeled by SWAT are or-ganic phosphorus associated with humus, insoluble forms of mineral phosphorus, and plant-available phosphorus in soil. Phosphorus may be added to the soil by fertilizer, manure, or residue application. Phosphorus combines with other ions to form a number of insoluble compounds that precipitate out of solution. These characteristics contribute to a build-up of phosphorus near the soil surface that is readily avail-able for plant uptake, erosion, and transport in surface runoff. Sharpley and Syers (1979) observed that surface runoff is the primary mechanism by which phosphorus is exported from most catchments.
2.2 MULINO DSS
The decision support system used in this study is the MULINO-DSS (mDSS), a DSS developed within the context of an international project on MULtisectorial, INtegrated, Operational decision support for sustainable use of water re-sources at the catchment scale (Giupponi et al., 2004). mDSS is based on the Driving forces–Pressures–State–Impact– Responses (DPSIR) framework, introduced by the European Environmental Agency for environmental monitoring pur-poses. This approach is useful in conceptualizing and for-malizing the problem at hand. The conceptual phase consists in the identification of the DPS chains and the resulting indi-cators. The decision problem is therefore described and the cause-effect relation between the relevant socio-economic and environmental indicators is assessed. This task is par-ticularly complex in water resources conflicts where the lack of a multisectorial perspective can result in socio-economic damages to the different local users. The multicriteria deci-sion analysis in mDSS consists in comparing a limited num-ber of options, described by their attributes. An analysis matrix is constructed which contains the raw performance measures of the different options. The different options are then compared using a standardization procedure to generate values on a uniform scale. Since the multiple option perfor-mances are to be reduced to a single value or score, decision rules based on aggregation procedures are applied (Mysiak et al., 2005).
The decision context for the Arborea study has been con-ceptualized using the DPSIR approach, identifying the socio-economic and environmental indicators considered important to this problem. The four land use options assessed in the mDSS are:
(from a water treatment plant to be built downstream of the basin) for irrigation;
Option 2. Land exploitation of the Mogoro basin and no reuse of treated wastewater (in this case the treated wastewa-ter is discharged directly to the river);
Option 3. Land exploitation of the Flumini basin and reuse of treated wastewater for irrigation;
Option 4. Land exploitation of the Flumini basin and no reuse of treated wastewater.
The end users or stakeholders involved in the decision pro-cess include the regional authorities for water resources man-agement, the local municipalities, the dairy farm association (3A cooperative), private farmers, and the managers of the lagoon fisheries.
The driving forces are the need to use the land for dairy and grain farming; the pressures are the use of fertilizers and pesticides, the water demand for irrigation, other agricultural activities that produce or release nutrients, and the release of wastewater from the treatment plant; the states are the water volumes needed for irrigation to optimize crop growth, the levels of nitrates, phosphorous, and pesticides in the rivers, the average streamflow volume and its variability, the cost of the treatment plant and irrigation infrastructure, the cost of irrigation water, and the risk for farmers in transferring their production activities, including potential conflicts be-tween users and income losses/gains. The water volume for optimal crop growth is estimated by SWAT by supplying the soil water deficit on a daily basis. Streamflow and phospho-rous, pesticide, and nitrate concentrations in the rivers are also computed by SWAT at the outlet of the Mogoro and Flumini basins. The economic parameters are estimated by examining costs and benefits. The cost of a treatment plant is assessed on the basis of the pollutant load generated from the zootechnical compartment, using the empirical formula Ct=200×AEwhereCtis the cost (Euro) andAEis the load expressed in equivalent inhabitants (AATO, 2001). The cost of the irrigation pipelines depends on their length, the de-sired flow rate, and the geomorphology of the territory. This cost has likewise been assessed using empirical formulas and values from the literature (Milano, 1996). In southern Italy the cost to the community of 1 m3of treated water is about 0.25 Euro, while fresh water costs about 0.45 Euro/m3. Other socio-economic indices (the risk for farmers in transferring their production activities, including potential conflicts be-tween users and income losses/gains) were assessed through questionnaires aimed at assessing how stakeholders and lo-cal municipalities perceive the alternative management poli-cies. These questionnaire responses were then transformed into numerical form for input to the evaluation matrix.
2.3 Model setup and calibration 2.3.1 Soil and land cover
The watershed of the Flumini Mannu river is 613 km2 and varies in elevation from 0 to 1236 m a.s.l. About 60% of its territory can be used for agriculture, about 5% is used for pasture, and the rest is characterized by forest and bush. The watershed of the Mogoro Diversi river is 369 km2, and its to-pography ranges from 0 to 760 m a.s.l. About 65% of its ter-ritory can be used for agriculture, about 12% is used for pas-ture, and the rest is forest and bush. The Flumini Mannu and Mogoro Diversi rivers discharge their waters to the Marceddi lagoon. Acquisition and analysis of extensive soil and land use data for the Mogoro and Flumini basins was carried out with a geographical information system using data formats and procedures compatible with SWAT. The first step was to partition the watersheds into subunits. SWAT allows several different subunits or objects to be defined within a water-shed: subbasins, HRUs, ponds, reaches/channels, and wet-lands. Information about the geometry of the basins was ex-tracted from a 400 m elevation grid and the river network. The minimum drainage area assessed by the AVSWAT pre-processing tool was 2500 ha. With this threshold the Mogoro and Flumini watersheds were subdivided into 7 and 11 sub-basins, respectively.
Information about soil properties was obtained from a 1:250 000 soil vector map where each cartographic unit was associated with one or two delineations corresponding to subgroups of the USDA soil taxonomy. For the characteriza-tion of the geopedologic facies of the area we referred to the Soil Map of Sardinia (Aru et al., 1991) and the Land Clas-sification for Irrigation of Sardinia (Arangino et al., 1986). From these studies, a collection and evaluation of the irri-gation needs, based on a census of all agronomic and geo-pedological elements, was derived. About 40 representative soil profiles were recognized, described, and classified ac-cording to USDA and FAO guidelines. Physical and hydro-geological properties of the soil profiles were related to the corresponding cartographic units of the pedologic map us-ing taxonomy categories. Classical pedotransfer functions were used to calculate dependent variables (field capacity, permanent wilting point, Available Water Capacity, saturated hydraulic conductivity) from the percentages of sand, silt, and clay content. Complementary information was obtained, for the same soil classes, using the State Soil Geographic (STATSGO) database (USDA and NRCS, 1994). All of this information was cast into a soil database formatted for SWAT. This geodatabase, built on the spatial linkage between the soil map and the soil database, drastically reduced the amount of GIS initialization.
Fig. 3.Land cover map for the Flumini and Mogoro basins.
Table 1.Monthly (subscripts 1 January to 12 December) analysis ofPW/W(probability that a wet day is followed by a wet day) andPD/W
(probability that a dry day is followed by a wet day).
PW/W1 PW/W2 PW/W3 PW/W4 PW/W5 PW/W6 PW/W7 PW/W8 PW/W9 PW/W10 PW/W11 PW/W12
0.5792 0.5736 0.5261 0.4432 0.4160 0.3190 0.2127 0.2962 0.3588 0.4875 0.5736 0.6011
PD/W1 PD/W2 PD/W3 PD/W4 PD/W5 PD/W6 PD/W7 PD/W8 PD/W9 PD/W10 PD/W11 PD/W12
0.2041 0.2114 0.1728 0.1644 0.1005 0.0574 0.0223 0.0372 0.1119 0.1871 0.2325 0.2638
on evapotranspiration. In this study we used the CORINE Land Cover 1:100 000 vector map (EEA, 2000), a geograph-ical database describing vegetation and land use in 44 classes grouped into three nomenclature levels. The resulting soil and land use maps for the Mogoro and Flumini watersheds are shown in Figs. 3 and 4. With this data, the Mogoro and Flumini subbasins were subdivided into 125 and 276 HRUs, respectively.
2.3.2 Climate characterization
The climate of the Arborea region is typical Mediterranean with hot dry summers and short rainy winters, except at high altitudes, and prevailing north-westerly winds. Average an-nual temperatures range from 18◦C along the coast to 14◦C inland. Temperature and solar radiation data were gathered from 7 climatic gages within the study area (Fig. 3). Annual average rainfall is 680 mm, with a peak in December and a minimum in July. The SWAT model requires daily precipita-tion records, but the available pluviometric data for Sardinia is accessible on a monthly basis (EAF, 1996). To downscale the monthly data to synthetic daily precipitation time series, various alternatives were analyzed (Cau et al., 2002). The ap-proach selected is a variation of the method proposed by De Groen and Savenije (2000) based on Markov chains. A simi-lar approach (Nicks, 1974) is also used in SWAT to generate synthetic precipitation records on a daily basis. The genera-tor works in two steps. First it determines if dayiis wet or dry: a random numberro, between 0 and 1, is generated and compared withPW/W(probability that a wet day is followed by a wet day) if day(i−−1)is wet, or conversely withPD/W (probability that a dry day is followed by a wet day) if day (i− −1)is dry. The following skewed distribution is then used to generate the precipitation amount:
R=µ+2σ
g
h
SND−g
6 g 6
+1i3−1
where SND=cos(6.238r2)(−2ln r1)1/2is the normal deviate calculated for the day,R is the amount (mm) of daily rain-fall on a given day,µis the mean daily rainfall (mm) for the month,σis the standard deviation of daily rainfall (mm),gis the skew coefficient for daily precipitation in the month, and r1andr2are random numbers. To calculate, for each station and each month of the year, the probability of a wet day to be followed by another wet day (PW/W) or, conversely, a dry
day by a wet one (PD/W), we used the available daily data registered on a cluster of 175 rain gages throughout Sardinia with at least 30 years of data within the time period of inter-est. The daily synthetic precipitation for each month of each year of each station was then scaled to match the monthly registered rainfall. In this way, the data series for the 20 rain-fall gages closest to the two basins under study (Fig. 3) were downscaled to daily data series. The AVSWAT GIS interface reads the location of the climatic and rainfall gages and auto-matically associates to each HRU the nearest corresponding data time series. Table 1 reports thePW/WandPD/Wvalues for the study area.
Precipitation is the main driver of hydrological processes, and SWAT outputs greatly depend on how accurate the pre-cipitation data is. The model has been run with the generated daily time series and with measured precipitation for the Sar-dinian basins which contain operational stations (Cau et al., 2002). The model outputs were then compared in order to estimate the uncertainty introduced by such a downscaling procedure. The water budget results for a 20-year simula-tion period showed an average difference of 7% (with a range from 0.1% to 20%). Summer periods, characterized by few but intense events, were the most critical. The correlation co-efficient for monthly water budget estimates using measured and synthetic data was 0.94, with no systematic error. 2.3.3 Scenarios
The SWAT model was run on both the Mogoro and Flumini basins to evaluate the water cycle and the fate of nutrients and pesticides for the following scenarios:
1. current conditions (no intensive agriculture on the basins, no wastewater reuse);
2. land exploitation with reuse of treated water (DSS op-tions 1 and 3);
3. land exploitation and no reuse of the treated water (DSS options 2 and 4).
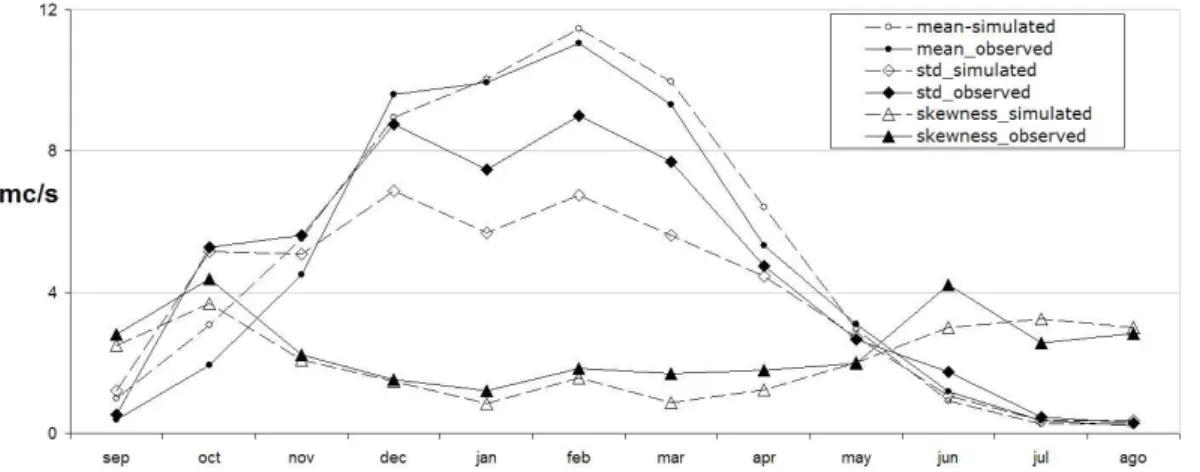
Fig. 5. Comparison of measured and simulated monthly streamflow statistics (mean, standard deviation, and skewness) for the 70-year regional calibration.
The CORINE land cover possesses little information about land management practices and its changes (e.g. seasonal and yearly). Furthermore its low spatial resolution is not ideal when examining intensive agriculture applied at a par-cel scale. Diffuse pressures must be consequently assessed using heterogeneous information sources. In this study a part of the work was to integrate and cross validate the land use spatial information of the CORINE map (to each combi-nation of land use/soil there corresponds 1 HRU within the subbasin) with information from regional and local agencies about agricultural practices (areas cultivated, crop types, etc) at the local scale. From this investigation we were able to ob-tain data concerning fertilizer and pesticide types and quan-tities in each subbasin that could be input to the model.
In our land exploitation scenarios we focused on a 20 km2 parcel that is to be allocated, in the 4 options, to the new agri-cultural practices. The auto irrigation initialisation option in SWAT was used; this operation initialises irrigation within the HRU. Auto irrigation applies water whenever the plant experiences a user-specified level of water stress. Corn and grain crops were considered. For each day of simulation, po-tential plant growth (i.e. plant growth under ideal growing conditions) is calculated. Ideal growing conditions consist of adequate water and nutrient supply and a favourable climate, and differences in growth between plant species are defined by the parameters contained in the plant growth database (Neitsch et al., 2001).
Two types of fertilizers were applied, 18-00 and 46-00-00. These are characterized by a fraction of mineral N (NO3and NH4)in fertilizer (kg min-N/kg fertilizer) equal to 0.18 and to 0.46, respectively, and a fraction of mineral P in fertilizer (kg min-P/kg fertilizer) equal to 0.202 and to 0.0, respectively. In the model 120 kg/ha of 18-46-00 fertilizer was applied in January, while 60 kg/ha of 46-00-00 was ap-plied in February. The pesticide used was plus-2, apap-plied at the end of June. Pesticides are toxic by design, and there is a
natural concern about their impact on human health and en-vironmental quality. The fate and transport of a pesticide is governed by properties such as solubility in water, volatil-ity, and ease of degradation. The algorithms that SWAT uses to model pesticide movement and fate are adapted from GLEAMS (Leonard et al., 1987).
2.3.4 Calibration
The model calibration followed a regional scale approach. The soil and land cover parameterizations described in sec-tion 2.3.1 are not restricted to a single watershed, as simi-lar soil and land cover types are found in different basins of the region. All available streamflow data, from a total of 31 gages within watersheds adjacent to the Flumini and Mogoro basins, were used for the calibration of the model (Cau et al., 2002). Monthly streamflow and reservoir water level histori-cal records were used as control values. The soil parameters adjusted during the calibration process, within ranges sug-gested in the literature, were AWC (available water capac-ity,±0.04),CN (curve number,±10%), and ESCO (a com-pensation factor that controls the evapotranspiration, up to 1) (Eckhardt and Arnold, 2001; Vandenberghe et al., 2001). A total of 120 calibration parameters were activated (40 soil profiles×3 parameters). These parameters affect the
parti-tioning between baseflow, runoff, percolation, and evapo-transpiration, as well as the transport of sediments, nutrients, and pesticides. Changes to the values of these parameters were accepted only if an overall improvement in streamflow was achieved compared to observed data. This was deter-mined using the Nash-Sutcliffe index
KN S=1−
N
P
i=1
(Q1,i−Q2,i)2
N
P
i=1
(Q1,i−Q1)2
Fig. 6.Water budget calculation [mm/month] for the case of land exploitation (right) and for current land use (left) for the Flumini (above) and Mogoro (below) basins. While precipitation is unchanged, evapotranspiration (line with empty points) and streamflow (line with full points) are affected by the new management practices.
whereNis the number of years of observed streamflow data (70 in our case), Q1,i is the observed streamflow for year i, andQ2,i is the corresponding simulated streamflow. The Nash-Sutcliffe index ranges between -∞and 1, with a
per-fect match (KN S=1) whenQ1,i=Q2,ifor alli.
The calibration proceeded in the following manner: 1 (ini-tial state), the SWAT model was run on 16 watersheds to ob-tain an initial comparison between simulated and observed streamflows; 2 (calibration), a subset of 3 watersheds pos-sessing all of the soil profiles was used to calibrate the three soil parameters; 3 (validation), the adjusted parameters were accepted only if they improved the quality of the simulation for all 16 watersheds compared to the initial state.
The best-fit parameter values for our model implementa-tion at a regional scale produced a Nash-Sutcliffe index of 0.77, indicating a reasonably good match between simulated and observed streamflow rates. In Fig. 5 we also compare the measured and simulated monthly streamflow statistics (mean, standard deviation, and skewness) for the 70-year re-gional calibration. The annually averaged streamflow values of model output and measured data for the 70-year time pe-riod were 5.0 and 4.7 m3/s, respectively, while the annually averaged standard deviations were 3.8 and 4.5 m3/s,
respec-tively. In several simulations using monthly streamflow data we were also able to accurately capture the timing and mag-nitude of seasonal water yields (Cau et al., 2002).
3 Results
3.1 Hydrological model simulations
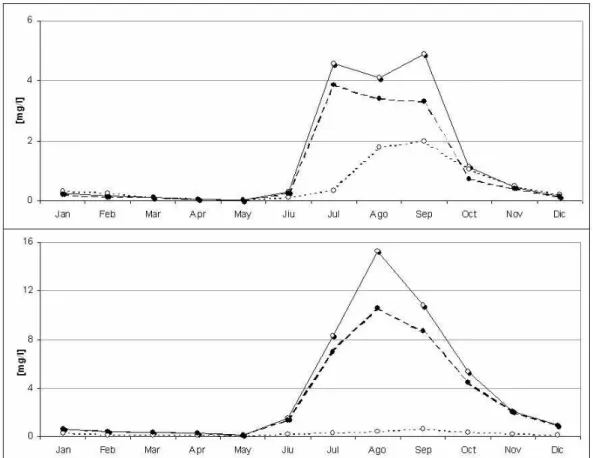
Fig. 7.Nitrate concentrations for the Flumini Mannu (above) and Mogoro Diversi (below) rivers for case 1 (dotted line), case 2 (solid line), and case 3 (dashed line).
Fig. 8.Pesticide concentrations for the Flumini Mannu (dotted line) and Mogoro Diversi (solid line) rivers.
The fate and transport of nutrients and pesticides in a wa-tershed depend on the transformations the compounds un-dergo in the soil and stream environment. In general
Table 2. The metacriteria and indicators for the Arborea application, together with the “raw” values (before standardization to a common scale) of the indicators for each of the four options being analyzed and the weights assigned to each indicator.
Indicators Option 1 Option 2 Option 3 Option 4 Metacriteria Weight
Nutrient levels in the rivers (mg/l) 3.48 3.07 1.35 1.05 Environmental 0.2 Pesticide levels in the rivers (mg/l) 0.0174 0.017 0.0024 0.0021 Environmental 0.2 Mean streamflow (m3/s) 4.15 4.16 4.56 4.59 Environmental 0.15 Streamflow standard deviation 1.29 1.29 1.67 1.67 Environmental 0.1 Water volume needed for irrigation
(mm/year) 64.5 64.5 140.9 140.9 Environmental 0.05
Total cost (EURO) 1 300 000 1 104 000 1 353 900 1 143 900 Economic 0.05 Cost/load (for irrigation water) (EURO) 100 000 258 000 383 500 563 600 Economic 0.05 Risk for farmers and social conflict
between users (high, 0 to low, 1) 0.6 0.2 0.8 0.4 Socio-economic 0.1 Potential income losses/gains (high, 0 to low, 1) 0.6 0.3 0.7 0.4 Socio-economic 0.1
management practices, meteorological stresses, and soil and stream physical characteristics. Simulated values show that their peak summer concentrations are higher in the Mogoro river for the two land exploitation cases than in the Flumini river (Figs. 7 and 8). This may be due to the longer sub-surface and overland flow pathways and the higher water volumes discharged by the larger Flumini basin, thereby di-luting contaminants to a lower concentration, and to greater runoff in the Mogoro basin due to its higher rainfall. For pesticides, given identical plant morphology and pesticide solubility characteristics assigned to the 20 km2 parcels in the two basins, the fraction washed off will be a function of the timing and intensity of rainfall events (in the model wash-off will occur when the amount of precipitation on a given day exceeds 2.54 mm). The peak nutrient and pesti-cide concentrations for both basins occurs in the dry sum-mer season, as is to be expected since this corresponds to the period when flows are lowest, temperatures highest, and agricultural activities most intense. The fate of nutrients in the stream environment will depend strongly on temperature, dissolved oxygen (DO) and algal photosynthesis/respiration. In fact DO concentrations increase with turbulence and de-crease when temperature inde-creases. In aerobic water, there is a stepwise transformation from organic nitrogen to ammo-nia, to nitrite, and finally to nitrate. The phosphorus cycle is similar to the nitrogen cycle (the death of algae transforms algal phosphorus into organic phosphorus which can be min-eralized to soluble phosphorus and made available for uptake by algae, or may be removed from the stream by settling).
The presence of the treatment plant has the main effect of lowering the concentration of pollutants in both rivers. Wa-ters routed to the stream, in the simulation, are less polluted than the waters of the streams. This also suggests that in the summer, point source pollution can become predominant in semiarid region due to the low level of natural streamflows.
3.2 DSS application
The European Union Water Framework Directive aims to en-sure that water use or management decisions take into ac-count the views of the many stakeholders who will be im-pacted by the decision, in order to assess as fully as possi-ble these impacts and identify appropriate future responses as necessary. To support such an assessment, the mDSS is applied to evaluate the water use options based on estimates of pertinent environmental and socio-economic indicators or criteria. For the Arborea study these indicators are the states identified earlier in the DPSIR chain, and we grouped them into metacriteria and criteria (Table 2). A hierarchical struc-ture is adopted so as to assign to the environmental, social, and economic criteria different weights in the analysis. The weights we used in this study are the outcome of discussions with various local stakeholders, municipalities, and water managers, and reflect their perception of the environmental problem at hand. The weights we assigned are 0.7, 0.2, and 0.1 respectively for the environmental, social, and economic metacriteria.
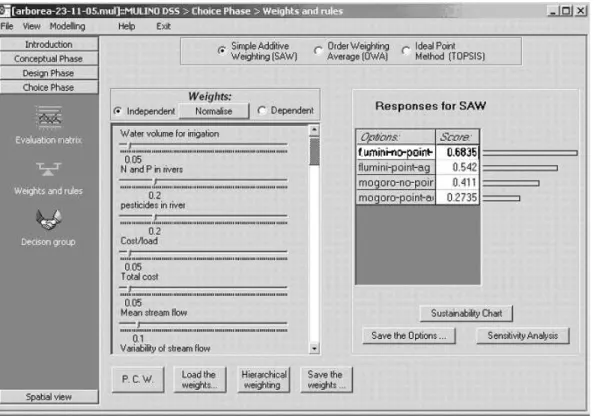
Fig. 9.The mDSS interface. In order to evaluate the options, the simple additive weighting (SAW) method was used. The results indicate that option 3, the Flumini basin with wastewater reuse (“flumini-no-point-ag”) is best, with a score of 0.6835.
this standardization procedure, scaling all values in the inter-val [0,1].
After standardization, the relative performance of the four options is assessed using a value/utility function. The value function is a mathematical representation of human judge-ments. It translates the performances of the options into value scores, which represent the degree to which deci-sion objectives are attained. The simple additive weighting method (SAW) in mDSS is then used to obtain an aggregate or global score for the different options (Fig. 9) and to exam-ine how changing the weights affects the scores.
The land use options involving the Flumini basin (options 3 and 4) scored highest, with option 3 (wastewater reuse) giving a more favorable outcome compared to option 4. The Flumini options scored higher than the Mogoro options mainly because of environmental criteria (lower pesticide and nutrient levels and a slightly higher mean streamflow). Option 3 scored higher than option 4 mainly on account of socio-economic criteria, as diffuse pollution from land man-agement practices is little affected by the reuse of water or routing this water to the stream. These socio-economic in-dicators reflect how stakeholders and managers perceive the problem at hand, valuing highly the concept of wastewater reuse due to water scarcity (common in Mediterranean areas) and due to widespread problems with contaminated waters from point and nonpoint releases of contaminants.
4 Conclusions
Land use changes and irrigation schemes need to be managed so as to minimize the risk of water and soil contamination and to allocate available water as efficiently as possible with-out adverse impacts on downstream uses. Water resources management is a complex task that requires data, often in very qualitative form, from different disciplines. Amongst these disciplines, hydrologic simulation models can provide inputs to the decisional process that relate to water quality and quantity in soils and streams in response to different land exploitation schemes. Once translated into indicators or cri-teria that are pertinent to the problem at hand, the data and other information from various sources can be analyzed in a decision support system to evaluate which management op-tions are best under given circumstances, and to examine how sensitive the DSS results are to various factors, such as the distribution of relative weights.
reutilizing treated wastewater for crop irrigation. The physi-cal processes associated with water movement, crop growth, and nutrient cycling were considered in the distributed hy-drological model, as these are essential to simulating the gradual build-up of pollutants due to different land manage-ment practices. Based on a weighting distribution that em-phasized the environmental criteria derived from the hydro-logical model (in part because of lack of concrete data on socio-economic parameters), the DSS analysis showed the larger of the two watersheds to be the most favourable site for the land use relocation. This by no means exhaustive anal-ysis nonetheless illustrates the manner in which a decision support system can be applied to a regional water manage-ment problem and how hydrologic simulations can usefully contribute quantitative estimates needed in multicriteria anal-yses.
Acknowledgements. This work has been partially funded by the European Commission (contract EVK1-CT-2000-00082) and by the Sardinian Regional Authorities.
Edited by: L. A. Swatuk
References
Abel, D. J., Yap, S. K., Ackland, R., Cameron, M. A., Smith, D. F., and Walker, G.: Environmental decision support system project: an exploration of alternative architectures for geographical infor-mation systems, Int. J. Geogr. Inf. Syst., 6(3), 193–204, 1992. Arangino, F., Aru, A., Baldaccini, P., and Vacca, S.: I suoli delle
aree irrigabili della Sardegna, Piano Generale delle Acque, Re-gione Autonoma della Sardegna, Cagliari, Italy, 1986.
Aru A., Baldaccini P., and Vacca S.: Nota illustrativa alla carta dei suoli della Sardegna, con carta illustrata 1:250.000, Regione Au-tonoma della Sardegna, Cagliari, Italy, 1991.
AATO: Piano d’Ambito, (http://www.ato5acqua.toscana.it/), Au-torit`a d’Ambito, 2001.
Cau, P., Cadeddu, A., Gallo, C., Lecca, G., and Marrocu, M.: Es-timating available water resources of the Sardinian island using the SWAT model, in: Proceedings of the Second International SWAT Conference, Bari, Italy, 2002.
Chowdary, V. M., Rao, N. H., and Sarma, P. B. S.: Decision sup-port framework for assessment of non-point-source pollution of groundwater in large irrigation projects, Agr. Water Manage., 75(3), 194–225, 2005.
De Groen, M. and Savenije, H. G.: Markov chains at daily timesteps, key to transpiration at monthly timesteps, in: 1st WARFSA/WaterNet Symposium: Sustainable Use of Water Re-sources, Maputo, Mozambique, 2000.
Di Luzio, M., Srinivasan, M., and Arnold J.: ARCVIEW Interface for SWAT2000 – User’s Guide, USDA Agricultural Research Service, Temple, Texas, 2001.
EAF (Ente Autonomo del Flumendosa): Studio dell’Idrologia Su-perficiale della Sardegna (SISS), Cagliari, Italy, 1996.
EEA: CORINE Project, http://dataservice.eea.eu.int/dataservice/, 2000.
Eckhardt, K. and Arnold, J. G.: Automatic calibration of a dis-tributed catchment model, J. Hydrol., 251(1–2), 103–109, 2001. Fedra, K. and Jamieson, D. G.: An object-oriented approach to model integration: a river basin information system example, in: Application of Geographic Information Systems in Hydrology and Water Resources Management, 669–676, IAHS Press, Insti-tute of Hydrology, Wallingford, UK, 1996.
Giupponi, C., Mysiak J., Fassio, A., and Cogan, V.: MULINO-DSS: a computer tool for sustainable use of water resources at the catchment scale, Mathematics and Computers in Simulation, 64, 13–24, 2004.
Heinemann, A. B., Hoogenboom, G., and de Faria, R. T.: Determi-nation of spatial water requirements at county and regional levels using crop models and GIS: An example for the State of Parana, Brazil, Agri. Water Manage., 52(3), 177–196, 2002.
Leonard, R. A., Kniseland, W. G., and Still, D. A.: GLEAMS: groundwater loading effects on agricultural management sys-tems, Transactions ASAE, 30, 1403–1428, 1987.
Milano, V.: Acquedotti, Hoepli, Milano, Italy, 1996.
Mysiak, J., Giupponi, C., and Rosato, P., Towards the development of a decision support system for water resource management, En-vironmental Modelling Software, 20, 203–214, 2005.
Neitsch, S. L., Arnold, J., Kiniry, J. R., and Williams, J. R.: Soil and Water Assessment Tool (SWAT) – Theoretical Documentation, USDA Agricultural Research Service, Temple, Texas, 2001. Nicks, A. D.: Stochastic generation of the occurrence, pattern and
location of maximum amount of daily rainfall, in: Proc. Symp. Statistical Hydrology, 154–171, USDA Misc. Publ. 1275, U. S. Gov. Print Office, Washington, DC, 1974.
Sharpley, A. N. and Syers, J. K.: Phosphorus inputs into a stream draining an agricultural watershed: II. Amounts and relative sig-nificance of runoff types, Water Air Soil Poll., 11, 417–428, 1979.
USDA and NRCS Soil Survey Division: State Soil Geographic (STATSG0) Data Base – Data Use Information, Miscellaneous Publication No. 1492, 1994.
Vandenberghe, V., van Griensven, A., and Bauwens, W.: Sensitiv-ity analysis and calibration of the parameters of ESWAT: Appli-cation to the river Dender, Water Sci. Technol., 43(7), 295–301, 2001.

![Fig. 6. Water budget calculation [mm/month] for the case of land exploitation (right) and for current land use (left) for the Flumini (above) and Mogoro (below) basins](https://thumb-eu.123doks.com/thumbv2/123dok_br/16425080.195548/9.892.151.744.91.553/water-budget-calculation-exploitation-current-flumini-mogoro-basins.webp)