www.solid-earth.net/7/1/2016/ doi:10.5194/se-7-1-2016
© Author(s) 2016. CC Attribution 3.0 License.
Effects of pumice mining on soil quality
A. Cruz-Ruíz1, E. Cruz-Ruíz1, R. Vaca2, P. Del Aguila2, and J. Lugo2
1Instituto de Ingeniería, Universidad Autónoma de Baja California, Mexicali, Baja California, Mexico
2Facultad de Ciencias, Universidad Autónoma del Estado de México, Instituto Literario 100 Toluca, 50 000 Mexico
Correspondence to:J. Lugo ([email protected])
Received: 5 March 2015 – Published in Solid Earth Discuss.: 17 April 2015
Revised: 7 December 2015 – Accepted: 11 December 2015 – Published: 15 January 2016
Abstract.Mexico is the world’s fourth most important maize producer; hence, there is a need to maintain soil quality for sustainable production in the upcoming years. Pumice min-ing is a superficial operation that modifies large areas in cen-tral Mexico. The main aim was to assess the present state of agricultural soils differing in elapsed time since pumice mining (0–15 years) in a representative area of the Calimaya region in the State of Mexico. The study sites in 0, 1, 4, 10, and 15 year old reclaimed soils were compared with an ad-jacent undisturbed site. Our results indicate that gravimetric moisture content, water hold capacity, bulk density, available phosphorus, total nitrogen, soil organic carbon, microbial biomass carbon and phosphatase and urease activity were greatly impacted by disturbance. A general trend of recov-ery towards the undisturbed condition with reclamation age was found after disturbance, the recovery of soil total N be-ing faster than soil organic C. The soil quality indicators were selected using principal component analysis (PCA), correla-tions and multiple linear regressions. The first three compo-nents gathered explain 76.4 % of the total variability. The ob-tained results revealed that the most appropriate indicators to diagnose the quality of the soils were urease, available phos-phorus and bulk density and minor total nitrogen. Accord-ing to linear score analysis and the additive index, the soils showed a recuperation starting from 4 years of pumice ex-traction.
1 Introduction
Land degradation refers to a process induced by human ac-tivities that cause the decrease in biological productivity or biodiversity, as well as the current capacity and/or potential to sustain human life (Oldeman, 1998). Land degradation and
desertification affect many regions of the world (Cerdà et al., 1999; Bai et al., 2013; Izzo et al., 2013; Wang et al., 2013; Yan and Cai, 2015) and there is a need to restore those areas affected by land degradation processes (Guénon et al., 2013; Özcan et al., 2013; Kröpfl et al., 2013; Li et al., 2013; Te-jada and Benitez, 2014; Zucca et al., 2015). Soil degradation can also interfere with normal nutrient cycling and habitat quality, as well as hamper the latter’s natural buffering abil-ity (Keesstra et al., 2012; Berendse et al., 2015; Brevik et al., 2015). There are examples of studies in opencast coal mines, magnesite mines and limestone mines (Raizada and Juyal, 2012; Haigh et al., 2015; Martín-Moreno et al., 2013; Milder et al., 2013; Pallavicini et al., 2015; Mukhopady and Maiti, 2014; Wick et al., 2014), whilst there are few studies on opencast pumicite mines.
The main causes of land degradation during mining opera-tions are (1) removal of vegetation cover and topsoil, (2) ex-cavation and dumping of overburden, (3) changes in the land-scape (Mukhopadhyay et al., 2013), (4) disruption of surface and subsurface hydrologic regimes, (5) transformation of fer-tile cultivated land into wasteland and, in some cases, (6) serious environmental pollution and ecological degradation, which can lead to loss of biodiversity (Keskin and Makineci, 2009). Soil in mined sites is replaced by overburden, which differs substantially from developed soils (Huggett, 1998; Keskin and Makineci, 2009), with adverse properties such as severe depletion of organic matter, erosion risk, toxicity, and nutrient deficiency, which commonly reduce productivity in post-mining landscapes (Sourkova et al., 2005).
In a post-mining landscape, the regeneration of the up-permost soil layer, organ-mineral horizon, and soil biota is necessary, which transforms organic matter (Frouz et al., 2001). The accumulation of organic matter (OM) is critical because it results in positive changes in physical and chem-ical soil properties, such as water holding and sorption ca-pacities, nutrient content and availability, soil bulk density, and buffering capacity, and increases microbial biomass and extractable carbon, microbial community structure and bio-diversity. Moreover, OM is an energy source for the soil mi-croorganisms, which drives decomposition and mineraliza-tion of plant residues, thereby releasing nutrients (Sourkova et al., 2005; Laudicina et al., 2015)
Soil quality included physical, chemical and biological properties, as well as soil processes and their interactions. The selection of some properties to assess soil quality is an effective way. Some authors have used independent indica-tors, while others preferred their combinations into models or expressions in which various properties are involved; these expressions are called indices (Graham and Haynes, 2004; Hussain et al., 2008; Wick et al., 2014; Zornoza et al., 2015). The establishment of multiparametric indices has been used as an adequate tool for integrating greater information of soil quality. It provides a more holistic measurement of soil qual-ity (Brevik et al., 2015; Zhang et al., 2015). Several stud-ies have generated indices from a data set using physical, chemical and biological indicators. Organic carbon, micro-bial biomass and enzyme activity have been widely used to assess impact of change in land use and reclaimed soils (Chodak and Niklinska, 2010).
Enzyme activity measurement is widely used to examine nutrient cycling processes in soil (Nannipieri et al., 1990; Tabatabai and Dick, 2002). Moreover, enzyme activities can provide indications of quantitative changes in soil organic matter and are usually related to the presence of viable mi-croorganisms and their oxidative activities (Gianfreda et al., 2005), which could be sensitive indicators of the effect of land degradation on soil microbial activity. Soil hydrolyses measurements provide an early indication of changes in soil fertility, since they are related to the mineralization of im-portant elements such as nitrogen, phosphorus and carbon,
and may provide some insight into the metabolic capacity of the soil (Shaw and Burns, 2006; García-Orenes et al., 2010). Urease plays an important role in soil nitrogen cycle because it can hydrolyze urea, an important fertilizer in agricultural systems to ammoniacal nitrogen (Sinsabaugh et al., 2000; Caldwell, 2005). Catalase has a great effect on changing soil redox, chemical properties of soil solution, and accelerating transformation of organic matter (Wang et al., 2012). The metabolic quotient estimates the activity and efficiency of decomposition (or C use) by soil microbes (Anderson and Domsch, 1990) and is a suitable indicator to provide evi-dence of soil perturbation (Zornoza et al., 2015).
Little information exists about how mining affects soil in cropland regions of the world and especially those of the central highlands of Mexico. The present work aimed to as-sess the changes produced in the agricultural soils differing in elapsed time since pumice mining (0–15 years). With the information from this study, we examine valuable indicators of surface mine reclamation progress in opencast mines.
2 Materials and methods
2.1 Study site
This study was conducted in Calimaya, State of Mexico (cen-tral Mexico; 19◦13′25′′N, 99◦44′02′′W), where the mean
annual temperature is 14◦C and the annual rainfall is 800 mm
(GEM, 2012). The dominant climate is subhumid with sum-mer rains. Dominant soils are Andosols (IUSS Working Group WRB, 2014). The main type of land use in the re-gion is cropland based on maize. Cultivation techniques con-sist of monoculture, crop residue removal, and the use of N fertilizer, herbicides and pesticides. The change in use from agricultural land to urban land caused a decline in cultivated land from 7508 to 5350 ha between 2010 and 2011 (GEM, 2012). Following standard practice on surface mining sites, the topsoil was stripped and stockpiled until mining opera-tions were completed; stored soil was then spread on top of overburden.
2.2 Sampling process
The slopes of the sampling sites ranged from 25 to 30 %. The pumice layer was located 30–180 cm deep.
Surface mining is one of the most complete forms of human-caused habitat alteration and degradation. In this case, mining eliminates vegetation, removes topsoil (30 cm) and overburden by excavation, and changes topography and geological structures permanently. The reclamation process involved the return of topsoil after mining exploitation. These new altered soils are called reclaimed mine soils, which have a different year of agriculture use.
These sites had been continuously cultivated since recla-mation of mine spoils; surface soil samples (0–15 cm depth) were taken in February (during the dry season), June (onset of the rainy season), and March 2012 (during the dry sea-son), and stored at 4◦C for biochemical analyses. Soil
sam-ples were dried at room temperature and, afterwards, they were passed through a 2 mm mesh sieve.
Sampling sites were selected considering the extraction pumice times; the distance between them was 450 m and the area 3 ha. The soil sampled from each field was pooled sepa-rately. By systematic sampling at each site, a composite sam-ple from 30 subsamsam-ples was collected from six treatments (S, S0,S1,S4,S10andS15).
2.3 Laboratory analysis
The following parameters were analyzed: gravimetric mois-ture content (GMC), which was measured gravimetrically, water holding capacity (WHC) according to Alef and Nan-nipieri (1995), and soil bulk density (BD) as described by Domínguez and Aguilera (1987). The soil pH and electri-cal conductivity (CE) were determined in soil/water (1:2.5
w/v) (Thomas, 1996). Content of soil organic carbon (SOC) was determined by the Walkley–Black method (Nelson and Sommers, 1996), total nitrogen (TN) with Kjeldahl diges-tion (Bremner, 1996), and available phosphorus by the Olsen method.
Microbial biomass carbon (MBC) of soil samples was es-timated by the chloroform fumigation and extraction method (Vance et al., 1987). Basal respiration (BR) was estimated by quantifying the carbon dioxide (CO2) released by micro-bial respiration in 33 days of incubation at 25◦C adjusted
to 40 % water holding capacity (WHC). For this purpose, 25 g soil was filled into flasks, together with small flasks con-taining 10 mL of 0.2 mol L−1NaOH, to capture the released CO2, and hermetically sealed. CO2was determined by titra-tion with 0.2 mol L−1HCl, after precipitation of the barium carbonate resulting from the addition of BaCl2to the NaOH solution, using phenolphthalein diluted in 100 mL ethanol (60 %,v/v) as an indicator (Alef and Nannipieri, 1995).
Catalase activity was measured by titrating the residual H2O2 added to the soil and not degraded by catalase with KMnO4(Johnson and Temple, 1964). Acid phosphatase ac-tivity was measured by spectrophotometry (400 nm) of p-nitrophenol released from 1.0 g soil after a 60 min
incuba-tion at 37◦C with a 0.025 mol L−1p-nitrophenyl phosphate substrate, in 4 mL of 0.17 mol L−1MUB (universal buffer), at pH 5 (Tabatabai and Bremmer, 1969). Urease activity was determined as the amount of NH+
4 released from 5.0 g soil af-ter a 120 min incubation with a substrate of 0.2 mol L−1urea at 37◦C, 4.5 mL of THAM (Tris buffer) (Alef and
Nannip-ieri, 1995). The metabolic quotient (qCO2) was calculated as the ratio of basal respiration to MBC (Anderson and Domsch, 1990).
2.4 Statistical analysis
An analysis of variance (ANOVA) and Tukey test at 95 % confidence level were performed to detect significant differ-ences in soil samples with different years of extraction of pumice. Only those soil properties that showed significant differences were selected to represent a minimum data set (MDS). Significant variables were chosen for the principle component analysis (PCA); the PCs with eigenvalues > 1 and those that explained at least 5 % of the variation in the data were examined; the values of the variables were standard-ized by subtracting their means and dividing by their stan-dard deviations. When more than one factor was retained under a single PC, multivariate correlation coefficients was employed to determine whether the variables could be con-sidered redundant and therefore eliminated from the MDS. Well-correlated variables were considered redundant, and only one was considered for the MDS. The rest were elimi-nated from the data set. When all the indicators that were re-tained in the MDS were regressed as independent variables, with data on time extraction pumice as dependent variables, the coefficient of determination (R2) withS,S0,S1,S4,S10 andS15was calculated.
After determining the variables for the MDS, every obser-vation of each MDS indicator was transformed for inclusion in the soil quality index (SQI) methods by linear scoring. In-dicators were ranked in ascending or descending order de-pending on whether a higher value was considered “good” or “bad” in terms of soil function. For “more is better” indi-cators, each observation was divided by the highest observed value such that the highest observed value received a score of 1. For “less is better” indicators, the lowest observed value (in the numerator) was divided by each observation (in the denominator) such that the lowest observed value received a score of 1.
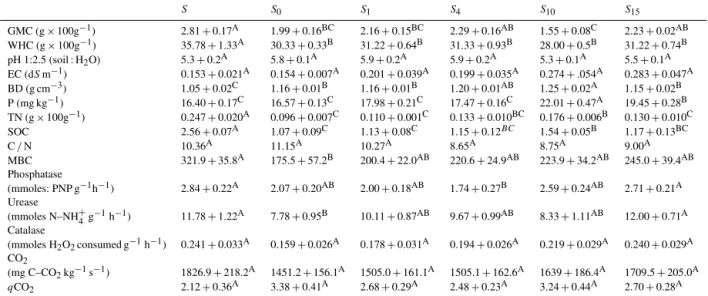
Table 1.Properties of soil samples with different years of extraction of pumice.
S S0 S1 S4 S10 S15
GMC (g×100g−1) 2.81+0.17A 1.99+0.16BC 2.16+0.15BC 2.29+0.16AB 1.55+0.08C 2.23+0.02AB
WHC (g×100g−1) 35.78+1.33A 30.33+0.33B 31.22+0.64B 31.33+0.93B 28.00+0.5B 31.22+0.74B
pH 1:2.5 (soil : H2O) 5.3+0.2A 5.8+0.1A 5.9+0.2A 5.9+0.2A 5.3+0.1A 5.5+0.1A
EC (dSm−1) 0.153+0.021A 0.154+0.007A 0.201+0.039A 0.199+0.035A 0.274+.054A 0.283+0.047A
BD (g cm−3) 1.05+0.02C 1.16+0.01B 1.16+0.01B 1.20+0.01AB 1.25+0.02A 1.15+0.02B
P (mg kg−1) 16.40+0.17C 16.57+0.13C 17.98+0.21C 17.47+0.16C 22.01+0.47A 19.45+0.28B
TN (g×100g−1) 0.247+0.020A 0.096+0.007C 0.110+0.001C 0.133+0.010BC 0.176+0.006B 0.130+0.010C
SOC 2.56+0.07A 1.07+0.09C 1.13+0.08C 1.15+0.12BC 1.54+0.05B 1.17+0.13BC
C/N 10.36A 11.15A 10.27A 8.65A 8.75A 9.00A
MBC 321.9+35.8A 175.5+57.2B 200.4+22.0AB 220.6+24.9AB 223.9+34.2AB 245.0+39.4AB
Phosphatase
(mmoles: PNP g−1h−1) 2.84+0.22A 2.07+0.20AB 2.00+0.18AB 1.74+0.27B 2.59+0.24AB 2.71+0.21A Urease
(mmoles N–NH+
4g−1h−1) 11.78+1.22A 7.78+0.95B 10.11+0.87AB 9.67+0.99AB 8.33+1.11AB 12.00+0.71A
Catalase
(mmoles H2O2consumed g−1h−1) 0.241+0.033A 0.159+0.026A 0.178+0.031A 0.194+0.026A 0.219+0.029A 0.240+0.029A
CO2
(mg C–CO2kg−1s−1) 1826.9+218.2A 1451.2+156.1A 1505.0+161.1A 1505.1+162.6A 1639+186.4A 1709.5+205.0A qCO2 2.12+0.36A 3.38+0.41A 2.68+0.29A 2.48+0.23A 3.24+0.44A 2.70+0.28A
GMC: Gravimetric moisture content; WHC: water holding capacity; EC: electrical conductivity; BD: bulk density; P: available phosphorus; TN: total nitrogen; SOC: soil organic carbon; MBC: microbial biomass C; CO2: respiratory activity;qCO2: metabolic quotient;S: undisturbed soils;S0: recently mined;S1: 1 year old mined;S4: 4 year old mined;S10: 10 year old mined;S15: 15 year old mined. Mean±error standard. Different letters in the same column denote significant differences (p<0.05).
Table 2.Principle component analysis (PCA) of soil quality indica-tors of soil samples with different years of extraction of pumice.
PC1 PC2 PC3
Eigenvalue 3.6 1.7 1.6 % of variance 39.8 18.8 17.9 Cumulative % 39.8 58.6 76.4 MBC 0.381 −0.175 0.342
SOC 0.403 −0.270 0.104 GMC 0.468 0.037 −0.060
BD −0.228 0.084 0.560 Phosphatase 0.212 0.482 0.273 P −0.236 −0.134 0.570 WHC 0.376 0.412 −0.172 TN 0.420 −0.161 0.321
Urease 0.066 −0.665 −0.164
MBC: microbial biomass C; SOC: soil organic carbon; GMC: gravimetric moisture content; BD: bulk density; P: available phosphorus; WHC: water holding capacity; TN: total nitrogen.
3 Results
3.1 Basic soil properties and biological parameters
Electrical conductivity, pH, ratio C/N, catalase, CO2 and qCO2 did not significantly differ between the soil samples with different years of extraction of pumice (Table 1). Nev-ertheless, the respiration rate was higher in undisturbed soils than in soil post mining. On the other hand, theqCO2values were higher in mine soils compared to the undisturbed soils (Table 1).
Mean of gravimetric moisture content (GMC) and water hold capacity (WHC) showed the next data respectively;S10
showed the significant lowest value for GMC, without signif-icant differences withS0andS1. The highest values for GMC were shown byS,S4andS15, with no significant differences among them. WHC showed no significant differences among mined soils, only theS soil being significantly higher than the rest. No significant differences among treatments were observed in pH and EC. BD showed the significantly low-est value forS, with significant increments in mined soils. The highest value was observed inS10 andS4. Available P followed the increasing trend S=S0=S1=S4<S15<S10. SOC and TN showed a similar trend. There were no signif-icant differences amongS0,S1,S4 andS15, which showed the lowest values. The highest values were observed in theS treatment. MBC showed the highest value inS, which was only significantly different than S0, which showed the low-est value; in fact, MBC significantly decreased∼50 % inS0 soil with regards toS. As a general pattern, enzyme activi-ties increased with the time since the pumice mining was car-ried out, withSsoil showing the highest activities. The phos-phatase showed the lowest significant activity inS4, with no significant differences withS0,S1andS10.S15andSshowed the highest values, without significant differences between these two soils. Urease activity showed the highest values in SandS10, which were only significantly different toS0. The catalase activity, CO2 and theqCO2showed no significant differences among treatments (Table 1).
3.2 Soil quality indicators
Table 3.Correlation matrix for highly weighted variables under PCs with high factor loading.
Variables Soil organic carbon GMC Total nitrogen
PC1 variables
Pearson’s correlations
Soil organic carbon 1.000 0.487∗∗ 0.765∗∗
GMC 0.487∗∗ 1.000 0.596∗∗
Total nitrogen 0.765∗∗ 0.596∗∗ 1.000
Correlation sums 2.252 2.083 2.361
PC2 variables
Urease Urease
1.000
PC3 variables
Bulk density Bulk density Available P 1.000 0.475∗∗
Available P 0.475∗∗ 1.000
GMC: gravimetric moisture content.∗∗p <0.01
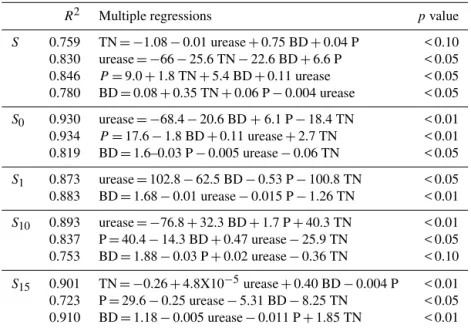
Table 4.Coefficient of determination and multiple regressions of the minimum data set (MDS) variables.
R2 Multiple regressions pvalue
S 0.759 TN= −1.08−0.01 urease+0.75 BD+0.04 P < 0.10 0.830 urease= −66−25.6 TN−22.6 BD+6.6 P < 0.05 0.846 P=9.0+1.8 TN+5.4 BD+0.11 urease < 0.05 0.780 BD=0.08+0.35 TN+0.06 P−0.004 urease < 0.05
S0 0.930 urease= −68.4−20.6 BD+6.1 P−18.4 TN < 0.01 0.934 P=17.6−1.8 BD+0.11 urease+2.7 TN < 0.01
0.819 BD=1.6–0.03 P−0.005 urease−0.06 TN < 0.05
S1 0.873 urease=102.8−62.5 BD−0.53 P−100.8 TN < 0.05
0.883 BD=1.68−0.01 urease−0.015 P−1.26 TN < 0.01
S10 0.893 urease= −76.8+32.3 BD+1.7 P+40.3 TN < 0.01
0.837 P=40.4−14.3 BD+0.47 urease−25.9 TN < 0.05 0.753 BD=1.88−0.03 P+0.02 urease−0.36 TN < 0.10
S15 0.901 TN= −0.26+4.8X10⁻⁵urease+0.40 BD−0.004 P < 0.01 0.723 P=29.6−0.25 urease−5.31 BD−8.25 TN < 0.05
0.910 BD=1.18−0.005 urease−0.011 P+1.85 TN < 0.01
TN: total nitrogen; P: available phosphorus; BD: bulk density; S: undisturbed soils;S0: recently mined;S1:
1 year old mined;S4: 4 year old mined;S10:10 year old mined;S15: 15 year old mined.
CBM, SOC, BD, phosphatase, P, TN and urease (p<0.05). These parameters were retained for PCA.
In the PCA of nine variables, the first three PCs had eigen-value > 1 and explained 76.4 % of the variance in the data (Table 2). Highly weighted variables under PC1 included GMC, SOC, and TN. A correlation matrix for the highly weighted variables under different PCs was run separately (Table 3). It was assumed that the variables having the high-est correlation sum bhigh-est represented the group. Among the three variables in PC1, TN was chosen for the MDS because of its highest correlation sum. The soil organic carbon had the second lowest correlation sum, but was highly correlated
with TN (r=0.77), and hence it was dropped. The variable
with lowest correlation sum was GMC and it was retained for MDS. Under PC2 and PC3 urease, bulk density and available phosphorus were highly weighted; the three variables were retained in MDS because of their relative importance in vol-canic soils.
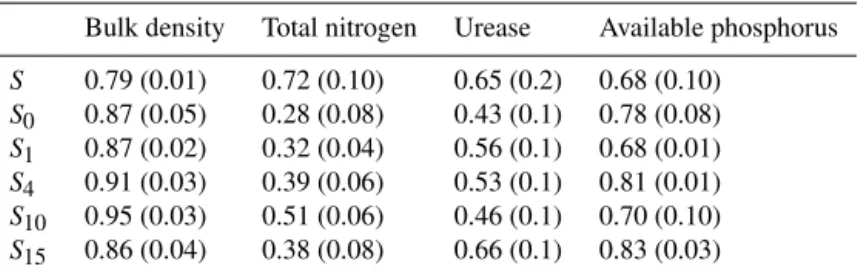
Table 5.Comparison of treatment means and standard deviations (in parentheses) of measured indicator values with linear transformed scores used for PCA and correlation analysis-chosen minimum data set (MDS) variables.
Bulk density Total nitrogen Urease Available phosphorus
S 0.79 (0.01) 0.72 (0.10) 0.65 (0.2) 0.68 (0.10)
S0 0.87 (0.05) 0.28 (0.08) 0.43 (0.1) 0.78 (0.08)
S1 0.87 (0.02) 0.32 (0.04) 0.56 (0.1) 0.68 (0.01)
S4 0.91 (0.03) 0.39 (0.06) 0.53 (0.1) 0.81 (0.01)
S10 0.95 (0.03) 0.51 (0.06) 0.46 (0.1) 0.70 (0.10)
S15 0.86 (0.04) 0.38 (0.08) 0.66 (0.1) 0.83 (0.03)
S: undisturbed soils;S0: recently mined;S1: 1 year old mined;S4: 4 year old mined;S10: 10 year
old mined;S15: 15 year old mined.
The linear score for the bulk density did not appear to be justifiable environmentally, due to the exploitation of pumice left uncovered. Deeper horizons and the value of the den-sity showed an increase; for this reason, this value was elimi-nated in the additive index. The high variability for TN, from 0.247 to 0.096 g 100 g−1, led to a score for the treatment means ranging from 0.72 to 0.28, a range that was proba-bly too broad (Table 5). Figure 1 shows the relative indicator scores (the sum of the linear score obtained in Table 5 for each variable); for the MDS scoring combinations of the ad-ditive index, S received significantly higher SQI value and did not show significance differences withS4,S10 andS15, whereas the soil with less time of extraction (S0andS1) pre-sented the lower values of SQI and was significantly different (p<0.05) (Fig. 1).
4 Discussion
The loss of SOC and TN observed in soils post-pumice min-ing is typical of major ecosystem disturbance (Kimble et al., 2001). In these soils a loss of up to 60 % is observed. These results are similar to the study by de Souza et al. (2013) and Zhang et al. (2015) in forest soils. The quantity of organic matter (C and N) and rates of microbial C mineralization to CO2 (respiration) were recovered with age in mining soil. The depletion of SOC produces a decline in soil quality asso-ciated with the reduction of available water capacity; about 15 % is lost in soil post-pumice, nutrient concentration and soil structure (Schwenke et al., 2000).
The recovery of MBC in these soils was faster than SOC. This may indicate that the proportion of bio-available C in 15 year old soils has become similar to that of undisturbed soils, but may also be the result of an increased availability of TN (evidenced by lower C/N ratios in older soils) and available P (as a result of fertilization). The MBC that was greatly reduced from the undisturbed soil in the mine soil was estimated to be an average of 46 % (Zhang et al., 2015). This result indicated that the land degradation is associated with a strong decrease in the SOC content, which decreased to 58 % in recently mine soils with respect to undisturbed soil.
0 0.5 1 1.5 2 2.5
S S0 S1 S4 S10 S15
P
Urease
N
S
o
il
qu
a
liy
va
lu
e
Time of pumice extraction A
B B
AB AB AB
Figure 1.Additive soil quality index using linear scoring indica-tors chosen by principal component analysis and correlation analy-sis minimum data set (MDS) variables.
The soil basal respiration andqCO2in mine soil showed no significant differences (p>0.05); it can be explained by an increase in the contents of SOC and nutrients, which would enhance microbial activity (Emmerling et al., 2000; Yan et al., 2003), and biomass cycling (Yang et al., 2012).
This establishes, as the MBC becomes more efficient in us-ing the available resources, that less C is lost as CO2through respiration (García-Orenes et al., 2010). Soil microbial quo-tients in several ecosystems have been found to increase im-mediately post-disturbance and subsequently decline with age (Insam and Domsch, 1988; Schipper et al., 2001; Gra-ham and Haynes, 2004). This pattern of microbial quotient has been interpreted as indicative of a decrease in C bio-availability in the soil organic matter over time. The micro-bial quotient of 0 year old was higher than other mine soils, and it tended to increase with age. The respiration rate per unit of microbial biomass (respiratory quotient) is a variable that can be interpreted more easily (Fernandes et al., 2005).
et al., 2009) and included MBC and MBN and enzymatic activities, probably due to high sensitivity (Zornoza et al., 2015). According to PCA and multiple regressions, urease, available phosphorus and bulk density are the three most im-portant variables for the soil quality assessment. Among the different enzymes in soils, urease is important in the trans-formation of urea to ammonium.
The mining activity in the study site has affected bulk den-sity significantly, and therefore the root response of the cul-tivated plants after the extraction could be affected. Previous research suggested bulk density as a soil quality indicator be-cause this measurement is generally responsive to manage-ment practices and is primarily a measure of soil compaction (Hussain et al., 1999). The soil under recent time, 1 and 4 years of pumice extraction, did not show significant differ-ences, whereas S10 andS15 presented significantly higher values; this behavior is attributed to agricultural land man-agement, such that the continuous addition of organic matter to the soil increases the availability of phosphorus.
For linear scores, some cases showed high variability in the range observed, for example the variability in TN; nev-ertheless, urease, phosphatase and TN were considerable for the additive SQI. With the SQI, significant differences were observed between different years of exploitation of pumice (p<0.05),S15,S10 andS4showed behavior more similar to S, and the time of recuperation is likely to start at 4 years, whileS0andS1were the most different with respect toS.
5 Conclusions
This study showed that pumice extraction has had an adverse impact on the quality of soils cultivated with maize. What is most evident in the first years after the mine: after several cycles of cultivation MBC, urease and phosphate activities increased as a result of the continuous addition of organic matter.
Using multivariate analysis provided information about soil indicators that contributed to a greater extent to deter-mine the effects of extraction pumice.
Among the evaluated quality indicators, urease and avail-able phosphorus provided information to diagnose the qual-ity of the soil where pumice was removed.
According to SQI, the time of recuperation of the soil under pumice mining starts 4 years after its exploitation.
Edited by: P. Pereira
References
Alef, K. and Nannipieri, P.: Enzyme activities: urease activity, in: Methods in Applied Soil Microbiology and Biochemistry, edited by; Alef, K. and Nannipieri, P., London, Academic Press, 311– 373, 1995.
Anderson, T. H. and Domsch, K. H.: Application of eco-physiological quotients (qCO2 andqD) on microbial biomass from soils of different crop histories, Soil Biol. Biochem., 22, 251–255, 1990.
Andrew, S. S., Karlen, D. L., and Mitchell, J. P.: A comparison of soil quality indexing methods for vegetable production systems in Northern California, Agric. Ecosys. Environ., 90, 25–45, 2002. Bai, X. Y., Wang, S. J., and Xiong, K. N.: Assessing spatial-temporal evolution processes of karst rocky desertification land: indications for restoration strategies, Land Degrad. Dev., 24, 47– 56, 2013.
Berendse, F., van Ruijven, J., Jongejans, E., and Kreestra, S.: Loss of plant species diversity reduces soil reduces resistence, Ecosys, 18, 881–888, 2015.
Brevik, E. C., Cerdá A., Mataix-Solera, J., Quinton, J. N., Six, J., and Van Oost, K.: The interdisciplinary nature of soil, Soil, 1, 117–129, doi:10.5194/soil-1-117-2015, 2015.
Bremner, J. M.: Nitrogen total, in: Method of Soil Analysis, Part 3 – chemical Methods SSSA Inc, edited by: Spark, D. L., ASA INC, Madison, WI, USA, 575–624, 1996.
Caldwell, B. A.: Enzyme activities as a component of soil biodiver-sity: A review, Pedobiologia, 49, 637–644, 2005.
Cerdà, A. and Lavee, H.: The effect of grazing on soil and water losses under arid and mediterranean climates, Implications for desertification, Pirineos, 153/154, 159–174, 1999.
Chodak, M. and Niklinska, M.: Effect of texture and tree species on microbial properties of mine soils, Appl. Soil Ecol., 46, 268–275, 2010.
De Souza, R. G., Da Silva, D. K. A., De Mello, C. M. A., Goto, B. T., Da Silva, F. S. B., Sampaio, E. V. S. B., and Maia, L. C.: Arbuscular mycorrizal fungi in vegetation mined dunes, Land, Degrad. Develop., 24, 147–153, 2013.
Domínguez, R. I. and Aguilera, N. H.: Metodología de Análisis Físicos y Químicos de Suelos, Facultad de Ciencias, UNAM, México, 1987.
Emmerling, C., Liebner, C., Haubold-Rosar, M., Katzur, J., and Schröder, D.: Impact of application of organic waste materials on microbial and enzyme activities of mine soils in the Lusatian coal mining region, Plant Soil, 220, 129–138, 2000.
Fernandes, S. A. P., Bettiol, W., and Cerri, C. C.: Effect of sewage sludge on microbial biomass, basal respiration, metabolic quo-tient and soil enzymatic activity, Appl. Soil Ecol., 30, 65–77, 2005.
Frouz, J., Keplin, B., Pižl, V., Tajovský, K., Starý, J., Lukešová, A., Nováková, A., Balıik, V., Hánˇel, L., Materna, J., Düker, C., Chalupský, J., Rusek, J., and Heinkele, T.: Soil biota and upper soil layer development in two contrasting post-mining chronose-quences, Ecol. Eng., 17, 275–284, 2001.
García-Orenes, F., Guerrero, C., Roldán, A., Mataix-Solera, J., Cerda, A., Campoy, M., Zornoza, R., Bárcenas, G., and Car-avaca, F.: Soil microbial biomass and activity under different agricultural management systems in a semiarid Mediterranean agroecosystem, Soil Till. Res., 109, 110–115, 2010.
Gianfreda, L., Rao, M. A., Piotrowska, A., Palumbo, G., and Colombo, C.: Soil enzyme activities as affected by anthropogenic alterations: intensive agricultural practices and organic pollution, Sci. Total Environ., 341, 2265–279, 2005.
Graham, M. H. and Haynes, R. J.: Organic matter status and the size, activity and metabolic diversity of the soil microflora as in-dicators of the success of rehabilitation of sand dunes, Biol. Fert. Soils, 39, 429–437, 2004.
Guénon, R., Vennetier, M., Dupuy, N., Roussos, S., Pailler, A., and Gros, R.: Trends in recovery of Mediterranean soil chemical properties and microbial activities after infrequent and frequent wildfires, Land Degrad. Dev., 2, 115–128, 2013.
Haigh, M., Reed, H., Flege, A., D’acourt, M., Plamping, K., Cullis, M., Wooduffe, P., Sawyer, S., Panhuis, W., Wilding, G., Farrugia, F., and Powell, S.: Effect of planting method of the growth of Alnus glutinosa and Quercus petrea in compacted opencast coal-mine spoils south Gales, Land Degrad. Dev., 26, 227–233, 2015. Huggett, R. J.: Soil chronosequences, soil development, and soil
evolution: a critical review, Catena, 32, 155–172, 1998. Hussain, I., Olson, K. R., Wander, M. M., and Karlen, D. L.:
Adap-tation of soil quality indices and application to three tillage sys-tems in southern Illinois, Soil Till. Res., 50, 237–249, 1999. Hussain, M., Ahmed, S. M., and Abderrahman, W.: Cluster analysis
and quality assessment of logged water at an irrigation project, eastern Saudi Arabia, J. Environ. Manage., 86, 297–307, 2008. Insam, H. and Domsch, K. H.: Relationship between soil organic
carbon and microbial biomass on chronosequences of reclama-tion sites, Microb. Ecol., 15, 177–188, 1988.
IUSS Working Group WRB. World Reference Base for Soil Re-sources 2014, International soil classification system for naming soils and creating legends for soil maps, World Soil Resources Reports No. 106. FAO, Rome, 2014.
Izzo, M., Araujo, N., Aucelli, P. P. C., Maratea, A., and Sánchez, A.: Land sensitivity to Desertification in the Dominican Republic: an adaptation of the ESA methodology, Land Degrad.Dev., 24, 486– 498, 2013.
Jiménez, C., Huante, P., and Rincón E.: Restauración de minas su-perficiales en México, SEMARNAT, Technical report, 2006. Johnson, J. L. and Temple, K. L.: Some Variable Affecting the
Mea-surement of Catalase Activity in Soil, Soil Sci. Soc. Am. J., 28, 207–209, 1964.
Keskin, K. and Makineci, E.: Some soil properties on coal mine spoils reclaimed with black locust (Robinia pseudoacacia L.) and umbrella pine (PinuspineaL.) in Agacli-Istanbul, Environ. Monit. Assess., 159, 407–414, 2009.
Keesstra, S. D., Geissen, V., van Schaik, L., Mosse., K., and Pi-iranen, S.: Soil as a filter for groundwater quality, Curr. Opin. Environ. Sustainab., 4, 507–516, 2012.
Kimble, J. M., Lal, R., and Mausbach, M.: Erosion effects on soil organic carbon pool in soils of Iowa, in: Sustaining the Global Farm edited by: Stott, D. E., Mohtar, R. H., and Steinhardt, G. C., Washington, USDA-ARS, 190–224, 2001.
Kröpfl, A. I., Cecchi, G. A., Villasuso, N. M., and Distel, R. A.: Degradation and recovery processes in Semi-Arid patchy range-lands of northern Patagonia, Argentina, Land Degrad. Dev., 24, 393–399, 2013.
Laudicina, V. A., Novara, A., Barbera V., Egli, M., and Badalucco, L.: Long term and cropping system effects on chemical and bio-chemical characteristics of soil organic matter in a Mediterranean semiarid environment, Land Degrad. Dev., 26, 45–53, 2015. Li, X. L., Gao, J., Brierley, G., Qiao, Y. M., Zhang, J., and Yang, Y.
W.: Rangeland degradation on the Qinghai-Tibet plateau: Impli-cations for Rehabilitation, Land Degrad. Dev., 24, 72–80, 2013.
Liguori, V., Sciorta, R., and Ruisi, V.: The pumice aggregates of Lipari Island (Aeolian Isles-Italy), Bull. Int. Assoc. Eng. Geol., 30, 431–434, 1984.
Martín-Moreno, M. C., Martín, D. J .F., Nicolau, I. J. M., Hernando, R. N., Sanz, S. M. A., and Sánchez, C. L.: Effects of topography and surface soil cover on erosion for mining reclamation; The ex-perimental spoil heap at el Machorro Mine (Central Spain), Ar-ticle first published on line, 27 June 2013, doi:10.1002/ldr.2232, 2013.
Milder, A. I., Fernandez-Santos, B., and Martínez-Ruíz, C.: Colo-nization patterns of woody species on lands mined for coal in Spain: Preliminary insights for forest expansion, Land Degrad. Dev., 24, 39–46, 2013.
Mukhopadhyay, S., Maiti, S. K., and Masto, R. E.: Use of Re-claimed Mine Soil Index (RMSI) for screening of tree species for reclamation of coal mine degraded land, Ecol. Eng., 57, 133– 142, 2013.
Nannipieri, P., Grego, S., and Ceccanti, B.: Ecological significance of the biological activity in soil, in: Soil Biochemistry, edited by: Bollag, J. M. and Stotzky, G., New York, Marcel Dekker, 293– 355, 1990.
Nelson, D. W. and Sommers, L. E.: Total carbon, organic carbon, and organic matter, in: Methods of Soil Analysis, Part III. Chem-ical Methods, edited by: Sparks, D. L. Madison, WI, American Society of Agronomy, 961–1010, 1996.
Oldeman, L. R.: Guidelines for general assessment of the status of human-induced soil degradation. Working paper 88/4, Interna-tional Soil Reference and Information Centre (ISRIC), Wagenin-gen, 1998.
Özcan, M., Gökbulak, F., and Hizal, A.: Exclosure effects on recov-ery of selected soil properties in a mixed brad leaf recreation site, Land Degrad Dev., 24, 266–276, 2013.
Pallavicini, Y., Alday, J. G., and Martínez-Ruíz, C.: Factors affect-ing herbaceous richness and biomass accumulation patterns of reclaimed coal mines, Land Degrad. Dev.,26, 211–217, 2015. Raizada, A. and Juyal, G. P.: Tree species diversity, species
re-generation and biological productivity of seededAcacia catechu
Willd in rehabilitated limestone mines in the north west Indian Himalayas, Land Degrad. Dev., 23, 167–174, 2012.
Rogowski, A. S. and Weinrich, B. E.: Modeling the effects of min-ing and erosion on biomass production, Ecol. Model., 35, 85–12, 1987.
Schipper, L. A., Degens, B. P., Sparling, G. P., and Duncan, L. C.: Changes in microbial heterotrophic diversity along five plant suc-cessional sequences, Soil Biol. Biochem., 33, 2093–2103, 2001. Schwenke, G. D., Ayre, L., Mulligan, D. R., and Bell, L. C.: Soil stripping and replacement for the rehabilitation of bauxite-mined land at Weipa, II. Soil organic matter dynamics in mine soil chronosequences, Aust. J. Soil Res., 38, 371–394, 2000. Shaw, E. J. and Burns, R. G.: Enzyme activities profiles and soil
quality, in: Microbiological Methods for Assessing Soil Quality, edited by: Bloem, J., Hopkins, D. W., and Benedetti, A., Walling-ford, CAB International, 158–171, 2006.
Sinsabaugh, R. L., Reynolds, H., and Long, M.: Rapid assay for amidohydrolase (urease) activity in environmental samples, Soil Biol. Biochem., 32, 2095–2097, 2000.
post-mining sites near Sokolov (Czech Republic) and near Cottbus (Germany), Geoderma, 129, 73–80, 2005.
Tabatabai, M. A. and Bremner, J. M.: Use of r-nitrophenyl phos-phate for assay of soil phosphatase activity, Soil Biol. Biochem., 1, 301–307, 1969.
Tabatabai, M. A. and Dick, W. A.: Enzymes in soil, in: Enzymes in the Environment: Activity, Ecology and Applications, edited by: Burns, R. G. and Dick, R. P., New York, Marcel, 567–596, 2002. Tejada, M. and Benítez, C.: Effects of crushed maize Straw residues on soil biological properties and soil restoration, Land Degrad. Dev., 25, 501–509, 2014.
Thomas, G. W.: Soil pH and soil acidity, in: Methods of Soil Analy-sis Part 3, Chemical Methods, edited by: Sparks, D. L., Madison, Wisconsin, American Society of Agronomy, 475–490, 1996. Vance, E. D., Brookes, P. C., and Jenkinson, D. S.: An
Extrac-tion Method for Measuring Soil Microbial Biomass C, Soil Biol. Biochem., 19, 703–707, 1987.
Wang, B., Xue, S., Liu, G. B., Zhang, G. H., Li, G., and Ren, Z. P.: Changes in soil nutrient and enzyme activities under different vegetations in the Loess Plateau area, Northwest China, Catena, 92, 186–195, 2012.
Wang, T., Yan, C. Z., Song, X., and Li, S.: Landsat images reveal trends in the aeolian desertification in a source area for sand and dust storms in China’s Alashan plateau (1975–2007), Land De-grad. Dev., 24, 422–429, 2013.
Wick, A. F., Daniels, L. W., Nash, W. L., and Burger, J. A.: Aggre-gate recovery in reclaimed coal mine soils of SW Virginia, Land Degrad. Dev., doi:10.1002/ldr.2309, 2014.
Whitham, A. G. and Sparks, R. S. J.: Bull. Volcanol., 48, 209–223, 1986.
Yan, X. and Cai, Y. L.: Multi-Scale Anthropogenic Driving Forces of Karst Rocky Desertification in Southwest China, Land De-grad. Dev., 26, 193–200, 2015.
Yan, T. M., Yang, L. Z., and Campbell, C. D.: Microbial biomass and metabolic quotient of soils under different land use in the Three Gorges Reservoir area, Geoderma, 115, 129–138, 2003. Yang, D., Zeng, D.-H., Zhang, J. L., Li, L.-J., and Mao, R.,:
Chemi-cal and microbial properties in contaminated soils around a mag-nesite mine in northeast China, Land Degrad. Dev., 24, 256–262, 2012.
Zhang, K., Zheng, H., Chen, F. L., Ouyang, Z. Y., Wang, Y., Wu, Y. F., Lan, J., Fu, M., and Xiang, X. W.: Changes in soil quality after convertingPinusto Eucalyptusplantations in southern China, Solid Earth, 6, 115–123, doi:10.5194/se-6-115-2015, 2015. Zornoza, R., Mataix-SDoera, J., Guerrero, C. V., Arcenegui, V., and
Mataix-Beneyto, J.: Comparison of Soil Physical, Chemical, and Biochemical Properties Among Native Forest, Maintained and Abandoned Almond Orchards in Mountainous Areas of Eastern Spain, Arid. Land Res. Manag., 23, 267–282, 2009.
Zornoza, R., Acosta, J. A., Bastida, F., Dominguez, S. G., Toledo, D. M., and Faz, A.: Identification of sensitive indicators to assess the interrelationship between soil quality, management practices and human health, Soil, 1, 173–185, doi:10-5194/soil-1-173-2015, 2015.