Effects of a Follow-On Formula Containing
Isomaltulose (Palatinose
™
) on Metabolic
Response, Acceptance, Tolerance and Safety
in Infants: A Randomized-Controlled Trial
M. Fleddermann1, A. Rauh-Pfeiffer1, H. Demmelmair1, L. Holdt2, D. Teupser2, B. Koletzko1*
1Dr. von Hauner Children`s Hospital, University of Munich Medical Centre, Munich, Germany,2Institute for Laboratory Medicine, University of Munich Medical Centre, Munich, Germany
Abstract
Effects of the dietary glycaemic load on postprandial blood glucose and insulin response might be of importance for fat deposition and risk of obesity. We aimed to investigate the metabolic effects, acceptance and tolerance of a follow-on formula containing the low gly-caemic and low insulinaemic carbohydrate isomaltulose replacing high glygly-caemic malto-dextrin. Healthy term infants aged 4 to 8 completed months (n = 50) were randomized to receive the intervention follow-on formula (IF, 2.1g isomaltulose (Palatinose™)/100mL) or an isocaloric conventional formula (CF) providing 2.1g maltodextrin/100mL for four weeks. Plasma insulinaemia 60min after start of feeding (primary outcome) was not statistically dif-ferent, while glycaemia adjusted for age and time for drinking/volume of meal 60min after start of feeding was 122(105,140) mg/dL in IF (median, interquartile range) and 111 (100,123) in CF (p = 0.01). Urinary c-peptide:creatinine ratio did not differ (IF:81.5(44.7, 96.0) vs. CF:56.8(37.5, 129),p = 0.43). Urinary c-peptide:creatinine ratio was correlated total intake of energy (R = 0.31,p = 0.045), protein (R = 0.42,p = 0.006) and fat (R = 0.40,p = 0.01) but not with carbohydrate intake (R = 0.22,p = 0.16). Both formulae were well
accepted without differences in time of crying, flatulence, stool characteristics and the occurrence of adverse events. The expected lower postprandial plasma insulin and blood glucose level due to replacement of high glycaemic maltodextrin by low glycaemic isomaltu-lose were not observed in the single time-point blood analysis. In infants aged 4 to 8 com-pleted months fed a liquid formula, peak blood glucose might be reached earlier than 60min after start of feeding. Non-invasive urinary c-peptide measurements may be a suitable marker of nutritional intake during the previous four days in infants.
Trial registration:ClinicalTrials.govNCT01627015 OPEN ACCESS
Citation:Fleddermann M, Rauh-Pfeiffer A, Demmelmair H, Holdt L, Teupser D, Koletzko B (2016) Effects of a Follow-On Formula Containing Isomaltulose (Palatinose™) on Metabolic Response, Acceptance, Tolerance and Safety in Infants: A Randomized-Controlled Trial. PLoS ONE 11(3): e0151614. doi:10.1371/journal.pone.0151614
Editor:Maciej Buchowski, Vanderbilt University, UNITED STATES
Received:September 30, 2015
Accepted:February 29, 2016
Published:March 17, 2016
Copyright:© 2016 Fleddermann et al. This is an open access article distributed under the terms of the
Creative Commons Attribution License, which permits unrestricted use, distribution, and reproduction in any medium, provided the original author and source are credited.
Data Availability Statement:All relevant data are within the paper and its Supporting Information files.
Introduction
In infants significantly higher insulin levels were observed in formula-fed compared to breast-fed infants [1–4]. Insulin has been related to early weight gain [2], and higher insulin levels in formula-fed infants were found to be associated with higher risk of obesity and type 2 diabetes in later life compared to breast-fed infants [5,6]. Differences in long-term outcomes between breast- and formula-fed infants can be related to e.g. the different protein content [7] but also to the carbohydrate content of human milk and formula and its glycaemic and insulinaemic properties [8]. A study investigating the glycaemic index (GI) of various commercial infant and follow-on formulae with comparable protein composition in adults showed that the GI was higher in a formula containing high glycaemic maltodextrin in addition to lactose, if com-pared to a formula containing higher proportions of lactose [8]. The replacement of conven-tional higher glycaemic carbohydrates (glycaemic index>70) such as maltodextrins by isomaltulose (Palatinose™, glycaemic index = 32, [9]) can lead to a follow-on formula with a lower glycaemic and insulinaemic response.
The disaccharide isomaltulose contains glucose and fructose in aα-1,6 glycosidic linkage is
completely digestible in the small intestine [9,10], but due to this glycosidic linkage it is only slowly hydrolyzed by small intestinal disaccharidases. In adults, the resulting postprandial gly-caemia and insulinaemia following isomaltulose ingestion are lower as compared to usual disaccharides, while a higher blood glucose level is sustained for a longer period of time [9,11].
For these physiological reasons, isomaltulose may be of interest for the use in infant foods to reduce the glycaemic load and plasma insulin response while still providing the full amount of energy. This study aimed to investigate the effect of a follow-on formula with isomaltulose partly replacing conventional higher glycaemic carbohydrates on postprandial insulinaemia and glycaemia in infants at the age of 4 to 8 completed months. These possible effects might have a long-term preventive potential as diet induced enhancement of insulin secretion in infancy associated with increased early weight gain as well as higher long-term risk of obesity and associated disorders.
Subjects and Methods
Randomization and ethical consideration
Double-blinded randomized allocation of infants to the study formulae was stratified for gen-der, and a block size of four was applied. A random allocation sequence was computer gener-ated by the study sponsor. The blinded allocation was maintained for participants, supporting staff and investigators until all laboratory and data analyses had been performed.
The study was conducted according to the guidelines laid down in the Declaration of Hel-sinki and all procedures involving human subjects were approved by the Ethical Committee of the Medical Faculty of Ludwig-Maximilians-University of Munich, Germany (reference num-ber 114–12). Written informed consent was obtained from all parents prior to study start after the experimental protocol had been explained to them in detail. The study was registered at Clinical Trials.gov prior to study start on 21.06.2012 (NCT01627015, registration name: Safety, Acceptance and Metabolic Effects in Infants Receiving a Novel Low Glycaemic Index Follow-on Formula).
Study design
The randomized, double-blind, controlled study with parallel design was performed with two formula groups (IF, intervention formula, CF, conventional formula). Infants of mothers who chose to formula -feed their infants for reasons not related to this study were recruited from
funders had no role in study design, data collection and analysis, decision to publish, or preparation of the manuscript.
Competing Interests:The authors have the following interests: The study was financially supported by BENEO GmbH (Mannheim, Germany), a member of the Suedzucker Group. BENEO supplied the respective formulae and reserves the exclusive right to use the results and data for possible Health Claim requests. Isomaltulose as part of one of the authors' formulas is already on the market. A follow-on formula including isomaltulose, which is used in the study, is not on the market. This does not alter the authors' adherence to all the PLOS ONE policies on sharing data and materials.
age 4 to 8 completed months and were randomized double-blinded into one of the two formula groups. In European and German legislation and recommendations, the introduction of fol-low-on formula is recommended when the infant has received complementary feeding (solids). The introduction of complementary feeding is recommended between the beginning of the 5th and 7thmonth of life [12,13]. Infants fully replaced their usual formula meals by the study for-mula for 28 days. Dietary intake (4-day food protocol), sleep patterns and tolerance parameters were assessed by questionnaires for four days at study start (first four days when infants were fully fed with study formula) and again for four consecutive days at study end. Food protocols were reviewed by study personal and were discussed with families during the interview. On day 29, spontaneous urine was collected using urine bags for infants (B. Braun Melsungen AG, Ger-many). At the same day, after an at least 3-hour fast, the infants consumed 100 to 120 mL of their assigned formula. At 60 min after start of feeding, a single capillary blood sample was obtained by heel prick.
A blood sample was not taken at baseline to limit the burden for the participating healthy infants. Given that the amount and the time of the last meal did not differ between the groups, it appears likely that fasting blood values were comparable between both groups.
Anthropometric measurement was done by experienced study personal with detailed and intensive training in anthropometry and all other procedures both at study start and again on day 29. Weight was determined with a Seca 336 scale (Seca, Hamburg, Germany) equipped with a measuring rod (Seca 232) for measuring recumbent length. Head circumference was measured with a tape (Seca 212). Skinfolds were measured using a Holtain caliper (Holtain Ltd, Crymych, UK) at the left body axis at four sites (triceps, biceps, subscapular and mid-thigh). All measurements were performed in duplicates and documented with an accuracy of 10 g for weight and 0.1 cm for length and head circumference as well as 0.2 mm for skinfolds. The equipment was regularly checked and calibrated to ensure accuracy of measurements.
SD scores (z scores) were calculated for the anthropometric results relative to the growth standards of the WHO for breast-fed children [14]. Body fat percentage was calculated via pre-dictive skinfold equations according to Slaughter et al. 1988 [15].
The glycaemic load was estimated by multiplying food specific glycaemic index [16] and the amount of carbohydrate, divided by 100. The calculated glycaemic index of the study formulae in consideration of specific carbohydrate composition was 48 for IF and 63 for CF [17]. The glycaemic index of complementary food was categorized into fruit, cereal, cereal plus fruit, potato/rice/noodle with vegetable and meat/fish, vegetable only, potato/rice/noodle with meat/ fish, potato/rice/noodle with vegetable, potato/rice/noodle, yogurt, juice, salty snack and sweet snack. The glycemic load of complementary food was calculated by multiplying food category specific glycaemic index [16] or calculated glycaemic index according to Dodd et al. 2011 [17] and the amount of carbohydrate, divided by 100.
Laboratory procedures
On study day 29, capillary blood samples were obtained by heel prick 60 min after start of feed-ing of 100 to 120 mL formula. Plasma aliquots for insulin measurement (collected with Potas-sium-EDTA Microvette1CB 300, Sarstedt, Germany) and urine samples (Urine Monovette, Sarstedt, Germany) were stored at -80°C and transported on dry ice to the Institute for Labora-tory Medicine of the University of Munich, Germany to analyze plasma insulin and urinary c-peptide, creatinine and urea respectively.
variation, analyzed in a pretest using 10μl sample volume, was 3.1% (CV). Haemolysed plasma had no significant influence on insulin results.
Capillary postprandial blood glucose was measured using HemoCue1Glucose 201 analyser (HemoCue AB, Angelholm, Sweden) and glycosylated hemoglobin (HbA1c) using Siemens/ Bayer DCA 2000+ Analyzer (Siemens Healthcare Diagnostics Inc., USA). Urine was collected and analyzed for creatinine and urea using the Beckman Coulter1AU 5800 analysis system (Beckman Coulter) according to the manufacturers´ instructions. Urinary c-peptide was deter-mined using the cobas18000 analyzer (e 602 module, Roche) according to the manufacturers´ instructions.
Study population
From Dec 2012 to Mar 2014, 51 infants were enrolled via two recruitment strategies: 1.) Parents were asked for their general interest to participate in a clinical study with their infant at the maternity ward of the University of Munich, Germany. If interested, they were contacted again after 4 months, shortly before the study age of infants and study procedures were explained; 2.) Parents were informed about the study via letters providing study information and contact data of the principal investigator. If interested, they contacted the study center via phone or e-mail. Eligible infants (age: 4 to 8 completed months, actual weight-for-age: 5thto 95thpercentile [19]) had to be born apparently healthy from singleton pregnancies at 37 to 42 weeks of gestation. Infants with acute or chronic disease or with mothers having gestational diabetes or a chronic disease influencing growth or metabolism were excluded from study par-ticipation. At baseline, energy and carbohydrate intake from complementary feeding did not exceed 25% of total intake, respectively, which was calculated for each infant individually.
Study diets
Study formulae were provided free of charge to families in 450 g boxes labelled with random numbers. The products were packed in identically designed boxes labelled with the same prod-uct name. Both infant formulae were developed and produced on behalf of BENEO GmbH in accordance with relevant EU directives of 2006 [20]. The formulae were identical in respect to their composition including energy, protein, carbohydrate and fat content (S1 Table). The only difference concerns the carbohydrate composition of both formulae, in that maltodextrin (2.1 g/100mL) in the conventional formula was replaced by isomaltulose, while the further carbohy-drates contained in the formulae (lactose and starch) were kept unchanged. Isomaltulose has been categorized as“generally recognized as safe”(GRAS) in the USA and has been approved as a food ingredient under the Novel Food regulation in the European Union [9]. The taste and appearance of isomaltulose are similar to sucrose and the sweetness is about half of that of sucrose [10]. Maltodextrin is a non-sweet palatable substance [21] and a high-glycaemic digest-ible carbohydrate obtained by the partial hydrolysis of starch. A free-of-choice provision of complementary diet (vegetable, fruit or potato) was allowed to be fed in addition to the study formulae up to a maximum of 25% of energy and carbohydrate intake.
Power calculation, data management and statistical analysis
Power calculation was based on a study by Lucas et al. [22] with postprandial insulin values of 125 pmol/L in bottle-fed and 45 pmol/L in breast-fed infants and a standard deviation of 93.4 pmol/L. The study assumed a power of 85% and 5% risk ofα-error to detect a difference as
Data were entered into a database using ABBYY1
FlexiCapture 10 (Europe GmbH, Munich, Germany). Statistical analyses were performed with Stata1/MP 11.0 (StataCorp LP, College Station, TX, USA). Results are presented as mean ± SD or medians and interquartile ranges (IQR, 25th and 75th percentile). Pearson chi-square test was used for statistical compar-ison of categorical data. Student´s t-test was used for normally distributed continuous variables and Mann-Whitney test for non-normally distributed continuous variables. Group indepen-dent spearman rank correlations were used for correlations between c-peptide:creatinine ratio and nutritional intake to identify non-invasive biomarkers for nutrition. Linear regression model was applied to estimate the effect of formula type on the anthropometric outcome and biochemical outcome, including infants age (not z scores), volume and time of test meal (blood results only) and the respective baseline value (anthropometry only). Adjusted parameters are presented as coefficient and 95% confidence interval.
The primary (insulinaemia at 60 min after start of formula feeding) and secondary (glycae-mia at 60 min after start of formula feeding, acceptance, tolerance, anthropometry parameters, urinary C-peptide, glycosylated haemoglobin) outcomes were analyzed for intention-to-treat and per-protocol populations. In the intention-to-treat analysis, all randomized subjects that received study formula were considered. In the per-protocol analysis, only data from subjects complying with the predefined conditions were included (formula intake covering more than 75% of energy and carbohydrate intake during whole study period, and who were fasted for more than 3 hours before the test meal).
Results
A total of 51 infants were recruited (Fig 1). Fifty infants were randomly allocated and received the study formulae from age 187 ± 40.0 days (IF) and 174 ± 30.2 (CF) days of life onwards (p = 0.17). During the intervention period five infants dropped out of the study (10%) because of parental refusal (n = 3: increased amount of flatulence n = 1, increased amount of flatulence plus firmer stool consistency n = 1, firmer stool consistency n = 1) or paediatric recommenda-tion (n = 2: development of a bronchitis n = 1, firmer stool consistency n = 1), which were not statistically different between the groups. Gender ratio, birth order, socioeconomic data, nutri-tional intake and anthropometry at study entry (except subscapular skinfold thickness) were not significantly different between the randomized formula groups. At birth, small differences were observed for gestational age and anthropometry: IF infants were born at 40.1 weeks of gestation compared to 39.4 weeks for CF infants (p = 0.03). IF infants had mean birth weights and birth lengths of 3547 g and 52.6 cm, respectively, while CF infants had mean birth weights and birth lengths of 3329 g and 51.0 cm, respectively. Differences between the groups were sta-tistically significant (p = 0.01) for birth length. However, at study entry, anthropometry param-eters at the age of 4 to 8 completed months were not significantly different.
Biochemical markers
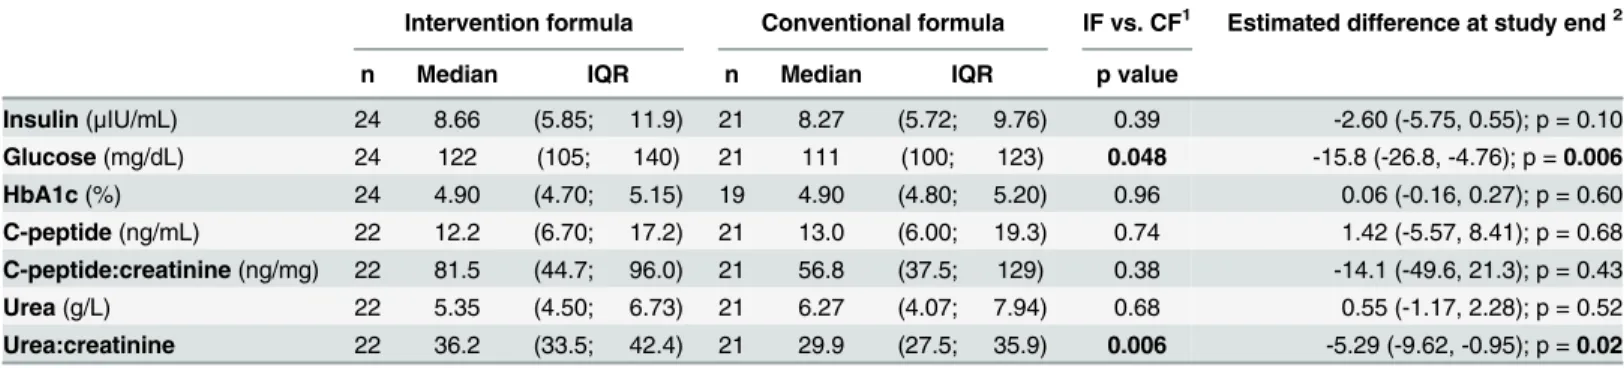
All analyzed concentrations were within the normal ranges for healthy infants found in other studies (Table 1). Plasma insulin concentrations were not statistically different between the for-mula groups. Adjusted for age, time and volume of forfor-mula test meal, insulin concentration tended to be 2.60μIU/mL higher in IF infants than CF infants (p = 0.10).
Fig 1. CONSORT chart.Numbers of participants for randomization, allocation, follow-up and analysis of low glycaemic intervention formula and conventional higher glycaemic formula group.
doi:10.1371/journal.pone.0151614.g001
Table 1. Capillary postprandial plasma insulin, blood glucose and HbA1c and urinary c-peptide and urea concentrations at study end (intention-to-treat population).
Intervention formula Conventional formula IF vs. CF1 Estimated difference at study end2
n Median IQR n Median IQR p value
Insulin(μIU/mL) 24 8.66 (5.85; 11.9) 21 8.27 (5.72; 9.76) 0.39 -2.60 (-5.75, 0.55); p = 0.10 Glucose(mg/dL) 24 122 (105; 140) 21 111 (100; 123) 0.048 -15.8 (-26.8, -4.76); p =0.006 HbA1c(%) 24 4.90 (4.70; 5.15) 19 4.90 (4.80; 5.20) 0.96 0.06 (-0.16, 0.27); p = 0.60 C-peptide(ng/mL) 22 12.2 (6.70; 17.2) 21 13.0 (6.00; 19.3) 0.74 1.42 (-5.57, 8.41); p = 0.68 C-peptide:creatinine(ng/mg) 22 81.5 (44.7; 96.0) 21 56.8 (37.5; 129) 0.38 -14.1 (-49.6, 21.3); p = 0.43
Urea(g/L) 22 5.35 (4.50; 6.73) 21 6.27 (4.07; 7.94) 0.68 0.55 (-1.17, 2.28); p = 0.52
Urea:creatinine 22 36.2 (33.5; 42.4) 21 29.9 (27.5; 35.9) 0.006 -5.29 (-9.62, -0.95); p =0.02
Data presented as median (interquartile range). IF, intervention formula; CF, conventional formula; IQR, interquartile range. 1
Significant differences (Mann-Whitney test, P<0.05).
²
Derived from linear regression adjusted for age and time for drinking/ volume of meal (glucose and insulin only), 95% confidence interval in parentheses.
(p = 0.006) in the intention-to-treat and tended to be higher in the per-protocol population (16.11 mg/dL higher in IF, p = 0.07). The percentage of glycosylated hemoglobin (HbA1c) did not differ between the formula groups with 4.90% in both groups (p = 0.96).
With respect to urine analysis, neither urinary c-peptide levels nor urinary c-peptide:creati-nine ratio differed significantly between formula groups. The urinary c-peptide levels were directly related to weight gain (R = 0.51, p = 0.0004) and total energy, protein and fat intake of the previous four days (energy intake: R = 0.31, p = 0.045; protein intake: R = 0.42, p = 0.006; fat intake R = 0.40, p = 0.01; but not of carbohydrate intake: R = 0.22, p = 0.16). The urinary urea concentration did not differ significantly between the formula groups, while the urea:cre-atinine ratio was significantly higher in IF infants 36.2 (33.5, 42.4) than in CF 29.9 (27.5,35.9) infants (p = 0.006).
Acceptance, tolerance and adverse events
Both formulae were well-accepted. No significant differences were observed for acceptance as well as tolerance parameters, such as regurgitation, vomiting, duration of crying and sleeping duration (data not shown). The amount of flatulence was generally low and was not signifi-cantly different between groups at study entry (first four days fully fed by study formula). Dur-ing the second half of the study the average amount of flatulence tended to be higher in CF infants than in IF infants (S2 Table). Stool frequency and stool consistency did not differ among the two formula groups.
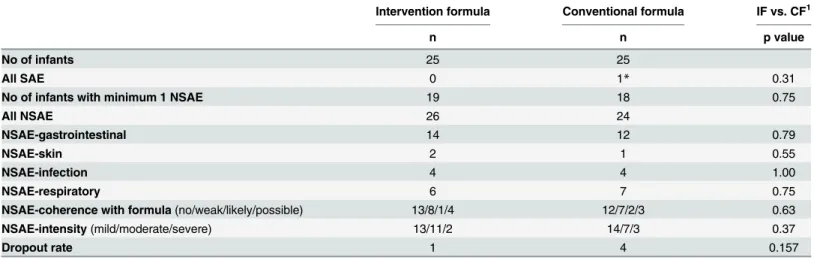
Adverse events were observed in 19 IF and 18 CF infants (p = 0.75). The types of adverse events were similarly distributed between formula groups. Gastrointestinal events were partly associated with other illnesses and did not differ between the groups. The coherence with for-mula and intensity of adverse events did not differ (Table 2). Only one serious adverse event was recorded during the study in the CF group, which was not formula-related.
Growth
Anthropometric data including skinfolds and z scores determined at baseline and study end are summarized inTable 3. No statistical differences were observed at baseline except for sub-scapular skinfold thickness, that was 7.63 ± 1.38 mm (IF) and 6.86 ± 1.30 mm (CF, p = 0.049),
Table 2. Summary of Adverse events.
Intervention formula Conventional formula IF vs. CF1
n n p value
No of infants 25 25
All SAE 0 1* 0.31
No of infants with minimum 1 NSAE 19 18 0.75
All NSAE 26 24
NSAE-gastrointestinal 14 12 0.79
NSAE-skin 2 1 0.55
NSAE-infection 4 4 1.00
NSAE-respiratory 6 7 0.75
NSAE-coherence with formula(no/weak/likely/possible) 13/8/1/4 12/7/2/3 0.63
NSAE-intensity(mild/moderate/severe) 13/11/2 14/7/3 0.37
Dropout rate 1 4 0.157
IF, intervention formula; CF, conventional formula; NSAE, non-serious adverse events; SAE, serious adverse events. 1Significant differences (Chi-square test, P<0.05).
and respective calculated body fat content [15] of 19.0 ± 2.77% and 17.3 ± 2.78% (p = 0.04). Non-adjusted weight gain was not statistically different between formula groups (IF: 14.2 ± 5.74 vs. CF: 11.0 ± 5.98 g/d, p = 0.08). Length gain expressed as mm per day was not different between the groups (IF: 0.55 ± 0.27 mm/d and CF: 0.55 ± 0.22 mm/d, p = 0.95). Adjusted for the respec-tive anthropometric baseline value and age, weight gain was 3.19 g/d non-significantly higher in IF than in CF infants (p = 0.06). Adjusted length gain was not different (0.05 mm/d higher in IF infants than in CF infants, p = 0.49). No differences were observed for head circumference gain non-adjusted and adjusted. Analyzing per-protocol subjects, weight gain was not statistically dif-ferent between the groups (IF: 14.2 ± 5.38 and CF: 12.1 ± 5.41 g/d, p = 0.31). Length gain and head circumference gain did not differ, as well.
Nutritional intake
Energy intake from formulae determined from the 4-day protocols (S3 Table) was identical in IF and CF infants at study start and end (study start: 578 ± 123 vs. 549 ± 104 kcal/d, p = 0.39
Table 3. Number of children, age at measurement and anthropometric measures with z scores at baseline and study end.
Intervention formula Conventional formula P value1 Estimated difference at study end²
Baseline Study end Baseline Study end IFvs. CF
No. of children 25 24 25 21
Age(d) 187±40.0 223±39.5 174±30.2 207±29.5 0.14 -0.18 (-1.55, 1.18); p = 0.79
Sex(male/female) 13/12 12/12 14/11 11/10
Weight
(g) 7937±868 8434±964 7560±791 7825±794 0.03 -101 (-222, 19.5); p = 0.10
(z score) 0.24±0.82 0.32±0.95 -0.01±0.79 0.15±0.84 0.08 -0.08 (-0.20, 0.03); p = 0.16
Length
(cm) 67.6±2.63 69.5±2.49 66.7±2.46 68.2±2.23 0.09 -0.20 (-0.70, 0.30); p = 0.43
(z score) 0.28±0.86 0.29±0.93 0.19±0.89 0.07±0.79 0.41 -0.06 (-0.28, 0.16); p = 0.60
Head
(cm) 43.1±1.46 43.9±1.54 43.0±1.42 43.9±1.08 0.86 0.30 (-0.09, 0.68); p = 0.13
BMI
(z score) 0.12±0.76 0.21±0.94 -0.16±1.08 -0.27±1.24 0.14 -0.09 (-0.34, 0.15), p = 0.45
Weight-for-length
(z score) 0.20±0.76 0.30±0.93 -0.09±1.10 -0.19±1.22 0.13 -0.10 (-0.33, 0.14); p = 0.42 Circumferences
Upperarm (cm) 15.0±1.02 15.5±1.33 14.7±1.18 14.8±1.16 0.08 -0.16 (-0.49, 0.16); p = 0.32
Chest (cm) 44.3±2.15 45.2±2.47 43.2±1.83 42.5±4.97 0.02 -1.04 (-2.99, 0.90); p = 0.28 Waist (cm) 42.5±2.68 43.5±2.87 41.6±2.32 41.8±2.67 0.048 -0.35 (-1.19, 0.49); p = 0.41 Thigh (cm) 24.2±1.91 24.9±2.42 23.7±1.91 23.9±2.13 0.14 -0.10 (-0.77, 0.56); p = 0.76 Skinfolds
Triceps (mm) 12.4±2.68 11.8±2.18 11.2±2.17 11.2±2.62 0.35 0.21 (-0.85, 1.27); p = 0.69 Biceps (mm) 7.04±1.66 6.65±1.66 6.95±1.32 6.78±1.63 0.78 0.31 (-0.50, 1.12); p = 0.45 Subscapular (mm) 7.63±1.38 7.67±2.12 6.86±1.30 6.63±1.65 0.08 -0.42 (-1.56, 0.73); p = 0.73 Midthigh (mm) 20.7±4.53 19.6±4.10 20.0±3.15 20.0±4.31 0.73 0.71 (-0.78, 2.20); p = 0.34
Body fat (%)3 19.0±2.77 18.5±2.77 17.3±2.78 17.0±3.40 0.09 -0.22 (-1.74, 1.30); p = 0.77
IF, intervention formula; CF, conventional formula. Data presented as mean±standard deviation. 1Signi
ficant differences (Student´s t-test, P<0.05) at study end.
2Derived from linear regression adjusted for the respective anthropometric baseline value and age (not z score), 95% con
fidence interval in parentheses. 3Calculated by Slaughter et al. 1988 [15].
and study end: 562 ± 154 and 541 ± 96.4 kcal/d, p = 0.58). Adjusted for age, energy intake did not differ between the groups, as well. A total of 43 infant consumed complementary food dur-ing the study. The mean energy intake from complementary feeddur-ing was 108 ± 69.5 kcal/d in IF infants and 104 ± 84.3 kcal/d in CF infants (p = 0.86) at study start and 124 ± 87.5 kcal/d and 112 ± 96.0 kcal/d (p = 0.67) for the IF and CF infants at study end, respectively. Carbohy-drate intake was 15.0 ± 10.3 g/d (IF) and 13.8 ± 12.2 g/d (CF) at study start (p = 0.75) and 17.7 ± 13.2 g/d and 16.0 ± 16.7 g/d (p = 0.70) at study end, respectively. Protein intake and fat intake from complementary feeding did not differ. The glycaemic load via complementary feeding did not differ between the groups and ranged between 8.71 ± 7.88 and 12.8 ± 10.9 per day in infants aged 4 to 8 completed months. There were no significant differences between the intake of water, tea or other formula than study formula, between the formula groups during the whole study period. The frequency of formula meals, complementary feeding and total meals was not different between both groups. The total number of meals per day was nearly constant during the study period (6.20 to 6.39 meals/d), number of formulae meals slightly decreased (from 5.07 to 4.75 meals/d) while complementary feeding meals increased (1.41 to 1.69 meals/d). In the per-protocol population, no differences in energy intake from formulae, energy and macronutrient intake from complementary feeding were found similar like in the intention-to-treat population. Neither intake of liquid nor meals per day were different between IF and CF infants (data not shown).
Discussion
Determination of postprandial insulin and glucose in infants
In our randomized, controlled, double-blind intervention study, postprandial plasma insulin levels assessed 60 min after start of feeding did not differ between the formulae groups. In con-trast, the measurement of postprandial glycaemia at a single time point 60 min after the start of feeding resulted in significantly higher levels in IF than in CF infants. The insulin response is directly related to glucose response [9,23]. Other studies [9,24] reported reduced postprandial glucose and insulin levels after isomaltulose compared to sucrose administration in human adults and in animals [9,11,24,25]. None of these studies was performed in infants or used maltodextrin as control. Our blood glucose and plasma insulin levels were assessed at a single time point only. In published literature, isomaltulose as low glycaemic carbohydrate resulted in a lower blood glucose response, when determined as area under the curve [9]. Isomaltulose has a lower glycaemic index than maltodextrin. This is on the one hand due to the slower digestion of isomaltulose and on the other hand, due to the monosaccharide composition: isomaltulose (glucose and fructose)vs. maltodextrin (glucose only), whereas fructose has a lower glycaemic index than glucose [16]. The slower release and absorption of the derived monosaccharides lead to lower postprandial glycaemia and insulinaemia than after oral sucrose administration, and the blood glucose level is sustained for a longer period of time [9,11]. Thus from about 90 min onwards, slightly enhanced glucose levels were observed in isomaltulose groups
[9,23,25,26]. Most of these studies were performed in adults or animals and sucrose was the control carbohydrate.
inconvenience to the infants, postprandial blood sampling in our infant trial was limited to a single time point only. Based on the above cited published literature we decided to collect capil-lary blood samples at 60 min after start of feeding [22]. Thus there is the possibility that the chosen time point for postprandial blood glucose measurement at 60 min after start of feeding in our study was in a cross-over period when blood glucose with the IF formula containing low glycaemic isomaltulose was still increasing and levels with the CF formula containing high gly-caemic maltodextrin were already decreasing. Early peaks of glycaemia may not have been detected if blood is taken 55 or 60 min after beginning of feeding [27] and thus higher glucose levels resulting from delayed digestion of isomaltulose may have been detected. The availability of more data about postprandial glucose response in infants over a longer time is warranted in order to benefit the general understanding of metabolic processes in this age group.
The glucose and insulin response depend on the composition of the formula, but also on the absolute amount of carbohydrates consumed. Moreover, also the time needed to consume the respective formula volume could influence the postprandial response. The average amount of formula consumed at the study day 60 min before blood sampling was similar with 114±7.61 mL in the IF group and 114±6.15 mL in the CF group (p = 0.78). The average time needed to con-sume the respective formula portion was 10.1±7.57 min in the IF group and 7.29±4.17 min in the CF group (p = 0.13). To account for different drink volumes and thus carbohydrate amounts consumed as well as for the time infants needed to consume the formula, we adjusted the post-prandial blood glucose and insulin levels for volume of formula test meal as well as time needed.
HbA1c, c-peptide and nutritional intake
HbA1c is used for glycaemic control from childhood onwards and reflects mean plasma glu-cose during the past 1 to 2 months [28]. In young infants, HbA1c is critically discussed, due to the influence of fetal hemoglobin that falsely increases HbA1c values [28]. The content of fetal hemoglobin decreases during the first year of life: at birth 80–90% accounts for fetal bin, at the age of 6 months largest proportion of hemoglobin is hemoglobin A (adult hemoglo-bin) and at the age of 1 year fetal hemoglobin decreases to less than 1% [28]. At our study age of about 6 months, HbA1c values did not differ between the formulae groups (4.90% in both groups) after an intervention period of 1 month. These values were within the reference ranges of 6 months and 8 to 12 months old infants [28,29] of 4.80 to 6.00%.
In infants aged 4 to 8 completed months, the total energy intake was 634 to 676 kcal per day and complementary feeding covered about 15.6 to 18.2% of total energy intake, which are typi-cal of infants in this age group in Germany [35]. No compensatory increase of glycaemic load via complementary feeding was observed in IF group, which ranged between 8.71 and 12.8 and did not differ significantly between the groups. The total numbers of meals per day was about 6.3, with about 4.9 formula meals per day. Although isomaltulose markedly regulate satiety-regulating peptides, when administered alone [11], the whole macronutrient composition of a meal might be more important in regulation of satiety response [11].
Acceptance and tolerance
This study demonstrated that the acceptance and tolerance of a follow-on formula with tulose was similar to that of conventional follow-on formulae. All infants accepted the isomal-tulose formula well. No negative effects were found for the number of adverse events, the amount of flatulence, stool consistency and stool frequency.
Infants aged 4 to 8 completed months are in a sensitive phase of growth and development. The gastrointestinal burden is high due to the ongoing development of the gut being exposed to a variety of different foods for the first time [36]. Isomaltulose was a well-digestible carbohy-drate also for this age group without negatively influencing normal laxation. From literature it is known, that disaccharidase activities in infants aged about 180 days (11.2 units- micromoles of substrate hydrolyzed per minute at 37°C per gram of protein) is similar to that in older chil-dren (12.7 units) [37].
Strengths and limitations
The strength of the study was, that stool parameters, flatulence, regurgitation and vomiting, were assessed high frequently (four days in the beginning and four days at the end of the study) which was useful for evaluation of acceptance and tolerance in infants. Further, except for the carbohydrate source that was partly replaced by isomaltulose, all other ingredients and con-tents remained identical in both formulae. However, we cannot exclude, that the modified car-bohydrate composition might have an influence on metabolic processes as fat oxidation, which might influence fat mass deposition [38–40].
A limitation of this study in infants was the blood sampling at a single time point only. Number of blood samplings for each individual was limited to a minimum for ethical reasons. Such ethical and practical constraints of feeding test foods to infants and collecting frequent capillary blood samples have also recently been acknowledged by Wright et al. 2015 [8]. Defin-ing the exact time point for capillary withdrawal at 60 min after start of feedDefin-ing was based on literature data [22], and might limit the conclusions that can be drawn from this study. Less data were available about postprandial glucose and insulin curves in infants. Only a small amount of markers to evaluate metabolic processes in infants are available. The general mark-ers, require special conditions as a fasting state, are less applicable in this age group. Thus e.g. HOMA index (Homeostasis Model Assessment) to evaluate insulin sensitivity could not be used or connections e.g. between blood insulin and urinary c-peptide were not found in our study. The development of new age-appropriate investigation procedures and the application of new markers to gain further knowledge about infant metabolism and possible later outcomes have to be examined.
glucose response between maltodextrin and isomaltulose. Non-invasive urinary c-peptide mea-surements might be a suitable marker of nutritional intake during the previous four days in infants aged 4 to 8 completed months. Both follow-on formulae were tolerated well in infants aged 4 to 8 completed months. Follow-on formulae containing isomaltulose was well accepted.
Supporting Information
S1 Table. Nutritional composition of study follow-on formulae.
(DOCX)
S2 Table. Number of infants with respective stool consistency, stool frequency (number of stools per day) and amount of flatulence (hours per day) during a four day period at study start and end.
(DOCX)
S3 Table. Daily nutritional intake of infants aged 4 to 8 completed months (intention-to-treat population).
(DOCX)
S1 Text. Study protocol.
(PDF)
S2 Text. Amendments to the study protocol.
(PDF)
S3 Text. CONSORT checklist.
(DOC)
Acknowledgments
It gives us a great pleasure in acknowledging the support and help of Gudrun Haile and Jeann-ette Beyer during the recruitment and study performance. Furthermore, we are very grateful for the wonderful support of the study by Uschi Handel for the preparation of the data base.
Author Contributions
Conceived and designed the experiments: MF HD ARP BK. Performed the experiments: MF ARP. Analyzed the data: MF. Contributed reagents/materials/analysis tools: LH DT. Wrote the paper: MF ARP HD.
References
1. Lucas A, Boyes S, Bloom SR, Aynsley-Green A (1981) Metabolic and endocrine responses to a milk feed in six-day-old term infants: differences between breast and cow's milk formula feeding. Acta Pae-diatr Scand 70: 195–200. PMID:7015784
2. Madsen AL, Schack-Nielsen L, Larnkjaer A, Molgaard C, Michaelsen KF (2010) Determinants of blood glucose and insulin in healthy 9-month-old term Danish infants; the SKOT cohort. Diabet Med 27: 1350–1357. doi:10.1111/j.1464-5491.2010.03134.xPMID:21059086
3. Salmenpera L, Perheentupa J, Siimes MA, Adrian TE, Bloom SR, et al. (1988) Effects of feeding regi-men on blood glucose levels and plasma concentrations of pancreatic hormones and gut regulatory peptides at 9 months of age: comparison between infants fed with milk formula and infants exclusively breast-fed from birth. J Pediatr Gastroenterol Nutr 7: 651–656. PMID:3183869
4. Wallensteen M, Lindblad BS, Zetterstrom R, Persson B (1991) Acute C-peptide, insulin and branched chain amino acid response to feeding in formula and breast fed infants. Acta Paediatr Scand 80: 143–
5. Arenz S, Ruckerl R, Koletzko B, von Kries R (2004) Breast-feeding and childhood obesity—a
system-atic review. Int J Obes Relat Metab Disord 28: 1247–1256. PMID:15314625
6. Owen CG, Martin RM, Whincup PH, Smith GD, Cook DG (2006) Does breastfeeding influence risk of type 2 diabetes in later life? A quantitative analysis of published evidence. Am J Clin Nutr 84: 1043–
1054. PMID:17093156
7. Koletzko B, von Kries R, Closa R, Escribano J, Scaglioni S, et al. (2009) Lower protein in infant formula is associated with lower weight up to age 2 y: a randomized clinical trial. Am J Clin Nutr 89: 1836–
1845. doi:10.3945/ajcn.2008.27091PMID:19386747
8. Wright CJ, Atkinson FS, Ramalingam N, Buyken AE, Brand-Miller JC (2015) Effects of human milk and formula on postprandial glycaemia and insulinaemia. Eur J Clin Nutr 25: 29.
9. Holub I, Gostner A, Theis S, Nosek L, Kudlich T, et al. (2010) Novel findings on the metabolic effects of the low glycaemic carbohydrate isomaltulose (Palatinose). Br J Nutr 103: 1730–1737. doi:10.1017/
S0007114509993874PMID:20211041
10. Lina BA, Jonker D, Kozianowski G (2002) Isomaltulose (Palatinose): a review of biological and toxico-logical studies. Food Chem Toxicol 40: 1375–1381. PMID:12387299
11. van Can JG, Ijzerman TH, van Loon LJ, Brouns F, Blaak EE (2009) Reduced glycaemic and insulinae-mic responses following isomaltulose ingestion: implications for postprandial substrate use. Br J Nutr 102: 1408–1413. doi:10.1017/S0007114509990687PMID:19671200
12. ESFA. Available:http://www.efsa.europa.eu/sites/default/files/scientific_output/files/main_documents/ 1423.pdf, downloaded 27.01.2016.
13. Agostoni C, Decsi T, Fewtrell M, Goulet O, Kolacek S, et al. (2008) Complementary feeding: a commen-tary by the ESPGHAN Committee on Nutrition. J Pediatr Gastroenterol Nutr 46: 99–110. PMID:
18162844
14. Group WMGRS (2006) WHO child growth standards: length/height-for-age, age, weight-for-length, weight-for-height and body mass index-for-age: Methods and development. Geneva, World Health Organization.
15. Slaughter MH, Lohman TG, Boileau RA, Horswill CA, Stillman RJ, et al. (1988) Skinfold equations for estimation of body fatness in children and youth. Hum Biol 60: 709–723. PMID:3224965
16. Foster-Powell K, Holt SH, Brand-Miller JC (2002) International table of glycemic index and glycemic load values: 2002. Am J Clin Nutr 76: 5–56. PMID:12081815
17. Dodd H, Williams S, Brown R, Venn B (2011) Calculating meal glycemic index by using measured and published food values compared with directly measured meal glycemic index. Am J Clin Nutr 94: 992–
996. doi:10.3945/ajcn.111.012138PMID:21831990
18. Mercodia Mercodia Ultrasensitive Insulin ELISA 10-1132-01. Uppsala, Sweden: Mercodia 2010. 19. Haschke F, van't Hof MA (2000) Euro-Growth references for length, weight, and body circumferences.
Euro-Growth Study Group. J Pediatr Gastroenterol Nutr 31: S14–38. PMID:10896087
20. COMMISSION DIRECTIVE 2006/141/EC of 22 December 2006 on infant formulae and follow-on for-mulae and amending Directive 1999/21/EC p. L 401/2.
21. Zukerman S, Glendinning JI, Margolskee RF, Sclafani A (2009) T1R3 taste receptor is critical for sucrose but not Polycose taste. Am J Physiol Regul Integr Comp Physiol 296: 17.
22. Lucas A, Sarson DL, Blackburn AM, Adrian TE, Aynsley-Green A, et al. (1980) Breast vs bottle: endo-crine responses are different with formula feeding. Lancet 1: 1267–1269. PMID:6104082
23. Maeda A, Miyagawa J, Miuchi M, Nagai E, Konishi K, et al. (2013) Effects of the naturally-occurring disaccharides, palatinose and sucrose, on incretin secretion in healthy non-obese subjects. J Diabetes Investig 4: 281–286. doi:10.1111/jdi.12045PMID:24843667
24. Keyhani-Nejad F, Irmler M, Isken F, Wirth EK, Beckers J, et al. (2014) Nutritional strategy to prevent fatty liver and insulin resistance independent of obesity by reducing glucose-dependent insulinotropic polypeptide responses in mice. Diabetologia 28: 28.
25. Konig D, Theis S, Kozianowski G, Berg A (2012) Postprandial substrate use in overweight subjects with the metabolic syndrome after isomaltulose (Palatinose) ingestion. Nutrition 28: 651–656. doi:10.
1016/j.nut.2011.09.019PMID:22264450
26. Tonouchi H, Yamaji T, Uchida M, Koganei M, Sasayama A, et al. (2011) Studies on absorption and metabolism of palatinose (isomaltulose) in rats. Br J Nutr 105: 10–14. doi:10.1017/
S0007114510003193PMID:20807468
27. Le Huerou-Luron I, Blat S, Boudry G (2010) Breast- v. formula-feeding: impacts on the digestive tract and immediate and long-term health effects. Nutr Res Rev 23: 23–36. doi:10.1017/
28. Suzuki S, Koga M (2014) Glycemic control indicators in patients with neonatal diabetes mellitus. World J Diabetes 5: 198–208. doi:10.4239/wjd.v5.i2.198PMID:24748932
29. Jansen H, Huiting HG, Scholtens S, Sauer PJ, Stolk RP (2011) HbA1c in nondiabetic Dutch infants aged 8–12 months: the GECKO-Drenthe birth cohort study. Diabetes Care 34: 403–405. doi:10.2337/
dc10-1100PMID:21270198
30. Bowman P, McDonald TJ, Shields BM, Knight BA, Hattersley AT (2012) Validation of a single-sample urinary C-peptide creatinine ratio as a reproducible alternative to serum C-peptide in patients with Type 2 diabetes. Diabet Med 29: 90–93. doi:10.1111/j.1464-5491.2011.03428.xPMID:21883437
31. Oram RA, Rawlingson A, Shields BM, Bingham C, Besser RE, et al. (2013) Urine C-peptide creatinine ratio can be used to assess insulin resistance and insulin production in people without diabetes: an observational study. BMJ Open 3: 2013–003193.
32. Besser RE, Ludvigsson J, Jones AG, McDonald TJ, Shields BM, et al. (2011) Urine C-peptide creati-nine ratio is a noninvasive alternative to the mixed-meal tolerance test in children and adults with type 1 diabetes. Diabetes Care 34: 607–609. doi:10.2337/dc10-2114PMID:21285386
33. Socha P, Grote V, Gruszfeld D, Janas R, Demmelmair H, et al. (2011) Milk protein intake, the meta-bolic-endocrine response, and growth in infancy: data from a randomized clinical trial. Am J Clin Nutr 94: 17.
34. Weber M, Grote V, Closa-Monasterolo R, Escribano J, Langhendries JP, et al. (2014) Lower protein content in infant formula reduces BMI and obesity risk at school age: follow-up of a randomized trial. Am J Clin Nutr 99: 1041–1051. doi:10.3945/ajcn.113.064071PMID:24622805
35. Foterek K, Hilbig A, Alexy U (2014) Breast-feeding and weaning practices in the DONALD study: age and time trends. J Pediatr Gastroenterol Nutr 58: 361–367. doi:10.1097/MPG.0000000000000202
PMID:24126834
36. Fallani M, Amarri S, Uusijarvi A, Adam R, Khanna S, et al. (2011) Determinants of the human infant intestinal microbiota after the introduction of first complementary foods in infant samples from five Euro-pean centres. Microbiology 157: 1385–1392. doi:10.1099/mic.0.042143-0PMID:21330436
37. Tori AJ, Carroll AE, Gupta SK (2007) Disaccharidase activity in infants and comparison based on symp-toms and histological changes. J Pediatr Gastroenterol Nutr 45: 194–198. PMID:17667715
38. Blaak EE, Antoine JM, Benton D, Bjorck I, Bozzetto L, et al. (2012) Impact of postprandial glycaemia on health and prevention of disease. Obes Rev 13: 923–984. doi:10.1111/j.1467-789X.2012.01011.x
PMID:22780564
39. Varma V, Boros L, Nolen G, Chang C-W, Wabitsch M, et al. (2014) Metabolic fate of fructose in human adipocytes: a targeted 13C tracer fate association study. Metabolomics: 1–16.