INSTITUTO SUPERIOR DE CIÊNCIAS DA SAÚDE
EGAS MONIZ
MESTRADO EM NUTRIÇÃO CLÍNICA
EFFECT OF THE INGESTION OF A MOUSSE WITH CINNAMON
C. BURMANNII ON THE POSTPRANDIAL BLOOD GLUCOSE
RESPONSE OF HEALTHY SUBJECTS AND ITS ANTIOXIDANT
POWER
Trabalho submetido por
Catarina Medeiros Amaral
para a obtenção do grau de Mestre em Nutrição Clínica
Acknowledgements
1
Acknowledgements
I dedicate a word of appreciation to all those who directly or indirectly contributed to make this work possible.
To the mentor of the this work, Alexandra Bernardo (Associate Professor), thank you for all the support, orientation and for the availability provided during the research project and dissertation development.
To Margarida Moncada (Associate Professor), I trully appreciate all the help and important contribute to this research.
To Paula Pereira (Associate Professor), thank you for the support and the sharing of knowledge.
To Leonor Silva (MSc), thank you for all the help, availability and patience.
To José Brito (Full Professor) for the availability and help in all the statistical process. A sincere thank you to Maria Fernanda Mesquita (Full Professor), for being the driving force behind this project, the sharing of knowledge and support throughout the whole project.
I also express my gratitude to all those who volunteered to participate in the study, since they provided a major contribution to the realization of it and for the advancement of scientific knowledge in this area.
To my co-workers Rita, Sara and André, thank you for all the support and encouragement. To my friends, that helped and supported me throughout all this process, thank you.
2 Abstract
Background: Cinnamon has been shown to reduce postprandial glycaemia and enhance
insulin sensitivity in healthy adults.
Aims: To study the effect of C. burmannii on the postprandial blood glucose response of healthy subjects and its antioxidant capacity in a semi-solid food.
Design: Twenty four apparently healthy subjects participated in this study. They were randomly assigned in group A (reference meal) or group B (test meal). The blood glucose concentrations were measured before the ingestion of the meals and 30, 60, 90 and 120 minutes after the start of the meal. The test meal used consisted of 100 g of mousse mixed with 3 g of cinnamon.
Results: The addition of 3 g of cinnamon to the mousse had no significant effect in blood glucose response in terms of the areas under the curve (AUC) and in the different postprandial times (p>0,05). The mean Cmax was significantly lower after the ingestion of the reference meal than after the ingestion of the mousse with 3 g of C.burmannii (96 mg/dl VS 104,42 mg/dl; p=0,011). The chemical analysis showed that the mousse with 3 g of cinnamon has a much higher phenolic content and antioxidant capacity than the mousse without cinnamon.
Conclusions: The inclusion of cinnamon in the mousse increased the antioxidant capacity
of this semi-solid food, however it did not reduce the postprandial glucose response in healthy subjects.
Resumo
3 Resumo
Enquadramento: Em indivíduos saudáveis, tem sido demonstrado que a canela reduz a
glicémia pós-prandial e melhora a sensibilidade à insulina.
Objectivos: Estudar o efeito da C. burmannii na resposta glicémica pós-prandial de indivíduos saudáveis e a sua capacidade antioxidante num alimento semi-sólido.
Metodologia: Vinte e quatro indivíduos, aparentemente saudáveis, participaram neste estudo. Foram aleatoriamente distribuídos no grupo A (refeição padrão) ou no grupo B (refeição teste). As concentrações de glicose no sangue foram medidas antes da ingestão das refeições e 30, 60, 90 e 120 minutos após o início da refeição. A refeição teste consistiu em 100 g de mousse com 3 g de canela.
Resultados: A adição de 3 g de canela à mousse não teve um efeito significativo na resposta glicémica em termos da área abaixo da curva (AUC) e nos diferentes tempos pós-prandiais (p>0,05). O valor médio de Cmax foi significativamente mais baixo após a ingestão da refeição padrão, do que após a ingestão da mousse com 3 g de C.burmannii (96 mg/dl VS 104,42 mg/dl; p=0,011). A análise química revelou que a mousse com 3 g de canela possuí um teor em fenóis e uma capacidade antioxidante muito maior do que a mousse sem canela.
Conclusões: A inclusão de canela na mousse aumentou a capacidade antioxidante deste alimento semi-sólido, no entanto, não reduziu a glicémia pós-prandial de indivíduos saudáveis.
4
Contents
Acknowledgements ... 1
Abstract ... 2
Key-words. ... 2
Resumo ... 3
1. Introduction ... 9
2. Objectives ... 17
2.1. Specific Objectives ... 17
3. Methodology ... 19
3.1. Subjects ... 19
3.2. Study design ... 19
3.3. Test meal preparation and constitution ... 20
3.4. Chemical Analysis ... 21
3.5. Statistical Analysis ... 24
4. Results ... 27
4.1. Meals Characterization ... 27
4.2. Sample Characterization ... 29
4.3 Postprandial blood glucose response ... 33
5. Discussion ... 37
6. Conclusion ... 40
7. References ... 45
List of Figures
5
List of Figures
Figure 1 -A model of actions by CP in the insulin signal transduction pathway………...12 Figure 2 – Study design …..………19 Figure 3- Reduction of the β,β’-azino-bis (3-ethylbenzothiazoline-6-sulfonic acid) (ABTS) radical caption in the presence of C.burmannii ………..28 Figure 4 - Characterization of the sample by gender ……….β9
Figure 5 – Characterization of smoking habits and physical activity ………...… β9 Figure 6 – Sample characterization by BMI classes (Underweight: BMI <18,5kg/m2; Regular weight: 18,5 kg/m2≤ BMI ≥ β4,9 kg/m2; Overweight: 25 kg/m2≤ BMI ≥ β9,9
kg/m2) ………..γ0
6
List of Tables
Table 1 - Extract composition of Cinnamon Stick (C.burmannii) ... 10 Table 2 - Clinical trials with cinnamon... 13 Table 3 - Alimentary composition of the reference meal and test meal ... 27 Table 4 - Antioxidant characterization: Total Phenolic Content, Proanthocyanidins quantification, FRAP, TEAC and TAS tests of the meals with and without cinnamon
C.burmannii ... 27 Table 5 -Age and anthropometric mean values of subjects in each group ... 30 Table 6 – Clinical history of the subjects………...……….γ1
Table 7 - Energy and macronutrient intake mean measurements in the day prior to the
intervention ... 32 Table 8 - Energy and macronutrient intake mean measurements of the last meal in the day
prior to the intervention ………...32
Table 9 – Mean time of overnight fast in group A and group B ...…...33 Table 10 - Mean blood glucose concentrations in healthy subjects after ingestion of
mousse with or without added cinnamon ... 34 Table 11 - Individual blood glucose levels after the ingestion of a mousse without
cinnamon (mg/dl), maximum concentration (Cmax) and respective means ... 34 Table 12 - Individual blood glucose levels after the ingestion of a mousse with 3 g of
cinnamon (mg/dl), maximum concentration (Cmax) and respective means ... 35 Table 13 – Postprandial blood glucose area under the curves (AUCs) in healthy subjects
List of Abbreviations
7
List of Abbreviations
AUC - Area under the curve BMI - Body mass index
Cmax - Maximum concentration CP – Cinnamon polyphenols
FRAP - Ferric reducing antioxidant potential GE – Gastric emptying
GI – Glycemic index
GIP - Glucose-dependent insulinotropic polypeptide GLP-1 - Glucagon-like peptide-1
GLUT4 - Glucose transporter 4 IFG - Impaired fasting glucose
IR - Insulin receptor PTA - Phosphotungstic acid R24 - Dietary recall
SEM - Standard error of the mean SMM – Skeletal muscle mass TAS - Total antioxidant capacity
TEAC - Trolox equivalent antioxidant capacity TTP - Tristetrapolin
Introduction
9
1.
Introduction
It is known that numerous spices have medicinal properties and beneficial effects on health (Shan, Cai, Sun & Corke, 2005). Cinnamonleaves and bark are used extensively as spices (Vasanthi & Parameswari, 2010). Cinnamon from Sri Lanka is the cinnamon commonly commercialized and comes from the tree C. verum, which belongs to the family Lauraceae. C. Burmannii is native from Southeast Asian and Indonesia, and is cultivated with commercial purposes in the Islands of Indonesia (Hardman, 2004).
Besides being used as a spice, cinnamon has also been used as a medicinal herb. It was mainly used for gastrointestinal complaints but nowadays cinnamon has been associated with a positive effect on postprandial glucose metabolism, being the treatment of type 2 diabetes mellitus (T2DM) the most promising field of research for cinnamon (Ulbricht et al, 2011). Besides this association with glucose and insulin metabolism, it is described that cinnamon has various potential effects such as anti-inflammatory, antibacterial, antifungal, and antioxidant properties (Shan et al, 2005; Shan et al, 2007; Ulbricht et al, 2011) and these effects are associated with their constituents. The nutritional and chemical composition of cassia bark has been studied, and range as it follows: moisture
(6.5-11.9%), crude fiber (12.0-28.8%), carbohydrate (6.9-32.0%), protein (3.1-3.4%), fixed oil
(0-2.1%), volatile oil (0.5- 5.1%). Among these, the constituent of commercial importance is
10
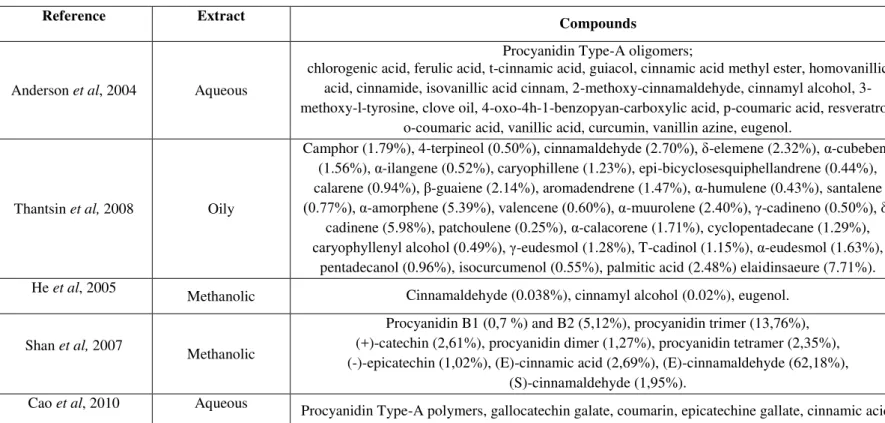
Table 1 –Extract composition of Cinnamon Stick (C.burmannii)
Reference Extract Compounds
Anderson et al, 2004 Aqueous
Procyanidin Type-A oligomers;
chlorogenic acid, ferulic acid, t-cinnamic acid, guiacol, cinnamic acid methyl ester, homovanillic acid, cinnamide, isovanillic acid cinnam, 2-methoxy-cinnamaldehyde, cinnamyl alcohol, 3-methoxy-l-tyrosine, clove oil, 4-oxo-4h-1-benzopyan-carboxylic acid, p-coumaric acid, resveratrol,
o-coumaric acid, vanillic acid, curcumin, vanillin azine, eugenol.
Thantsin et al, 2008 Oily
Camphor (1.79%), 4-terpineol (0.50%), cinnamaldehyde (β.70%), δ-elemene (2.32%), α-cubebene (1.56%), α-ilangene (0.52%), caryophillene (1.23%), epi-bicyclosesquiphellandrene (0.44%), calarene (0.94%), -guaiene (2.14%), aromadendrene (1.47%), α-humulene (0.43%), santalene
(0.77%), α-amorphene (5.γ9%), valencene (0.60%), α-muurolene (β.40%), -cadineno (0.50%), δ -cadinene (5.98%), patchoulene (0.25%), α-calacorene (1.71%), cyclopentadecane (1.29%),
caryophyllenyl alcohol (0.49%), -eudesmol (1.28%), T-cadinol (1.15%), α-eudesmol (1.63%), pentadecanol (0.96%), isocurcumenol (0.55%), palmitic acid (2.48%) elaidinsaeure (7.71%). He et al, 2005
Methanolic Cinnamaldehyde (0.038%), cinnamyl alcohol (0.02%), eugenol.
Shan et al, 2007
Methanolic
Procyanidin B1 (0,7 %) and B2 (5,12%), procyanidin trimer (13,76%), (+)-catechin (2,61%), procyanidin dimer (1,27%), procyanidin tetramer (2,35%), (-)-epicatechin (1,02%), (E)-cinnamic acid (2,69%), (E)-cinnamaldehyde (62,18%),
(S)-cinnamaldehyde (1,95%). Cao et al, 2010 Aqueous
Introduction
11
The compounds present in C.burmannii that have an antioxidant effect and also seem to exhibit insulin-like activity in cells, have been identified as procyanidin type-A (doubly linked) polymers (Anderson et al, 2004; Cao, Polansky & Anderson, 2007; Cao, Graves & Anderson, 2010). Anderson (2004) found out that these polyphenolic compounds, present as monomers or oligomers, are responsible for insulin enhancing activity in epididymal fat cells, in vitro.
To explore the molecular basis of insulin-like activity of cinnamon with doubly-linked procyanidin type-A polymers, studies (Cao et al, 2007; Cao et al, 2010) were develop to investigate the effects of cinnamon polyphenols (CP) on the regulation of
insulin receptor (IR ), glucose transporter 4 (GLUT4) and, anti-inflammatory protein, tristetrapolin (TTP) in mouse 3T3-L1 adipocytes. These three proteins are involved in the insulin signaling transduction pathway. Their results suggest that the mechanism of
cinnamon’s insulin-like activity may be in part due to increases in the amounts of proteins
involved in insulin signaling, such as TTP, IR , and GLUT4. Based on these results and previous studies (Jarvill-Taylor, Karalee, Anderson & Graves, 2001; Anderson et al,
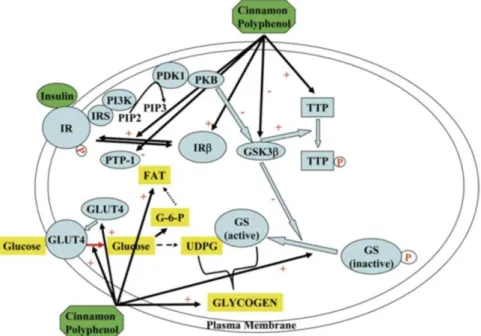
2004), Cao (2010) proposed a model (see Figure 1) which shows that cinnamon polyphenols may interfere in multiple steps of the insulin signaling transduction pathway:
(1) activating insulin receptors by increasing their tyrosine phosphorylation activity and by decreasing phosphatase activity that inactivates the receptor (Imparl-Radosevich et al, 1998);
(2) increasing glycogen synthase activity and glycogen accumulation (Jarvill-Taylor et al, 2001);
(3) decreasing GSKγ activity, which phosphorylates TTP, leading to an increase in TTP activity (Jarvill-Taylor et al, 2001);
12
Figure 1 - A model of actions by CP in the insulin signal transduction pathway. Adapted from Cao
(2007)
By increasing the amount of IR protein, GLUT4 and TTP in the cells (Cao et al,
2010), these polyphenols improve insulin sensitivity and glucose uptake in adipocytes, leading to more efficient glucose transport and utilization (Anderson, 2008; Ulbricht et al, 2011). In addition, CP-induced TTP accumulation in 3T3-L1 adipocytes may have beneficial effects on the condition of diabetic people by down-regulating the synthesis of pro-inflammatory cytokines (Cao et al, 2007). These phenolic compounds are also known to play an important role in stabilizing lipid peroxidation and to inhibit various types of oxidizing enzymes (Shan et al, 2005).
Introduction
13
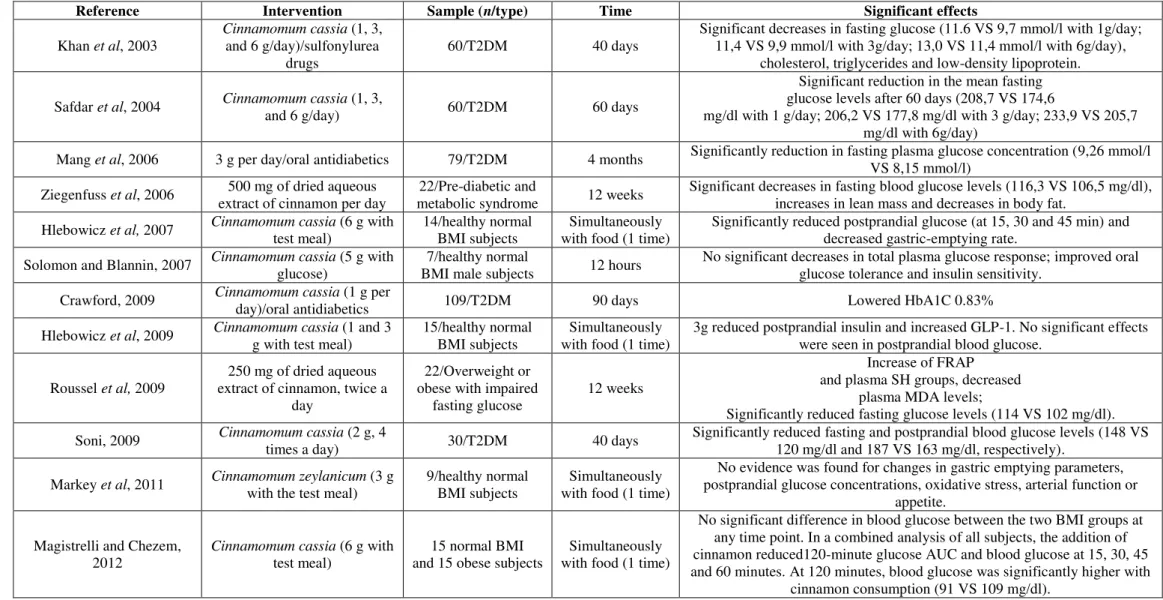
Table 2 - Clinical trials with cinnamon
Reference Intervention Sample (n/type) Time Significant effects
Khan et al, 2003
Cinnamomum cassia (1, 3, and 6 g/day)/sulfonylurea
drugs
60/T2DM 40 days
Significant decreases in fasting glucose (11.6 VS 9,7 mmol/l with 1g/day; 11,4 VS 9,9 mmol/l with 3g/day; 13,0 VS 11,4 mmol/l with 6g/day),
cholesterol, triglycerides and low-density lipoprotein.
Safdar et al, 2004 Cinnamomum cassia (1, 3,
and 6 g/day) 60/T2DM 60 days
Significant reduction in the mean fasting glucose levels after 60 days (208,7 VS 174,6
mg/dl with 1 g/day; 206,2 VS 177,8 mg/dl with 3 g/day; 233,9 VS 205,7 mg/dl with 6g/day)
Mang et al, 2006 3 g per day/oral antidiabetics 79/T2DM 4 months Significantly reduction in fasting plasma glucose concentration (9,26 mmol/l VS 8,15 mmol/l)
Ziegenfuss et al, 2006 500 mg of dried aqueous extract of cinnamon per day
22/Pre-diabetic and
metabolic syndrome 12 weeks
Significant decreases in fasting blood glucose levels (116,3 VS 106,5 mg/dl), increases in lean mass and decreases in body fat.
Hlebowicz et al, 2007 Cinnamomum cassia (6 g with test meal)
14/healthy normal BMI subjects
Simultaneously with food (1 time)
Significantly reduced postprandial glucose (at 15, 30 and 45 min) and decreased gastric-emptying rate.
Solomon and Blannin, 2007 Cinnamomum cassia (5 g with glucose)
7/healthy normal
BMI male subjects 12 hours
No significant decreases in total plasma glucose response; improved oral glucose tolerance and insulin sensitivity.
Crawford, 2009 Cinnamomum cassia (1 g per
day)/oral antidiabetics 109/T2DM 90 days Lowered HbA1C 0.83%
Hlebowicz et al, 2009 Cinnamomum cassia (1 and 3 g with test meal)
15/healthy normal BMI subjects
Simultaneously with food (1 time)
3g reduced postprandial insulin and increased GLP-1. No significant effects were seen in postprandial blood glucose.
Roussel et al, 2009
250 mg of dried aqueous extract of cinnamon, twice a
day
22/Overweight or obese with impaired
fasting glucose
12 weeks
Increase of FRAP and plasma SH groups, decreased
plasma MDA levels;
Significantly reduced fasting glucose levels (114 VS 102 mg/dl). Soni, 2009 Cinnamomum cassia (2 g, 4
times a day) 30/T2DM 40 days
Significantly reduced fasting and postprandial blood glucose levels (148 VS 120 mg/dl and 187 VS 163 mg/dl, respectively).
Markey et al, 2011 Cinnamomum zeylanicum (3 g with the test meal)
9/healthy normal BMI subjects
Simultaneously with food (1 time)
No evidence was found for changes in gastric emptying parameters, postprandial glucose concentrations, oxidative stress, arterial function or
appetite.
Magistrelli and Chezem, 2012
Cinnamomum cassia (6 g with test meal)
15 normal BMI and 15 obese subjects
Simultaneously with food (1 time)
No significant difference in blood glucose between the two BMI groups at any time point. In a combined analysis of all subjects, the addition of cinnamon reduced120-minute glucose AUC and blood glucose at 15, 30, 45 and 60 minutes. At 120 minutes, blood glucose was significantly higher with
14
Considering the observation that cinnamon enhances insulin activity in vitro, Khan, Mahpara, Mohamma, Khan & Richard (2003) conducted the first randomized, double-blind, placebo-controlled clinical trial to evaluate the effect of cinnamon in individuals on sulfonylurea drug therapy with type 2 diabetes. A total of 60 subjects were divided randomly into six groups. The first three groups were given 1, 3 or 6 g of
Cinnamomum cassiain pill form daily, while the other three groups consumed the same amounts of placebo capsules. After 40 days, all participants in the groups taking cinnamon reduced fasting glucose, cholesterol, triglycerides and low-density lipoprotein, however no significant changes were observed in the group taking the placebo. The study indicated a benefit of cinnamon supplementation at low levels (1-6 g/day).
Several clinical trials on the effect of cinnamon in diabetic subjects have been
conducted since then. Hlebowicz, Darwiche, Björgell & Almér (2007) conducted a study in healthy subjects, in which the addition of 6 g of cinnamon to rice pudding significantly delayed gastric emptying and lowered the postprandial blood glucose levels. Hlebowicz (2007) concluded that the reduction in the postprandial blood glucose response observed after the ingestion of cinnamon could be partially explained by the reduction in gastric emptying rate, since this is a major factor in blood glucose homeostasis in normal subjects.
However, not all clinical trials have reported a reduction on fasting and postprandial blood glucose levels after the consumption of cinnamon or extracts of cinnamon. Markey et al (2011) developed a single-blind, randomized, crossover study in nine healthy subjects. The subjects had to consume a test meal that consisted of three pancakes served with 20 g of chocolate spread and 300 ml of water, with 8 gelatin capsules, totaling 3 g of cinnamon, or a wheat flour placebo. Nevertheless, the supplementation of 3 g of cinnamon did not alter the postprandial response to a high-fat test meal and no changes in gastric emptying parameters, postprandial triacylglycerol, glucose concentrations, oxidative stress, arterial function or appetite were observed (Markey et al, 2011).
Introduction
15
Objectives
17
2.
Objectives
The purpose of this investigation is to study the effect of cinnamon C. burmannii
on the postprandial blood glucose response of healthy subjects and characterize the antioxidant capacity of a semi-solid food with and without 3g of C. burmannii.
2.1. Specific Objectives
Ascertain the antioxidant capacity of the mousse with and without cinnamon C. burmannii;
Determine, in healthy subjects, if there are significant differences in the mean values of capillary blood glucose at different postprandial times, after the ingestion of a mousse without cinnamon and after the ingestion of a mousse with 3 g of C.burmannii;
Methodology
19
3.
Methodology
3.1.Subjects
The subjects were recruited from the student population of Instituto Superior de Ciências da Saúde Egas Moniz, were all over 18 years old and healthy.
3.2. Study design
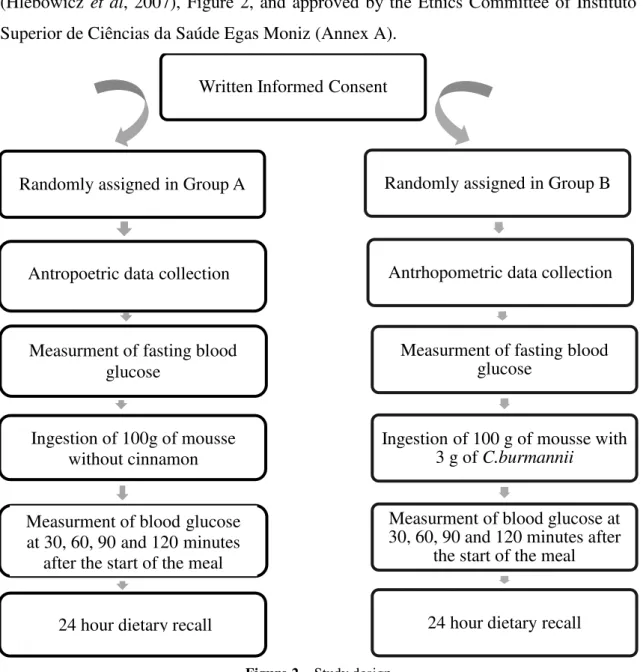
The study was designed by adaptation of the method described by Hlebowicz (Hlebowicz et al, 2007), Figure 2, and approved by the Ethics Committee of Instituto Superior de Ciências da Saúde Egas Moniz (Annex A).
Figure 2 – Study design
Written Informed Consent
Randomly assigned in Group B
Antrhopometric data collection
Measurment of fasting blood glucose
Ingestion of 100 g of mousse with 3 g of C.burmannii
Measurment of blood glucose at 30, 60, 90 and 120 minutes after
the start of the meal
24 hour dietary recall Randomly assigned in Group A
Antropoetric data collection
Measurment of fasting blood glucose
Ingestion of 100g of mousse without cinnamon
24 hour dietary recall Measurment of blood glucose at 30, 60, 90 and 120 minutes
20
All the subjects gave their written informed consent (Annex B) before the study began and knew that they could withdraw from the study at any time. They were randomly assigned in group A (reference meal) or group B (test meal) and were required to have a normal fasting blood glucose level on the day of the study. The subjects were examined in the morning between 8:00 and 12:00 after an 8 hour fasting. Finger-prick capillary blood samples were collected before the ingestion of the meals and 30, 60, 90 and 120 minutes after the start of the meal to determine the blood glucose levels. Blood glucose concentrations were measured with the OneTouch Vita® glucometer, which has an accuracy of 98%. The meals were ingested within 5 minutes.
The anthropometric data was recorded (Annex C) through bio-impedance body fat analyzer InBody® 230 and the height was measured by the stadiometer Craveira Jofre.
Each subject responded to a 24 hour dietary recall (R24, Annex D) to eliminate bias with regard to hours of fasting, composition of the meals and cooking process. No specific diet was imposed and the participants consumed their usual diet. The practice of physical activity was also evaluated through a questionnaire, and was also recorded in the clinical data of the subjects (Annex E).
3.3.Test meal preparation and constitution
Methodology
21 3.4. Chemical Analysis
3.4.1.Chemicals and reagents
The reagents Ferric Chloride (III) hexahydrate (FeCl3.6H2O), folin-ciocalteu (2,2-Azinobis(3-ethylbenzothiazoline-6-sulfonic acid)), Trolox (6-hydroxy-2,5,7,8-tetramethylchromane-2-carboxylic acid), TPTZ 2,4,6-tri(2-piridil)-s-triazine, ethanol (CH3CH2OH), methanol (CH3OH), potassium persulfate (K2SO4), ABTS (2,2'-azino-bis(3-ethylbenzothiazoline-6-sulphonic acid) diammonium salt and 1-buthanol (C4H10O) were purchased from Sigma-Aldrich, gallic acid-1-hydrate (C6H2(OH)3COOH.H2O) was purchased from Acros Organics and sodium carbonate (Na2CO3) was from ICS Science group.
The following solutions were prepared: chloridric acid 40 mM (HCl 37% purchased to Sigma-Aldrich), phosphate buffer pH=7 (NaH2PO4 e Na2HPO4 purchased to Scharlau), acetate buffer 300 mM pH=3,6 (NaCH3COO.3H2O and CH3COOH purchased to AnalaR Normapur).
3.4.2. Methodology
3.4.2.1. Extract preparation
The mousse was subjected to a hydro-ethanolic extract (20:80). Posteriorly, the mixture was filtered using the Whatman paper filter. Homogeneous samples were obtained and subjected to chemical analysis.
3.4.2.2. Total Phenolic Content
22
Gallic acid was used as the standard solution (Y=0,0034X+0,018 (R2=0,9966)) and the results were expressed in mg of gallic acid equivalents (GAE) / L.
3.4.2.3. Quantification of Proanthocyanidins
Quantification of proanthocyanidins was determined by an adaptation of the method described by Gu et al (2002). This method is based on the acid hydrolyze of proanthocyanidins polymers, to produce reddish chromophores such as cyanidin and delphinidin. The greater the absorbance value, the greater the content of proanthocyanidins.
All measurements were done in triplicate: 150 μL of each sample was pipette, to capped tubes, to which was added 2850 µl of HCl/1-buthanol solution (10%V/V). A blank solution was prepared, in which the sample was replaced by 150 μl of ethanol:water (80:20). After agitation and incubation at 100 ºC for 50 min, the absorbance was read at 550 nm using a Perkin Elmer Lambda 25 UV-Vis spectrophotometer.
3.4.2.4. Characterization of the antioxidant capacity of the meals 3.4.2.4.1. Ferric Reducing Antioxidant Potential (FRAP) assay
This method was adapted from the method described by Thaipong, Boonprako, Crosby, Cisneros-Zevallos & Byrne (2006) and is based on the capacity of the antioxidants to reduce Fe3+, a colorless ferric complex to a blue-colored ferrous complex, Fe2+ in the presence of 2,4,6-tri(2-piridil)-s-triazine (TPTZ).
Methodology
23
The Trolox (6-hydroxy-2,5,7,8-tetramethylchroman-2-carboxylic acid), vitamin E analogous, was used as standard ( Y=2,17x10⁻³X+2,32x10⁻² (R2=0,998)) and results were expressed as μM TE.
3.4.2.4.2. Estimation of Total Antioxidant Capacity by the ABTS+ Method
The capacity of reduction of ABTS.+ radicals by antioxidant compounds was studied through two similar tests: TAS (Total antioxidant capacity ) and TEAC (Total equivalent antioxidant capacity), using the synthetic antioxidant Trolox as standard. The ABTS+ radical is formed by 2,2'-azino-bis(3-ethylbenzothiazoline-6-sulphonic acid (ABTS) by enzymatic pathway (peroxidase TAS) and by the chemical reaction of potassium persulfate (TEAC).
The ABTS is a peroxidase substrate that when oxidized by peroxyl radicals and other oxidants in the presence of hydrogen peroxide generates the meta stable radical cation ABTS.+. The color of this cation is a dark-green, visible in a wavelength of 600 to 750 nm. The antioxidant power is determined by the ability to rescue this radical, resulting in a colorless product. As the antioxidant agent reacts with this cation, the color loses intensity, resulting in a decrease in absorbance values. Thus, the lower the absorbance value, the higher the concentration of antioxidant molecules (Karadag, Ozcelik & Saner, 2009).
3.4.2.4.3 TAS test
This test was executed in the equipment RANDOX, RX Daytona model, using the Kit RANDOX - NX 2332.
24 3.4.2.4.4 TEAC test
Previously a solution was prepared by adding 10 ml of ABTS• 7 mM to 176 μl of potassium persulfate 140 mM, which was incubated at room temperature in the dark for 12 hours. After this time, the solution was diluted in ethanol until it reached an absorbance of 0.7 at 734 nm (about 70 times) (Zulueta, Esteve & Frígola, 2009).
All measurements were done after pipetting 150 μl of the sample and 2850 μl of the ABTS solution in ethanol to capped tubes. A controlled solution was prepared, in which the sample was replaced by 150 μl of ethanol. The absorbance was read at 734 nm:
(Equation 1)
%I – percentage of inhibition
With the purpose of comparing the antioxidant power of the two meals, it was calculated the number of dilutions necessary for the inhibition percentage of the radical reached 50%.
3.5. Statistical Analysis
The database was organized on Microsoft ® Excel 2010 software and the data analysis was carried out with the statistical analysis program SPSS v19.0. The areas under the curves (AUCs) of each subject were measured for blood glucose by using GRAPH PAD PRISM software (version 5.01). The AUC was calculated above zero and the AUC values are presented as means. The maximum concentration of postprandial blood glucose level observed, for each subject, is denoted as Cmax. Significant differences in the mean values of Cmax, fasting blood glucose, AUC levels and time of overnight fast between the two groups were evaluated with the use of a T-test for independent samples. The level of statistical significance was set at p ≤0,05.
A Chi-Square test was applied to evaluate if there were significant differences in the prevalence of family history of diabetes between the two groups.
Methodology
25
Energy, macronutrient and dietary fiber intake in the day prior to the intervention was estimated through The Food Processor v.10.5.0 software. A multiple linear regression was applied to evaluate if the alimentary composition of the last meal (in terms of total caloric value, carbohydrates, fat and protein) in the day before the intervention could influence the fasting glycemic values of each group.
Significant differences between the means of alimentary intake in the day prior to the intervention, in the two groups, were evaluated by a Mann-Whitney U test.
To determine whether there were differences in postprandial blood glucose mean levels at different times (30, 60, 90 and 120 min), between the two groups, a repeated-measures ANOVA and mixed model was applied.
Results
27
4. Results
4.1. Meals Characterization
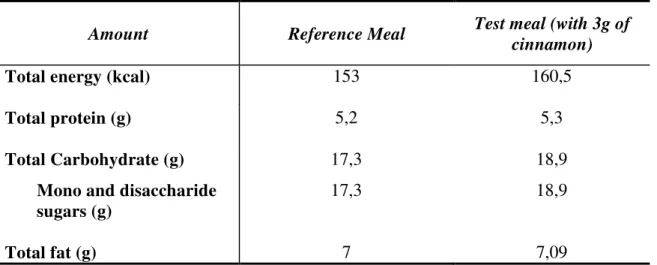
The total caloric value of a portion (≈100g) was 153 kcal: 14% of the energy being derived from protein (5,2 g), 45% from carbohydrate (17,3 g), and 41% from fat (7 g) (see Table 3):
Table 3 - Alimentary composition of the reference meal and test meal
Amount Reference Meal Test meal (with 3g of
cinnamon)
Total energy (kcal) 153 160,5
Total protein (g) 5,2 5,3
Total Carbohydrate (g) 17,3 18,9
Mono and disaccharide sugars (g)
17,3 18,9
Total fat (g) 7 7,09
The alimentary composition of cinnamon was obtained in Tabela da Composição de Alimentos (Porto & Oliveira, 2006).
The results of the chemical analysis of the reference meal and the test meal (with cinnamon) are represented in Table 4:
Table 4 – Antioxidant characterization: Total Phenolic Content, Proanthocyanidins quantification, FRAP,
TEAC and TAS tests of the meals with and without cinnamon C.burmannii
Meal/Assay Reference Meal Test Meal (with 3 g of
C. burmannii) Total Phenolic content
(mg/l gallic acid) 326,8 1246,9
Proanthocyanidins
(abs) 0,137 0,316
FRAP
(μmol TROLOX/l)
(μmol TROLOX/mg phenols)
91,1 0,279
941,4 0,755 TAS
(mmol TROLOX/l) <0,42 20,76
ABTS (IC 50 (nº of dilutions) NA 11,8
28
With the addition of 3 g of C.burmannii to the mousse, the values of total phenolic content ranged from 326,8 mg/l to 1246,9 mg/l of gallic acid, a variation of more than 900 mg, providing this meal a higher phenolic content. The quantification of proanthocyanidins revealed that the test meal also has a higher amount of proanthocyanidins than the reference meal. In the FRAP assay, the values ranged from 91,1 to 941,4 μmol TROLOX/l showing that the total antioxidant capacity of the mousse is ten times higher in the presence of cinnamon. The phenolic compounds present in cinnamon exhibit an antioxidant capacity, as observed by the range in the values of the FRAP assay, from 0,279 to 0,755 μmol TROLOX/mg phenols.
With the purpose of comparing the antioxidant power of the two meals, it was calculated the number of dilutions necessary for the inhibition percentage of the radical ABTS reached 50%. As observed in Figure 3, the mousse without cinnamon has no antioxidant capacity to reduce the ABTS radical at 50%. On the other hand, the mousse with cinnamon showed 50% inhibitory concentration achieved with 11,8 dilutions.
Figure 3 –Reduction of the β,β’-azino-bis (3-ethylbenzothiazoline-6-sulfonic acid) (ABTS) radical
cation in the presence of C.burmannii. 0
10 20 30 40 50 60 70 80 90 100
0 0,1 0,2 0,3 0,4 0,5
Mousse
Mousse with cinnamon
Results
29 4.2. Sample Characterization
Twenty four apparently healthy subjects participated in this study. Of these, 8 (33%) were males and 16 (67%) were females (Figure 4):
Figure 4 - Characterization of the sample by gender
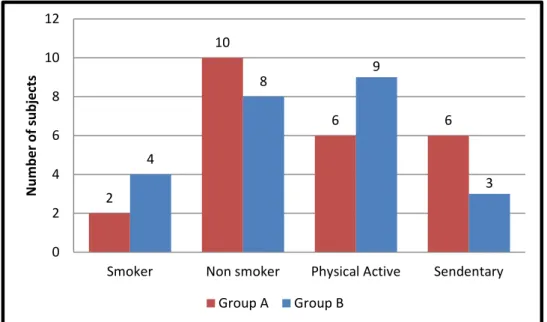
Of the twenty four subjects, more than half were physically active (n=15), being this prevalence higher in the experimental group (Group B). On the other hand, the number of smokers (n=6) was also higher in group B (Figure 5):
Figure 5 – Characterization of smoking habits and physical activity
Men; 5 Women; 7 0 1 2 3 4 5 6 7 8 9 10
Group A Group B
N u m b e r o f su b jec ts
Gender Characterization
Women; 9 Men; 3 2 106 6
4 8 9 3 0 2 4 6 8 10 12
Smoker Non smoker Physical Active Sendentary
N u m b e r o f su b jec ts
30
Mean body mass index (BMI; in kg/m2) was 22,4 ± 2,3 (range 17,9-26,2) in group A and 21,5 ± 3,1 (range 18,2-29,5) in group B. Of the twenty four subjects, none had a BMI higher than 29,9kg/m2. In Figure 6, is represented the sample distribution in terms of BMI, for the control group and experimental group.
Figure 6– Sample characterization by BMI classes (Underweight: BMI <18,5kg/m2;
Regular weight: 18,5 kg/m2≤ BMI ≥ β4,9 kg/m2; Overweight: 25 kg/m2≤ BMI ≥ β9,9 kg/m2)
The anthropometric data, as well as mean age are represented in Table 5:
Table 5 – Age and anthropometric mean values of subjects in each group
Group A Group B
Age (years) 25,1 ± 10,8 25,5 ± 3,3 Weight (kg) 59,9 ± 7,6 60,7 ± 11,6
Height (cm) 163,4 ± 6,1 167,4 ± 7,2 BMI (kg/m2) 22,4 ± 2,3 21,5 ± 3,1
SMM (kg) 24,2 ± 5,4 26,5 ± 5,9
Fat Mass (kg) 16,1 ± 5,9 13,3 ± 5,1 WHR (cm)
Waist line (cm)
0,86 ± 0,04 71,5 ± 7,5
0,83 ± 0,04 71,3 ± 11,7 Values are shown as means ± Standard Deviation (SD)
0 1 2 3 4 5 6 7 8 9 10
Underweight Regular weight Overweight
Results
31
In order to compare the two groups in terms of BMI, WHR, SMM, fat mass and waist line means, the Kaiser-Meyer-Olkin (KMO = 0,65) and Bartlett’s Test of Sphericity (p<0,05) were applied, and then a multivariate analysis of variance (MANOVA) was applied, but no significant differences were observed (p>0,05).
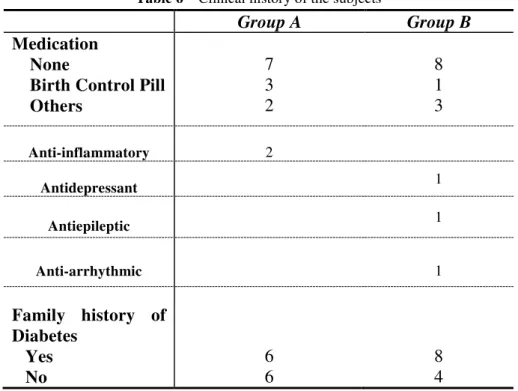
In terms of clinical history of the subjects, some were taking other medication besides the birth control pill. The presence of family history of diabetes was also assessed. A Chi-Square test was applied to evaluate if there were significant differences in the prevalence of family history of diabetes between the two groups. Since some of
the premises weren’t validated, a Fisher’s Exact Test was used to obtain the value of p
(p=0,680), but no significant differences were found in the prevalence of family history of diabetes between the two groups.
Table 6 – Clinical history of the subjects
Group A Group B
Medication None
Birth Control Pill Others 7 3 2 8 1 3 Anti-inflammatory 2
Antidepressant 1
Antiepileptic 1
Anti-arrhythmic 1
Family history of Diabetes Yes No 6 6 8 4
32
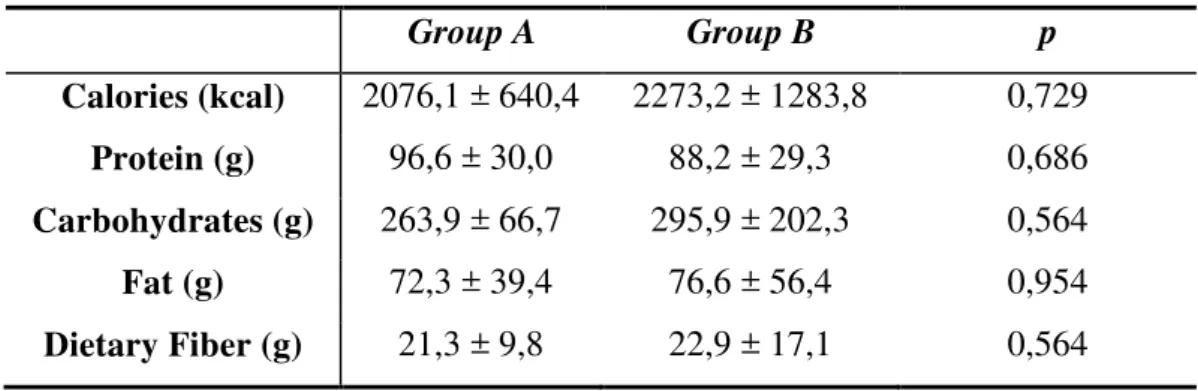
Table 7 - Energy and macronutrient intake mean measurements in the day prior to the intervention
Group A Group B p
Calories (kcal) 2076,1 ± 640,4 2273,2 ± 1283,8 0,729 Protein (g) 96,6 ± 30,0 88,2 ± 29,3 0,686 Carbohydrates (g) 263,9 ± 66,7 295,9 ± 202,3 0,564 Fat (g) 72,3 ± 39,4 76,6 ± 56,4 0,954 Dietary Fiber (g) 21,3 ± 9,8 22,9 ± 17,1 0,564
Values are shown as means ± SD
A multiple linear regression was applied to evaluate if the alimentary composition of the last meal on the day prior to the intervention (see Table 8) could influence the fasting glycemic (T0 moment) values of each group. After verifying the validation of the premises, no significant evidence was found (p>0,05).
Table 8 - Energy and macronutrient intake mean measurements of the last meal in the day prior to the
intervention
Group A Group B p
Calories (kcal) 433,6 ± 288,7 430,4 ± 353,4
>0,05 Protein (g) 16,5 ± 16,9 22,2 ± 23,5
Carbohydrates (g) 60,6 ± 39,3 41,8 ± 34,6 Fat (g) 14,0 ± 12,1 17,4 ± 19,8 Values are shown as means ± SD
After verifying the data normal distribution and homogeneity, an independent sample T-test was aplied to averiguate if there were significant differences in the mean time of overnight fast between the two groups. As observed in Table 9, despite the mean time of overnight fast in group B is slightly higher than the mean time of
overnight fast in group A (10,79 h VS 10,46 h, respectively), no significant differences
Results
33
Table 9– Mean time of overnight fast in group A and group B
Group A Group B p
Time of overnight
fast (hours) 10,46 ± 2,6* 10,79 ± 2,28* 0,744
*Values are shown as means ± SD;
4.3 Postprandial blood glucose response
To determine whether there were differences in postprandial blood glucose mean levels at different times (30, 60, 90 and 120 min), between the two groups, a repeated-measures ANOVA and mixed model was applied. The ingestion of the mousse with 3 g of C. burmannii did not result in a significantly lower blood glucose response at different postprandial times (30, 60, 90 and 120 min) than the reference meal did (p>0,05).
For both groups, the maximum mean value corresponds to T30 (see Table 10 and Figure 7).
Figure 7 –Mean blood glucose concentrations (±SD) in healthy subjects after the ingestion of a mousse:
34
Table 10 - Mean blood glucose concentrations in healthy subjects after ingestion of mousse with or
without added cinnamon Mousse without
cinnamon
Mousse with
cinnamon p
T0 87,08 ± 7,2 90,17 ± 8,5
>0,05 T30* 93,08 ± 9,3 101,42 ± 7,6
T60 88,25 ± 9,1 91,25 ± 9,6 T90 86,58 ± 7,8 92,50 ± 12,5 T120 88,67 ± 8,6 91,00 ± 7,7 Values are shown as means ± SD; *Maximum mean value
Significant differences in the mean values of Cmax, fasting blood glucose and AUC levels between the two groups were evaluated with the use of a T-test for independent samples.
As observed in Table 11 and Table 12, the mean Cmax was significantly lower after the ingestion of the reference meal than after the ingestion of the mousse with 3 g of C.burmannii (96 mg/dl VS 104,42 mg/dl; p=0,011).
Table 11 - Individual blood glucose levels after the ingestion of a mousse without cinnamon (mg/dl),
maximum concentration (Cmax) and respective means Subjects/Time
(min) 0 30 60 90 120 Cmax
1 74 95 86 88 84 95
2 89 91 76 90 81 91
3 89 92 89 77 92 92
4 92 101 104 97 96 104
5 81 92 94 76 95 95
6 92 110 92 98 99 110
7 81 86 73 80 82 86
8 83 75 77 80 74 83
9 99 90 92 98 102 102
10 90 85 86 86 92 92
11 95 105 93 84 86 105
12 80 95 97 85 81 97
Results
35
Table 12 - Individual blood glucose levels after the ingestion of a mousse with 3 g of cinnamon (mg/dl),
maximum concentration (Cmax) and respective means Subjects/Time
(min)
0 30 60 90 120 Cmax
13 88 113 86 84 87 113
14 91 91 99 108 90 108
15 92 99 89 98 94 99
16 76 101 77 70 80 101
17 95 96 102 87 98 102
18 76 97 89 80 91 97
19 94 93 82 96 82 96
20 95 115 85 89 92 115
21 82 109 106 103 90 109
22 90 97 83 83 82 97
23 101 103 92 99 101 103
24 102 103 105 113 105 113
Means (mg/dl) 90,17 101,41 91,25 92,5 91 104,42
It was also investigated whether there were significant differences in the mean values of fasting blood glucose between the two groups using an independent sample T-test, after verifying the data normal distribution and homogeneity. No differences were found (p>0,05).
The AUC of each subject is represented in Table 13 as well as the respective mean values:
Table 13 –Postprandial blood glucose area under the curves (AUCs) in healthy subjects after the
ingestion of a mousse without cinnamon or with 3 g of cinnamon.
Subject Mousse without cinnamon AUCs (mg.hr/l) Subject Mousse with cinnamon AUCs (mg.hr/l)
1 10440 13 11115
2 10260 14 11655
3 10455 15 11370
4 11880 16 9780
5 10500 17 11445
6 11865 18 10485
7 9615 19 10770
8 9315 20 11475
36
10 10440 22 10470
11 11175 23 11850
12 10725 24 12735
Means 10673,75± 797,9* 11272,50± 808,2*
*Values are shown as means ± SD
No significant differences were observed in terms of the mean AUCs, of each group, for postprandial blood glucose responses (p>0,05).
Discussion
37
4.
Discussion
This study revealed differences in the phenolic composition and antioxidant capacity of the two meals. The chemical analysis showed that the mousse with 3 g of cinnamon has a much higher phenolic content than the mousse without cinnamon.
Type-A procyanidins are compounds present in cinnamon that have an antioxidant effect and also seem to exhibit insulin-like activity in cells (Anderson et al, 2004; Cao et al, 2007; Cao et al, 2010). Therefore, quantification of proanthocyanidins present in the mousse with and without cinnamon was measured. The quantification of proanthocyanidins revealed that the mousse with cinnamon has a higher amount of proanthocyanidins than the mousse without cinnamon. These results are consistent with the study of Shan et al (2007), in which high levels of proanthocyanidins were also identified in C. burmannii.
These results are consistent with those found with the antioxidant capacity tests, in which the mousse with cinnamon revealed a higher antioxidant capacity than the mousse without cinnamon.
In the FRAP assay, the values ranged from 91,1 to 941,4 μmol TROLOX/l showing that the total antioxidant capacity of the mousse is ten times higher in the presence of cinnamon. The phenolic compounds present in cinnamon exhibit an antioxidant capacity, as observed by the range in the values of the FRAP assay, from 0,279 to 0,755 μmol TROLOX/mg phenols. Shan (2005), also found out that cinnamon stick contained very high levels of phenolic compounds (11.90 g of GAE/100 g of DW) and, in comparison with cinnamon cassia, this last one has a lower phenolic content (6,34 g of GAE/100 g of DW).
The ABTS•+ assay was used to estimate the total antioxidant capacity (TAS)
and total equivalent antioxidant capacity (TEAC) of the two meals. In the tested conditions, C.burmannii showed a 50% inhibitory concentration achieved with 11,8 dilutions, while the mousse without cinnamon has no antioxidant capacity to reduce the ABTS radical at 50%. These results are in accordance with the ones observed by Murcia
38
Despite the differences in the quantity of proanthocyanidins and the antioxidant capacity between the two meals, these differences don't seem to be enough to exhibit a lowering effect in the postprandial blood glucose values. This study showed that the ingestion of 3 g of cinnamon with a semi-solid food does not reduce the postprandial blood glucose response of healthy subjects. In fact, mean postprandial blood glucose levels tended to be higher after the ingestion of the test meal compared to the reference meal (see Table 8). Also, in terms of mean AUCs of each group, no significant differences were observed. These results are in accordance to a crossover study in nine healthy subjects (Markey et al, 2011), where the supplementation of 3 g of cinnamon simultaneously with a high-fat meal did not change the postprandial glycemic response. Another recent study in healthy subjects indicted that the addition of 3 g of cinnamon to a low-fat rice pudding test meal had no significant effect on gastric emptying (GE) rate neither in the blood glucose response in terms of the AUCs, between the different meals (Hlebowicz et al, 2009). As in this study, Hlebowicz et al (2009) also assessed if there were significant differences in the means Cmax between the two groups. Unlike Hlebowicz et al (2009), where no significant differences were observed between the mean values of Cmax, this study revealed the mean values of Cmax were significantly lower after the ingestion of the reference meal than after the ingestion of the mousse with 3 g of C.burmannii. These different results may be due to the fact that the sample in Hlebowicz et al (2009) study was a unique sample, in which the differences in postprandial blood glucose response to the ingestion of the different meals were analyzed in the same subjects, and C. cassia was used instead of C. burmannii.
When added to the same test meal, 6 g of cinnamon significantly delayed GE and reduced postprandial glycaemia, but the decrease in blood glucose concentration was more evident than the delay in GE rate, suggesting that GE cannot be the sole mechanism (Hlebowicz et al, 2007). Although the GE was not assessed in this study, there seems to be a relation between the amount of cinnamon consumed, the delay in gastric emptying and the reduction in postprandial blood glucose concentrations. Moreover, there are other factors that can influence the postprandial blood glucose levels, such as sample size, cinnamon specie and types of foods consumed.
Discussion
39
variable, they all were long term studies (Khan et al, 2003; Safdar, et al, 2004; Mang et al, 2006; Soni, 2009). Most of them observed a reduction in fasting blood glucose, and Soni (2009) also observed a reduction in postprandial blood glucose levels. Therefore, the different results observed in the different clinical trials may not only be due to the amount of cinnamon consumed but also due to the type of sample and the time of the study itself.
The results of this study may not be fully comparable to the results of other ones, since the fasting blood glucose levels may also fluctuate due to other conditions, such as the high variability of the experimental conditions including the carbohydrate content of the last meal and the energy expenditure between the last meal and the measurement. Several food factors, such as the components in food, may also be responsible for the differences in glucose and insulin responses (Björck, Granfeldt, Liljeberg, Tovar & Asp, 1994). Fat, for example, slows down the digestive process and the co-ingestion of lipids and proteins has been demonstrated to reduce the glycemic response to carbohydrates by delaying gastric emptying and stimulating insulin secretion (Nuttall and Gannon, 1991; Björck et al, 1994; Moghaddam et al, 2006). Also, taking in to account the glycemic index (GI) of foods, this may vary between apparently similar foods. This variation may be due to differences in the physical and chemical characteristics of the foods but also to methodological factors. Similar foods may have different ingredients or may have been processed with a different method, resulting in significant differences in the rate of carbohydrate digestion and therefore in the GI value. (Foster-Powell, Holt & Brand-Miller, 2002). Thus, both the ingredients and method of process of the reference meal and test meal should be guaranteed to be similar, in order to avoid variations in the GI of the two meals.
In this study, the only difference between the reference meal and the test meal was that this last one had the addition of 3 g of cinnamon. Adding cinnamon to the mousse had very limited impact on its alimentary composition, being this change mainly due to the increase in the meal kilocalorie (kcal), which primarily comes from carbohydrates (mono and disaccharide sugars).
40
and therefore, in the present study, the random allocation of participants in groups and the homogeneity between the groups can decrease the interference of individual factors in the results.
In terms of the anthropometric characteristics of the subjects, the homogeneity
between the two groups was guaranteed, since there weren’t significant differences in
the mean BMI, WHR, SMM, fat mass and waist line among the two groups.
With regard to differences in the means of alimentary intake on the day prior to the intervention between the two groups, these were evaluated but no significant differences were found. Also, it was evaluate if the alimentary composition of the last meal on the day prior to the intervention could influence the fasting glycemic values of each group and no significant evidence was found. Plus, significant differences in the mean time of overnight fast between the two groups were also evaluated. Despite the mean time of overnight fast in group B is slightly higher than the mean time of overnight fast in group A, no significant differences were found, ensuring homogeneity between the groups.
Family history of diabetes is consider a non-modifiable risk factor for Type 2 Diabetes and therefore, subjects with a family history of diabetes may have alterations in the glycemic profile (Alberti, Zimmet, Shaw, 2007). Although more than half the subjects that participated in this study had family history of diabetes, no differences in their distribution between the groups were identified, which guarantees the homogeneity.
Thereby, the results obtained in this study, in terms of blood glucose levels, were not affected by the individual factors described above.
This study has some limitations, such as the fact that the sample technique was by convenience, being a small sample composed mainly by young, healthy subjects, not allowing these results to be generalize to other populations. However, the random allocation of participants in the groups and the homogeneity between the control group and the experimental group was guaranteed in order to decrease bias.
Also, the database used to analyze the 24 hour dietary recall answered by the
Discussion
41
Although the homogeneity between the groups was guaranteed and the dietary composition of the reference meal and the test meal was almost similar, the addition of
γ g of cinnamon to the mousse didn’t reduce the postprandial blood glucose response of the subjects, but greatly increased the phenolic content of this meal.
Conclusion
43
5.
Conclusion
The phenolic and antioxidant analysis revealed that the mousse with 3 g of cinnamon has a much higher phenolic content and total antioxidant capacity than the mousse without cinnamon. However, these differences in the antioxidant capacity of the two meals don't seem to be enough to exhibit a lowering effect in the postprandial blood glucose values. This study showed that the ingestion of 3 g of cinnamon with a semi-solid food does not reduce the postprandial blood glucose response of healthy subjects.
Although the dose of 3 g of cinnamon seems to exhibit a significant reduction in the mean fasting glucose levels in type 2 diabetics, higher doses of cinnamon are apparently required to have an influence in postprandial blood glucose of healthy subjects. Nevertheless, due to its high proanthocyanidins content, C. burmannii could be a better choice, when compared to other cinnamon species.
References
45
6.
References
Alberti, K.G., Zimmet, P., Shaw, J. (β007) “International Diabetes Federation: a
consensus on Type β diabetes prevention.” Diabetic Medicine, 24 (5), pp. 451-463. doi: 10.1111/j.1464-5491.2007.02157.x
Anderson R., Broadhurst C., Polansky M., Schmidt W., Khan A., Flanagan V., Schoene N., Graves D. (2004) "Isolation and Characterization of Polyphenol Type-A Polymers from Cinnamon with Insulin-like Biological Activity." Journal of Agriculture and Food Chemistry, 52, pp. 65-70. doi:10.1021/jf034916b
Anderson., R. (2008) "Chromium and polyphenols from cinnamon improve insulin sensitivity." Proceedings of the Nutrition Society, 67, pp 48-53. doi: 10.1017/S0029665108006010
Björck, I., Granfeldt, Y., Liljeberg, H., Tovar, J., Asp, N. G. (1994) "Food properties affecting the digestion and absorption of carbohydrates." American Journal of Clinical Nutrition, 59 (3), pp. 699-705
Brand-Miller, J.C., Holt, S., Dorota, B., Pawlak, D.B., McMillan, J. (2002) "Glycemic index and obesity." American Journal of Clinical Nutrition, 76, pp. 281-285.
Cao H., Polansky M.M., Anderson, R.A. (2007) "Cinnamon extract and polyphenols affect the expression of tristetraprolin, insulin receptor, and glucose transporter 4 in mouse 3T3-L1 adipocytes." Archives of Biochemistry and Biophysics, 459(2), pp.
214-222. doi:10.1016/j.abb.2006.12.034
Cao H., Graves D., Anderson R. (2010) "Cinnamon extract regulates glucose transporter and insulin-signaling gene expression in mouse adipocytes." Phytomedicine, (17), pp. 1027-1032. doi: 10.1016/j.phymed.2010.03.023
46
American Board of Family Medicine, 22(5), pp. 507-512. doi:
10.3122/jabfm.2009.05.080093
Foster-Powell, K., Holt, S., Brand-Miller J.C. (2002) " International table of glycemic index and glycemic load values: 2002." The American Journal of Clinical Nutrition, 76,
pp. 5-56.
Gu, L., Kelm, M., Hammerstone, J.F., Beecher, G., Cunningham, D., Vannozzi, S., Prior, R.L. (2002) "Fractionation of Polymeric Procyanidins from Lowbush Blueberry and Quantification of Procyanidins in Selected Foods with an Optimized Normal-Phase
HPLC−MS Fluorescent Detection Method." Journal of Agricultural and Food Chemistry, 50(17), pp. 4852-4860. doi: 10.1021/jf020214v
Hardman, R. (2004) "Cinnamon and Cassia", 3rd Edition, pp. 1-269, CRC Press, Washington, D.C, USA.
He, Z.D., Qiao, C.F., Han, Q.B., Cheng, C.L, Xu, H.X., Jiang, R.W., … Shaw, P.C. (2005) "Authentication and Quantitative Analysis on the Chemical Profile of Cassia Bark (Cortex Cinnamomi) by High-Pressure Liquid Chromatography." Journal of Agriculture and Food Chemistry, 53(7), pp. 2424-2428. doi: 10.1021/jf048116s
Hlebowicz, J., Darwiche, G., Björgell, O., Almér, L.O. (2007) "Effect of cinnamon on postprandial blood glucose, gastric emptying, and satiety in healthy subjects." The American Journal of Clinical Nutrition, 85(6), pp. 1552-1556.
References
47
Imparl-Radosevich J, Polansky M.M., Baedke, D.A., Ingebritsen, T.S., Anderson, R.A., Graves, D.J, (1998) "Regulation of PTP-1 and Insulin Receptor Kinase by Fractions from Cinnamon: Implications for Cinnamon Regulation of Insulin Signalling."
Hormone Research, 50(3), pp. 177-182.
Jarvill-Taylor, Karalee, J., Anderson, R.A. Graves, D.J. (2001) "A Hydroxychalcone Derived from Cinnamon Functions as a Mimetic for Insulin in 3T3-L1 Adipocytes."
Journal of the American College of Nutrition, 20(4), pp. 327-336.
Karadag, A., Ozcelik, B., Saner, S. (2009) "Review of methods to determine antioxidant capacities." Food Analysis and Methods., 2, pp. 41-60. doi: 10.1007/s12161-008-9067-7
Khan, A., Mahpara, S., Mohammad M., Khan N.K., Richard A.A. (2003) "Cinnamon Improves Glucose and Lipids of People With Type 2 Diabetes." Diabetes Care, 26(12),
pp. 3215-3218. doi:
Magistrelli, A., Chezem, J.C. (2012) "Effect of Ground Cinnamon on Postprandial Blood Glucose Concentration in Normal-Weight and Obese Adults." Journal of the
Academy of Nutrition and Dietetics, 112(11), pp. 1806-1809. doi:
10.1016/j.jand.2012.07.037
Mang, B., Wolters, M., Schmitt, B., Kelb, K., Lichtinghagen, R., Stichtenoth, D. O., Hahn, A. (2006 ) "Effects of a cinnamon extract on plasma glucose, HbA, and serum lipids in diabetes mellitus type 2." European Journal of Clinical Investigation, 36(5),
pp. 340-344.
Markey, O., McClean, C., Medlow, P., Davison, G., Trinick, T., Duly, E., Shafat, A. (2011) "Effect of cinnamon on gastric emptying, arterial stiffness, postprandial lipemia, glycemia, and appetite responses to high-fat breakfast." Cardiovascular Diabetology,
10(1), pp. 78.
48
Plasma Insulin, and Dietary Fiber Intake." The Journal of Nutrition, 136 (10), pp.
2506-2511.
Murcia A., Egea I., Romojaro F., Parras P., Nez A., Martinez-Tomea M. (2004) "Antioxidant Evaluation in Dessert Spices Compared with Common Food Additives. Influence of Irradiation Procedure." Journal of Agriculture and Food Chemistry, 52, pp.
1872-1881. doi: 10.1021/jf0303114
Nuttall, F.Q., Gannon, M.C. (1991) "Plasma Glucose and Insulin Response to Macronutrients in Nondiabetic and NIDDM Subjects." Diabetes Care, 14 (9), pp.
824-838.
Porto, A., Oliveira L. (2006) “Tabela da Composição de Alimentos.” Instituto Nacional de Saúde Dr. Ricardo Jorge, Centro de Segurança Alimentar e Nutrição, Ministério da Saúde.
Roussel A., Hininger I., Benaraba R., Ziegenfuss T., Anderson R. (2009) "Antioxidant Effects of a Cinnamon Extract in People with Impaired Fasting Glucose That Are Overweight or Obese." Journal of the American College of Nutrition, 28(1), pp. 16-21.
Safdar M., Khan A., Muzaffar, M., Khattak, A.K., Siddique M. (2004) "Effect of Various Doses of Cinnamon on Blood Glucose in Diabetic Individuals." Pakistan Journal of Nutrition, 3(5), pp. 268-272.
Sangal, A. (2011) "Role of cinnamon as beneficial antidiabetic food adjunct: a review."
Advances in Applied Science Research, 2(4), pp. 440-450.
References
49
Shan B., Cai Y., Brooks J.D., Corke H. (2007) "Antibacterial Properties and Major Bioactive Components of Cinnamon Stick (Cinnamomum burmannii): Activity against Foodborne Pathogenic Bacteria." Journal of Agriculture and Food Chemistry, 55, pp.
5484-5490. doi: 10.1021/jf070424d
Solomon, T. P. J., Blannin, A.K. (2007) "Effects of short-term cinnamon ingestion on in vivo glucose tolerance." Diabetes, Obesity and Metabolism, 9(6), pp. 895-901. doi: 10.1111/j.1463-1326.2006.00694
Soni, R., Bhatnagar, V. (2009) "Effect of Cinnamon (Cinnamomum Cassia) intervention on Blood Glucose of Middle Aged Adult Male with Non Insulin Dependent Diabetes Mellitus (NIDDM)." Ethno-Med., 3(2), pp. 141-144.
Thaipong, K., Boonprakob, U., Crosby, K., Cisneros-Zevallos, L., Byrne, D. H. (2006) "Comparison of ABTS, DPPH, FRAP, and ORAC assays for estimating antioxidant activity from guava fruit extracts." Journal of food composition and analysis : an official publication of the United Nations University, International Network of Food
Data Systems, 19(6-7), pp. 669-675. doi:10.1016/j.jfca.2006.01.003
Thantsin, K., Qin, Zhang Q., Yang, J., Wang, Q. (2008) "Composition of semivolatile compounds of 10 Cinnamomum species from China and Myanmar." Natural Product Research, 22(7), pp. 576-583. doi: 10.1080/14786410701592802
Ulbricht C., Seamon E., Windsor R., Armbruester, N., Bryan, J.K., Costa, D., ... Zhang, J. (2011) "An Evidence-Based Systematic Review of Cinnamon (Cinnamomum spp.) by the Natural Standard Research Collaboration." Journal of Dietary Supplements, 8(4),
pp. 378-454.doi: 10.3109/19390211.2011.627783
50
Vasanthi H. R., Parameswari R.P. (2010) "Indian Spices for Healthy Heart - An Overview."Current Cardiology Reviews, 6 (4), pp. 274-279.
Woehrlin, F., Fry, H., Abraham, K., Preiss-Weigert, A. (2010) "Quantification of Flavoring Constituents in Cinnamon: High Variation of Coumarin in Cassia Bark from the German Retail Market and in Authentic Samples from Indonesia." Journal of Agricultural and Food Chemistry, 58 (19), pp. 10568–10575. doi: 10.1021/jf102112p
Ziegenfuss, T.N., Hofheins, J.E., Mendel, R.W., Landis, J., Anderson, R.A. (2006) "Effects of a Water-Soluble Cinnamon Extract on Body Composition and Features of the Metabolic Syndrome in Pre-Diabetic Men and Women." Journal of the International Society of Sports Nutrition, 3(2), pp. 45-53.
Zulueta, A., Esteve, M.J., Frígola, A. (2009) "ORAC and TEAC assays comparison to measure the antioxidant capacity of food products." Food Chemistry, 114(1), pp.
ANNEX
Annex A – Ethics Committee of Instituto Superior de Ciências da Saúde Egas
ANNEX
Annex B – Informed Consent
Consentimento Informado
Monte da Caparica, 11 de Dezembro de 2012
Exmo. (a) Sr.(a),
No âmbito do Curso de Mestrado em Nutrição Clínica do Instituto Superior de Ciências da
Saúde Egas Moniz, sob orientação da Professora Doutora Alexandra Bernardo, solicita-se
autorização para a participação no estudo “Efeito da ingestão de uma mousse com canela
burmannii sobre os valores médios de glicémia capilar pós-prandial e seu poder antioxidante“
a estudantes do Instituto Superior de Ciências da Saúde Egas Moniz, com o objectivo de
determinar se existe variação nos valores de glicémia capilar pós-prandial de indivíduos
adultos, após a ingestão de uma mousse com canela versus a ingestão de uma mousse sem
canela, assim como, caracterizar a capacidade antioxidante deste alimento com e sem
canela.
A participação neste estudo é voluntária e implica:
a) Preenchimento de questionário de história familiar de diabetes, de medicação que
efetua,o sexo e a idade;
b) Medição e pesagem em balança de bioimpedância para recolha de dados
antropométricos;
c) Medição do perímetro da cintura;
d) 10 picadas no dedo para recolher uma gota de sangue (medição da glicémia capilar).
Estas picadas serão efetuadas em momentos diferentes: 1 picada em jejum, antes da
ingestão de uma mousse com canela, e as restantes 30, 60, 90 e 120 minutos depois
do início da ingestão do alimento; este procedimento é repetido uma semana depois
apenas com a alteração da mousse que não terá canela;
e) Preenchimento de inquérito alimentar às 24 horas anteriores.
A informação recolhida nos questionários e os dados antropométricos recolhidos destinam-se
unicamente a tratamento estatístico e publicação e será tratada pelo orientador e pelos seus
mandatados. A sua recolha é anónima e confidencial (os dados dos participantes serão
registados com recurso a uma codificação).
A sua não participação não lhe trará qualquer prejuízo.
Este estudo pode trazer benefícios ao progresso do conhecimento, uma vez que a canela
burmannii é uma espécie ainda pouco estudada, sendo escassa a literatura publicada sobre o
seu poder antioxidante nos alimentos, bem como sobre o seu papel nos valores de glicémia
pós-prandial. A canela burmannii pode surgir, assim, como uma fonte de antioxidantes