HESSD
5, 257–287, 2008EFAS – Concept and development
J. Thielen et al.
Title Page
Abstract Introduction
Conclusions References
Tables Figures
◭ ◮
◭ ◮
Back Close
Full Screen / Esc
Printer-friendly Version
Interactive Discussion Hydrol. Earth Syst. Sci. Discuss., 5, 257–287, 2008
www.hydrol-earth-syst-sci-discuss.net/5/257/2008/ © Author(s) 2008. This work is distributed under the Creative Commons Attribution 3.0 License.
Hydrology and Earth System Sciences Discussions
Papers published inHydrology and Earth System Sciences Discussionsare under open-access review for the journalHydrology and Earth System Sciences
The European Flood Alert System –
Part 1: Concept and development
J. Thielen1, J. Bartholmes1, M.-H. Ramos1,2, and A. de Roo1
1
EC, DG Joint Research Centre, Institute for Environment and Sustainability, Ispra, Italy
2
CEMAGREF, Paris, France
Received: 14 December 2007 – Accepted: 14 December 2007 – Published: 6 February 2008 Correspondence to: J. Thielen ([email protected])
HESSD
5, 257–287, 2008EFAS – Concept and development
J. Thielen et al.
Title Page
Abstract Introduction
Conclusions References
Tables Figures
◭ ◮
◭ ◮
Back Close
Full Screen / Esc
Printer-friendly Version
Interactive Discussion
Abstract
This paper presents the development of the European Flood Alert System (EFAS), which aims at increasing preparedness for floods in trans-national European river basins by providing local water authorities with medium-range and probabilistic flood forecasting information 3 to 10 days in advance.
5
The EFAS research project started in 2003 with the development of a prototype at the European Commission Joint Research Centre (JRC), in close collaboration with the national hydrological and meteorological services. The prototype covers the whole of Europe on a 5 km grid. In parallel, different high-resolution data sets have been collected for the Elbe and Danube river basins, allowing the potential of the system 10
under optimum conditions and on a higher resolution, to be assessed.
Flood warning lead-times of 3–10 days are achieved through the incorporation of medium-range weather forecasts from the Deutscher Wetterdienst (DWD) and the Eu-ropean Centre for Medium-Range Weather Forecasts (ECMWF), comprising a full set of 51 probabilistic forecasts from the Ensemble Prediction System (EPS) provided by 15
ECMWF. The ensemble of different hydrographs is analysed and combined to produce early flood warning information, which is disseminated to the hydrological services that have agreed to participate in the development of the system.
In Part 1 of this paper, the scientific approach adopted in development of the system is presented. The rational of the project, the system’s set-up, its underlying compo-20
nents, basic principles, and products, are described. In Part 2, results of a detailed statistical analysis of the performance of the system are shown, with regard to both probabilistic and deterministic forecasts
1 Introduction
Over the last decades severe fluvial floods with a trans-national dimension have taken 25
HESSD
5, 257–287, 2008EFAS – Concept and development
J. Thielen et al.
Title Page
Abstract Introduction
Conclusions References
Tables Figures
◭ ◮
◭ ◮
Back Close
Full Screen / Esc
Printer-friendly Version
Interactive Discussion in 1997, and the Po floods in 1994 and 2000. Historic floods affected the Elbe and
the Danube river basins in 2002 (Br ´azdil et al., 2005; Yiou et al., 2006; Toothill, 2002). In 2005, widespread and repeated flooding was again observed in several tributaries to the Danube river basin, particularly in Switzerland and Austria (de Roo et al., 2006) and in the lower Danube countries (Romania and Bulgaria). Only one year later, record 5
floods hit again the Elbe and the Danube river basins in spring 2006 (ICPDR, 2006). The European Environmental Agency estimated that floods in Europe between 1998 and 2002 caused about 700 deaths, the displacement of about half a million people and at least 25 billion euros in insured economic losses (EEA, 2003). The repetitive occurrence of such disastrous floods prompted the investigation of new strategies for 10
flood prevention and protection, with focus on coordinated actions among countries sharing the same river basin.
Preventive measures such as the construction of reservoirs, polders, or dykes aimed at reducing the impact of the floods have high priority for the national water authorities (EU Water Directors, 2003). Although these measures may attenuate the impact of 15
floods, it is unlikely that floods can ever be totally prevented. Furthermore, within a changing climate, precipitation patterns are also likely to change (see, for example, Milly et al., 2002; Palmer and Raisanen, 2002; Lehner et al., 2006; Goubanova and Li, 2007, and references therein) and the preventive measures already in place may need to be revised and adapted to the new hydro-meteorological conditions.
20
When preventive measures are not sufficient, flood damage can still be reduced through raised preparedness. Unfortunately precipitation, in most cases the driving factor for floods, cannot be skilfully forecasted more than 2–3 days in advance. In a study based on forecasts from the European Centre for Medium-Range Weather Forecasts, Buizza et al. (1999) showed that although generally the skill in weather 25
HESSD
5, 257–287, 2008EFAS – Concept and development
J. Thielen et al.
Title Page
Abstract Introduction
Conclusions References
Tables Figures
◭ ◮
◭ ◮
Back Close
Full Screen / Esc
Printer-friendly Version
Interactive Discussion However, the lead-time for skilled precipitation forecasting can be extended by
ex-ploring ensemble prediction systems (EPS) (e.g. Tracton and Kalnay, 1993; Molteni et al., 1996). Although produced by some meteorological services as early as the 1980s (Molteni et al., 1996), it is only recently that EPS have been explored for flood fore-casting purposes. In Europe, the EFFS1project (2000–2003) was one of the first large 5
European research projects to look into the potential of using medium-range weather forecasts, including EPS, for flood forecasting in large trans-national river basins, with the aim of extending the early warning time (de Roo et al., 2003; Gouweleeuw et al., 2004).
In 2004, an international initiative called HEPEX2 was launched. HEPEX is an in-10
ternational effort that brings together meteorological and hydrological communities to develop advanced probabilistic hydrological forecasting techniques that use weather and climate ensemble forecasts (Hamill et al., 2005; Schaake et al., 2006; Schaake et al., 2007; Franz et al., 2005).
Recent research results from HEPEX are encouraging and demonstrate the potential 15
benefit of probabilistic weather forecasts over deterministic ones for flood forecasting in large river basins (Thielen et al., 2007). Roulin (2007) demonstrated that EPS-based flood forecasting can also be valuable for small river basins, while advances in limited area EPS modelling may provide even better quantitative precipitation estimates also for small basins, (Marsigli et al., 2001; Marsigli et al., 2005; Tibaldi et al., 2006)
20
The benefit of medium-range probabilistic flood forecasts for hydrological services lies first of all in the earlier knowledge that a possibility for a flood event exists. It can for example lead to:
discussion of different flood event scenarios, possible responses and actions; re-arrangement of working schedules to have sufficient people on stand-by; 25
enhanced monitoring of the meteorological and hydrological conditions over the com-ing days.
1
European Flood Forecasting System
2
HESSD
5, 257–287, 2008EFAS – Concept and development
J. Thielen et al.
Title Page
Abstract Introduction
Conclusions References
Tables Figures
◭ ◮
◭ ◮
Back Close
Full Screen / Esc
Printer-friendly Version
Interactive Discussion In case subsequent forecasts do not confirm the previous alert, forecasters can
re-turn to business-as-usual. Adverse effects from earlier warning are therefore minimal. In the opposite case, if a pre-alert is confirmed as the forecasted event approaches the forecast date, flood forecasters will be better prepared to initiate any necessary emergency procedure and there will be a gain in time when analysing the short-term – 5
and more precise – forecasts.
Earlier warning can therefore help in reducing the level of stress in the forecasting centres. Research has shown that the negative effects of stress on decision-making under time pressure and fatigue due to overwork in the operational centres during a flood event, should not be underestimated (Kowalski-Trakofler et al., 2003; Paton and 10
Flin, 1999).
In 2003 the European Commission started the development of a European Flood Alert System (EFAS), following the devastating Elbe and Danube floods in 2002. EFAS aims to simulate hydrological processes in trans-national river basins, and to provide harmonized flood information across Europe.
15
This paper is Part 1 of two articles describing the European Flood Alert System. Part 1 presents the concept of EFAS, its underlying structure, development and forecasting products. In Part 2 (Bartholmes et al., 2008) the performance of the pre-operational EFAS system is analysed for a two-year period.
2 General framework
20
An operational European Flood Alert system serves two objectives. The first is to complement Member States activities on flood preparedness and provide National hy-drological services with early flood information in addition to their own local and mostly short-range forecasting information. Such complementary data can, for instance, be catchment-based information beyond administrative boundaries, probabilistic flood in-25
Euro-HESSD
5, 257–287, 2008EFAS – Concept and development
J. Thielen et al.
Title Page
Abstract Introduction
Conclusions References
Tables Figures
◭ ◮
◭ ◮
Back Close
Full Screen / Esc
Printer-friendly Version
Interactive Discussion pean Commission with an overview of ongoing and expected floods in Europe. This
can be useful for crisis management in the case of large trans-national flood events that might need intervention on an international level.
The objective of providing added-value products to the Member States organizations was addressed first. Then, having demonstrated skills in making EFAS forecasts, the 5
second objective (see above) was addressed.
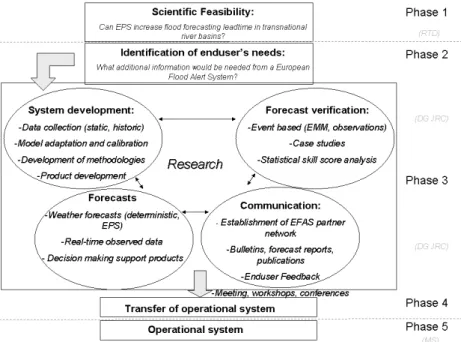
During the development stage EFAS focused on providing additional information to the national hydrological services. As illustrated in Fig. 1, this stage was divided into five phases: (1) assessment of scientific feasibility; (2) identification of operational end-user needs; (3) prototype development and research; (4) preparation for transfer of 10
operational system; (5) running of operational system. These phases are described in the next Sections.
3 Development of the European Flood Alert System
3.1 Phase 1: scientific feasibility study
The European Flood Forecasting System (EFFS, 1999–2003) was a research project 15
under the 5th Framework Programme of the European Commission with 19 partners from meteorological and hydrological services, research institutes and operational ser-vices (Kwadijk, 2003; de Roo, 2003; Gouweleeuw et al., 2004). Results show clearly that in the case of the Meuse flood in 1995 and the Po flood in 1994, EPS-based flood forecasts provided early warning of the order of 6–8 days (Bartholmes et al., 2005; 20
HESSD
5, 257–287, 2008EFAS – Concept and development
J. Thielen et al.
Title Page
Abstract Introduction
Conclusions References
Tables Figures
◭ ◮
◭ ◮
Back Close
Full Screen / Esc
Printer-friendly Version
Interactive Discussion 3.2 Phase 2: identification of Enduser needs
The needs of the National water authorities were assessed during a workshop with representatives from the hydrological services in the Elbe and Danube pilot river basins (Thielen et al., 2003). Questionnaires on flood forecasting were sent to the authorities prior to the workshop investigating their current practices and their needs. The survey 5
showed that EFAS could provide added value in the following areas:
Extension of lead-times. Typically, the achieved flood forecasting lead-times were 2–3 days, while the desired forecast lead times exceeded the existing ones by at least 1 day.
Interpretation of probabilistic weather and flood information. In 2003 all authorities 10
with access to EPS information used them qualitatively only. Using all EPS for flood forecasting, interpreting the results and presenting them in a concise and easy to un-derstand way was seen as a definite role for EFAS.
Catchment-based information. Flood forecasters noted that they would appreciate having an overview of the flood situation in upstream and neighbouring areas.
15
d) Sharing of information and data. Data infrastructure in Europe is particularly frag-mented in Europe, leading to diverse data access rights and a variety of formats and reference systems. EFAS was seen as a possibility to bridge gaps between the diff er-ent communities for improved information exchange on European level.
At this stage, it was agreed that the users’ needs would be continuously monitored 20
through feedback questionnaires and annual meetings.
3.3 Phase 3: prototype development
3.3.1 Data input and collection
Observed input data
Before starting the design and development of EFAS it was essential to establish 25
HESSD
5, 257–287, 2008EFAS – Concept and development
J. Thielen et al.
Title Page
Abstract Introduction
Conclusions References
Tables Figures
◭ ◮
◭ ◮
Back Close
Full Screen / Esc
Printer-friendly Version
Interactive Discussion and validating the hydrological model, and which real-time data would be available
for daily calculations of the initial flood conditions. Thematic layers describing soil, land use, topography and the river channel network are available at the European Commission Joint Research Centre (JRC).
The JRC also holds a meteorological database, hereafter referred to as JRC-MARS, 5
with data from 1975 onwards, which is updated daily. Through this database3 EFAS has access to meteorological observations from about 2000 stations across Europe, either as station data or interpolated onto 50×50 km grids (Table 1). The station den-sity varies greatly from country to country, which affects the quality of the model re-sults. Comparison of model results in the pilot basins based on high resolution data, 10
have shown that the spatial coverage and number of meteorological stations from JRC-MARS is only sufficient from 1995 onwards. Currently the data are collected, quality-checked and transformed into daily values for a 24-h period (06:00 a.m. to 06:00 a.m.) and provided to the JRC with a 1–2 days delay. Until these data can be collected in real-time, the 1–2 days gap between the availability of observed data and start of the 15
flood simulations is filled using the most recent meteorological forecast data.
Hydrological observations are currently available only as historic, not real-time, dis-charge time series. There is a higher spatial coverage for the pilot river basins Elbe and Danube since data collection has focused on these areas.
High density data collection for historic discharge, cross-sections and reservoir data 20
was initially concentrated on the pilot catchments Elbe and Danube. Depending on the river basin and the authority concerned, between 70% and 95% of the data could be collected. For the remaining river basins only historic discharge was collected through the databank of the Global Data RunoffCentre4, through direct contacts with the water authorities, or through public web-sites. In total data from about 800 stations are now 25
available for the time span 1990–2006 but not all stations have complete records for the full 16 years.
3
Seehttp://agrifish.jrc.it 4
HESSD
5, 257–287, 2008EFAS – Concept and development
J. Thielen et al.
Title Page
Abstract Introduction
Conclusions References
Tables Figures
◭ ◮
◭ ◮
Back Close
Full Screen / Esc
Printer-friendly Version
Interactive Discussion
Weather forecasting data
Weather forecasts are provided by the European Centre for Medium-Range Weather Forecasts (ECMWF, 10-day forecasts) and by the Deutsche Wetterdienst (DWD, 7-day forecasts). Temporal and spatial resolutions of the different data sets are listed in Table 1.
5
Abbreviations used in Table 1:P=total precipitation;T=temperature;E=evaporation;
E0=potential evaporation over water; ES0=potential evaporation over bare soil; and
ET0=potential evapotranspiration.
3.3.2 The hydrological model
The hydrological model used for EFAS is LISFLOOD. The model represents a hybrid 10
between a conceptual and a physical rainfall-runoff model combined with a routing module in the river channel. LISFLOOD has been specifically designed for large river catchments (de Roo, 1999; van der Knijffand de Roo, 2006). LISFLOOD simulates canopy and surface processes, soil and groundwater system processes and flow in the river channel, as briefly described below. For a detailed description of LISFLOOD, see 15
van der Knijffand de Roo (2006).
Canopy and surface: Snowmelt is simulated using a simple degree-day factor method, also accounting for accelerated snowmelt when it rains (WMO, 1986; Speers et al., 1979). For the simulation of fast sub-surface flow through macro-pores (prefer-ential flow), it is assumed that the fraction of the water on the soil surface contributing to 20
preferential flow is a non-linear function of the relative saturation of the topsoil, and that the importance of preferential flow increases as the topsoil gets wetter. For the remain-ing water that falls on the soil surface, infiltration and surface runoffare simulated using the Xinanjiang approach (Zhao & Liu, 1995; Todini, 1996). The moisture fluxes out of the top- and sub-soil are calculated assuming that the flow is entirely gravity-driven. 25
HESSD
5, 257–287, 2008EFAS – Concept and development
J. Thielen et al.
Title Page
Abstract Introduction
Conclusions References
Tables Figures
◭ ◮
◭ ◮
Back Close
Full Screen / Esc
Printer-friendly Version
Interactive Discussion including flow through macro-pores. The lower zone has a much slower response and
generates the base-flow.
River channel: Routing of water through the river channel can be simulated with the kinematic or the dynamic wave descriptions (Chow, 1988). Special structures such as water reservoirs and retention areas or polders can be simulated by giving their 5
location, size and in- and outflow boundary conditions.
For EFAS, LISFLOOD is set up on a 5-km grid, and a 1-km grid for the Elbe and Danube pilot catchments. The 5-km Pan-European set-up runs on a pre-operational basis twice a day, while the 1-km set-up is used for research only. The temporal resolu-tion used for the model simularesolu-tions is variable. The calcularesolu-tion of the initial condiresolu-tions is 10
performed on a daily time step, while the forecasts based on the deterministic weather forecasts are run with a 1-h time-step, and those based on EPS on a 24-h time-step.
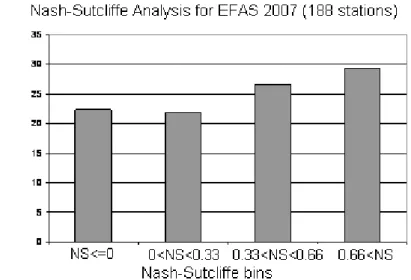
Until now EFAS has had to work with limited amount of hydrological data for cali-bration and validation, and entirely without information for reservoirs and lakes. Con-sequently the calibration of the LISFLOOD model in those river basins used for hy-15
dropower or irrigation, such as in Scandinavia or southern Europe, has been difficult. Figure 2 shows the distribution of the Nash-Sutcliffe coefficient for 188 selected sta-tions from different river basins across Europe and different upstream areas. The com-parison between observed and simulated hydrographs was done for the time period 1990–2006. More than half of the Nash-Sutcliffvalues are greater than 0.33, and 30% 20
are greater than 0.66.
There is, however, also a large number of stations where the model does not repro-duce well the observed hydrographs. Negative or low Nash-Sutcliffvalues are typically observed in heavily controlled rivers or stations with small upstream areas. This is not surprising for a system which is driven with comparatively little data and without in-25
real-HESSD
5, 257–287, 2008EFAS – Concept and development
J. Thielen et al.
Title Page
Abstract Introduction
Conclusions References
Tables Figures
◭ ◮
◭ ◮
Back Close
Full Screen / Esc
Printer-friendly Version
Interactive Discussion time meteorological and hydrological data necessary for flood forecasting. Those two
initiatives should enable EFAS to achieve better performance in the future.
Recent studies have been conducted on the analysis of model parameter uncer-tainty and its impact on discharges simulated by the LISFLOOD model (Feyen et al., 2007). The topic is part of ongoing research under the EFAS project and aims at con-5
tributing for a better knowledge of the prediction limits of the hydrologic model and the associated uncertainties.
3.3.3 Methodologies
Threshold exceedance:
Simulated hydrographs, per se, do not constitute a flood forecast. In order to make 10
a flood forecast a decision-making element needs to be incorporated: is the discharge going to exceed a critical threshold or not? For the development of the EFAS proto-type, the determination of the critical thresholds cannot be derived directly from obser-vations.
This is firstly because information on steering rules for lakes, reservoirs, polders or 15
any other measures are not yet available on European scale, and are unlikely to be available in sufficient detail in the future. Thus EFAS treats the river basins as quasi-natural. Furthermore, results have shown that the limited number of meteorological observations available for EFAS over Europe can lead to large discrepancies between model results and discharge observations, making quantitative comparison between 20
simulated discharges and observed thresholds problematic.
Secondly, EFAS uses the LISFLOOD model with a regular grid structure, and critical values should be determined at every model grid point. As observations these are, however, only available at selected gauging stations.
To tackle these limitations, a model consistent approach is proposed, as follows: 25
HESSD
5, 257–287, 2008EFAS – Concept and development
J. Thielen et al.
Title Page
Abstract Introduction
Conclusions References
Tables Figures
◭ ◮
◭ ◮
Back Close
Full Screen / Esc
Printer-friendly Version
Interactive Discussion
– At each grid, the discharges from this long-term time series are statistically evalu-ated to get threshold values. These critical values can be associevalu-ated with selected return periods or quantiles.
– Due to the relatively short time series for which reliable meteorological data are available (from 1995 onwards), large uncertainties can be expected in the estima-5
tion of discharges associated with return periods greater than 2–5 years.
– In EFAS, the approach used is based on quantiles. In practice, discharges are ranked from highest to lowest and cut-offvalues are chosen as thresholds. Cur-rently, the highest discharge obtained from a 14-year simulation defines the se-vere threshold level. The discharge value corresponding to the 99th percentile 10
(i.e., 99% of the simulated discharges are below this value) is chosen as the high threshold level. When comparing this threshold with statistics computed by national hydrologic services at some gauging stations, it was observed that this threshold corresponded repeatedly to return periods of 1 to 2 years.
The critical thresholds are coded by different colours, and associated with a hazard 15
description, as described in Table 2.
Taking into account critical thresholds for observed and simulated discharges, they are transformed into dichotomous time series of 1 (=Yes, the threshold is exceeded) and 0 (=No, the threshold is not exceeded).
The major advantage of this approach is that the relative difference of simulated 20
discharge to simulated thresholds, but not the actual values, are evaluated allowing the estimation of the severity of an event qualitatively. The disadvantage is that EFAS may produce reasonable results in terms of threshold exceedance while being seriously offset from the observed hydrographs. Such quantitative discrepancies need to be identified and reduced over time to ensure that the system remains credible.
25
HESSD
5, 257–287, 2008EFAS – Concept and development
J. Thielen et al.
Title Page
Abstract Introduction
Conclusions References
Tables Figures
◭ ◮
◭ ◮
Back Close
Full Screen / Esc
Printer-friendly Version
Interactive Discussion Therefore continuous comparison with observed data is vital for EFAS, and makes
fre-quent re-calibration of the system and production of long-term re-runs necessary. A very similar approach of combining distributed hydrologic modeling with threshold fre-quency (DHM-TF) has recently been successfully tested in the context of flash-flood forecasting for ungauged river basins (Reed et al., 2007).
5
Persistence:
EFAS is aimed at forecasting large fluvial floods caused mainly by widespread se-vere precipitation, combined rainfall with snow-melting or prolonged rainfalls of medium intensity. Large synoptic-scale weather phenomena that build up over several days are typically at the origin of these types of severe events. Numerical weather prediction 10
models should therefore pick up these systems not only once, but also in the subse-quent days of forecast as the event approaches.
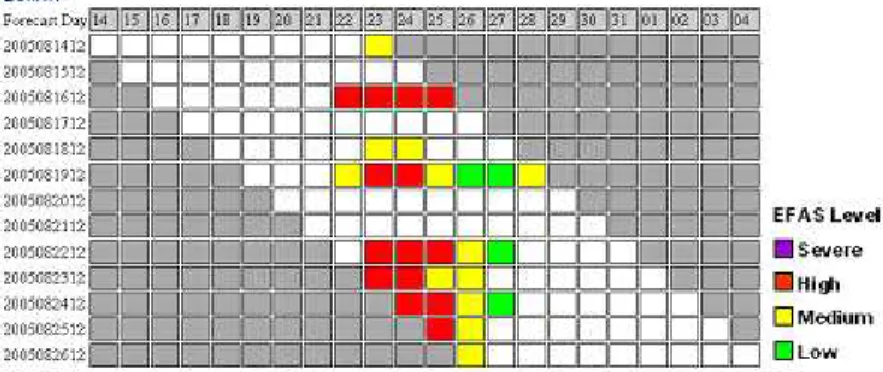
Therefore EFAS has introduced the principle of temporal “persistence” into its fore-casts: a pixel is flagged as “risk of flooding” only if the discharges in that river pixel exceed the EFAS high or EFAS severe flood threshold in three consecutive 12-hourly 15
forecasts. It has been shown that by introducing persistence, the forecast reliability increases (as discussed in detail in Part 2 of this paper: Bartholmes et al., 2008).
3.3.4 Visualisation products for ensemble flood forecasting
Since EFAS information is distributed to different authorities across Europe, it is impor-tant that the presentation of the forecast results is clear, and does not leave room for 20
misinterpretation. Additionally, the information must be concise, and based on as little text as possible, since English, the language adopted in EFAS reports, is not the native language of the majority of national forecasters.
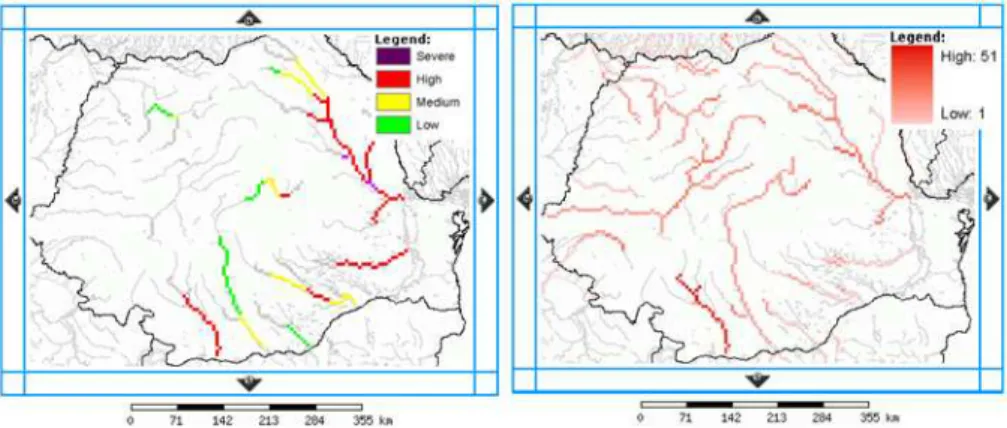
EFAS visualisation products focus on threshold exceedances. Overview maps show those river pixels where thresholds are exceeded (e.g. Fig. 3, left) or, in the case of 25
HESSD
5, 257–287, 2008EFAS – Concept and development
J. Thielen et al.
Title Page
Abstract Introduction
Conclusions References
Tables Figures
◭ ◮
◭ ◮
Back Close
Full Screen / Esc
Printer-friendly Version
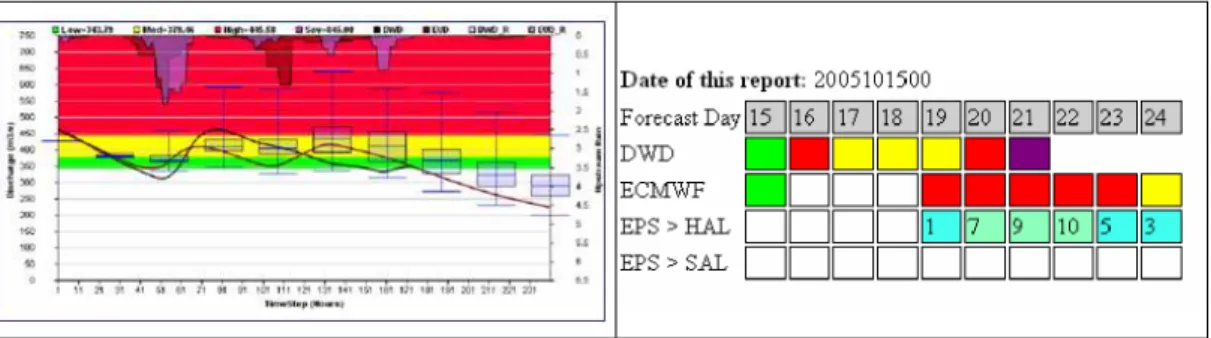
Interactive Discussion For the visualisation of time series of predicted discharges, the so-called spaghetti
plots, showing all possible scenarios forecasted, have not been found useful. Instead, the visualisation of pre-processed information such as statistical box-plot represen-tation (Fig. 4a) of quantiles, provides clearer and more concise interprerepresen-tation of the forecasted situation.
5
A representation entirely based on threshold exceedance and containing only the essential early warning information is being disseminated to national forecasting cen-tres (Fig. 4, right). In colour-coded boxes, only the highest alert threshold exceeded during a 24 h period is visualised for each deterministic forecast (DWD and ECMWF in Fig. 4). For the ensemble predictions, the number of EPS-based simulations exceeding 10
the EFAS high and the EFAS severe critical thresholds, is shown. In the latter case, both colour codes and numbers are given.
In this way, the quantification of uncertainty is intuitively represented (e.g. from Fig. 4, 10 out of 51 EPS reach the EFAS high alert level on the forecast applying to day 22) and, strictly speaking, not yet expressed as probabilities. In this way the information 15
can be easily summarised and communicated to the national hydrological services to help them in making decisions on flood warning (Ramos et al., 2007).
In Fig. 4 (left), the y-axis on the left shows discharge (m3/s), and on the right rainfall (mm). Alert thresholds are colour-coded and listed on the top. Upstream rainfall at the pixel is illustrated at the top for DWD (blue) and ECMWF (dark brown). Figure 4 20
(right) shows the forecast day (top row, grey), and EFAS threshold exceedances based on DWD and ECMWF forecasts (rows 2–3). The number of EPS-based forecasts exceeding the EFAS high alert (EPS>HAL) and the EFAS severe alert (EPS>SAL) are shown in the two bottom rows.
Another advantage of the simplified box representation (Fig. 4, right) is easy visual-25
HESSD
5, 257–287, 2008EFAS – Concept and development
J. Thielen et al.
Title Page
Abstract Introduction
Conclusions References
Tables Figures
◭ ◮
◭ ◮
Back Close
Full Screen / Esc
Printer-friendly Version
Interactive Discussion event did take place, on 21–24 August.
The forecasts based on ECMWF indicate a possibility of flooding for the first time on 16 August, but the signal became intermittent in the subsequent forecasts. The forecasts based on the EPS, however, indicate quite early on (already from 14 August) and with persistence that there is a chance of flooding in this river.
5
Persistence diagrams are one of the most frequently used representations the EFAS forecasters consider in their analyses of the forecasting situation. The have also been considered as very useful and informative by the users of EFAS forecasts at the na-tional forecasting centres.
3.4 Flood forecasts 10
From the outset it was decided that EFAS forecasts should run in real-time, in order to: (a) test the robustness of the system, and (b) enable decision-making in real-time without the “a priori” knowledge of what has happened. This is particularly important for decisions based on probabilistic information.
Since 2005, EFAS is running forecasts twice a day as soon as the weather fore-15
casts from ECMWF and DWD are received. In the case a potential flood situation is forecasted persistently, the EFAS team is put on internal alert. If the event satisfies certain criteria – e.g. if the event is forecasted in a trans-national river basin and more than 48 h in advance, if a receiving National Hydrological Partner exist, etc. – an EFAS information report is compiled and send to all EFAS partners affected in that river basin. 20
Despite the above criteria, the decision to send a report to the EFAS partners is largely subjective, and depends on the forecasting team’s judgement and expertise. Products such as persistence maps and combined flood threshold exceedance maps, described in earlier Sections, have been implemented to help the forecasters to make their decisions. More established rules that allow automatic flood alert procedure 25
HESSD
5, 257–287, 2008EFAS – Concept and development
J. Thielen et al.
Title Page
Abstract Introduction
Conclusions References
Tables Figures
◭ ◮
◭ ◮
Back Close
Full Screen / Esc
Printer-friendly Version
Interactive Discussion 3.5 Communication of EFAS results
A well established communication platform is crucial for a forecasting system operating on river basins shared by different autonomous administrations. The EFAS communi-cation platform is designed to disseminate results on different levels to EFAS partners and to the public.
5
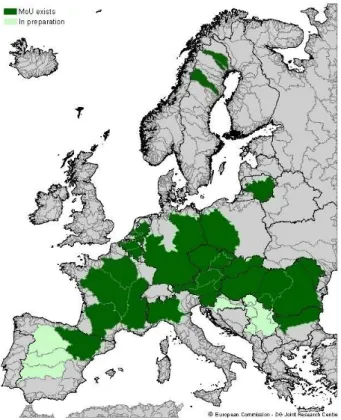
EFAS partners consist of experts from national hydrological and meteorological ser-vices that have agreed to join the EFAS network through the ratification of a Memo-randum of Understanding (MoU). MoU’s ensure that EFAS results are understood as preliminary research results by the forecasting experts and not as official warnings. Figure 6 shows the trans-national river basins for which at least one EFAS partner 10
organisation currently exists or an MoU is being drafted.
EFAS information reports follow a template that is discussed during the annual EFAS partner meeting. Each report contains a brief summary of the situation, exceedance maps and time series information. At the end of the reporting a feed-back questionnaire on the quality of the reporting and forecasts (hit or false alarm; timing; strength of 15
event) is sent to the authorities. Collected answers are then processed in the forecast verification framework (see Sect. 3.6).
Except for real-time flood forecasting reports, which are distributed only to EFAS partners, EFAS information is made public in the form of bulletins, scientific communi-cations, publications and reports, and are available athttp://efas.jrc.it.
20
Once a year a meeting with all partners is organised to update on the progress of the system, receive feedback and exchange information on flood forecasting. Feedback on EFAS results so far has been very positive5. Workshops on specific topics are organised to which either all or a selected number of partners are invited. The outcome of these workshops are summarised in reports and made available on the web to all 25
partners and the public. For example, a workshop on the use of ensemble prediction system in flood forecasting was organized on November 2005 (Demerritt et al., 2007; Thielen et al., 2005).
5
HESSD
5, 257–287, 2008EFAS – Concept and development
J. Thielen et al.
Title Page
Abstract Introduction
Conclusions References
Tables Figures
◭ ◮
◭ ◮
Back Close
Full Screen / Esc
Printer-friendly Version
Interactive Discussion 3.6 Forecast verification
EFAS results are verified on the basis of: (a) reported flood events (e.g. through part-ners or media); (b) in-depth case studies for specific events; (c) detailed skill score analysis of the performance of the model at the European level.
Flood events are monitored using the JRC’s Europe Media Monitoring (EMM) facility 5
(http://emm.jrc.it). Flood events that are reported are stored in a database. EFAS results are cross-checked against the EMM database. The analysis performed for 2005 and 2006 showed that for 80% of all events reported to partners, floods did happen. In the remaining 20% of floods forecasted by EFAS, the observed discharges were high but did not reach critical levels.
10
Case studies are typically looked at in more detail by making use of observations. The analysis of EFAS results for the historic summer 2005 floods in tributaries of the Danube river basin in Austria and Germany are reported by de Roo et al. (2006). A detail case study of the EFAS performance during the spring floods in 2006 in Slovakia, for the Morava River (tributary to the Danube), has been recently published by Kalas 15
et al. (2007).
A detailed statistical skill score analysis represents the core of EFAS forecast verifi-cation and is presented in Part 2 of this paper (Bartholmes et al., 2008).
3.7 Phases 4 and 5: transfer of operational system
Phase 4 consists of defining a stable configuration for the operational forecasting sys-20
tem and transferring it to a European organization, that will run and disseminate the forecasts to the partners in the Member States (in Phase 5). The current time-line envisages the transfer of the system before 2010.
HESSD
5, 257–287, 2008EFAS – Concept and development
J. Thielen et al.
Title Page
Abstract Introduction
Conclusions References
Tables Figures
◭ ◮
◭ ◮
Back Close
Full Screen / Esc
Printer-friendly Version
Interactive Discussion data collection systems were launched by the European Commission: ETN-R6 (in
2005) and EU-FLOOD-GIS (in 2006). These will be transferred with EFAS. ETN-RI collects real-time discharge data in all major European trans-national river basins. EU-FLOOD-GIS collects, harmonises, quality-controls and stores meteorological and hy-drological data (including ETN-R data).
5
4 Discussion and way forward
This paper has presented the development of a European Flood Alert System (EFAS). EFAS aims at providing early warning information for floods in Europe with a lead-time up to 10 days based on probabilistic weather information. The development of EFAS followed several stages, starting at a scientific feasibility study, followed by the 10
exploration of the needs of end-users, and finally the research and development of the system and its communication platform.
The first EFAS prototype has been running poperationally since 2005 and its re-sults have been analyzed in order to assess the average performance of the system in detecting potential flood events and its capabilities to complement Member States’ ac-15
tivities. The transfer from a research pre-operational tool to a fully operational system will be explored in the near future.
The core of EFAS consists of a grid-based distributed hydrological rainfall-runoff model with a routing component that is capable of simulating hydrological processes in large river basins. This model is fed with several medium-range weather forecasts 20
including full sets of Ensemble Prediction System (EPS). The multi-stream-flow output is analysed and visualised in concise and easy to understand products aimed at being complementary to information produced by local water authorities. A communication strategy and platform was developed which allows interactive exchange with different EFAS partners and national stakeholders, including, for example, meteorological data 25
6
HESSD
5, 257–287, 2008EFAS – Concept and development
J. Thielen et al.
Title Page
Abstract Introduction
Conclusions References
Tables Figures
◭ ◮
◭ ◮
Back Close
Full Screen / Esc
Printer-friendly Version
Interactive Discussion providers and national water authorities.
Another important component of the system is the stream-flow data collection and storage, a step needed to calibrate the hydrological model and to determine the initial conditions at the start of the flood forecasts.
Continuous verification of the model results is also an essential part of the system 5
and intense research efforts have been put into it. A detailed analysis of the skill of EFAS forecasts is described in Part 2 of this paper.
In the future the system will also incorporate ensembles with higher resolutions and longer leadtimes (see for example Tibaldi et al., 2006 and Buizza et al., 2007) and the change in performances tested for operational flood forecasting.
10
Once fully developed and tested, EFAS will not only provide early flood alert informa-tion to the nainforma-tional hydrological forecasting services, but it will also represent a power-ful tool for the European Commission and the Member States’ authorities for monitor-ing hydrological conditions across Europe, analysmonitor-ing climatology and trends over the past years based on a consistent and homogeneous platform, as well as for forecast-15
ing possible future trends when coupled with seasonal forecasts and climate change model outputs. Furthermore, because of the trans-boundary nature of the EFAS sim-ulations, it could be anticipated that exchange of flood forecasting experiences, data and research practices would be favoured within the platform.
Acknowledgements. The authors gratefully acknowledge the support of all staffof the JRC’s
20
Institute for Environment and Sustainability (IES) – Natural Hazards (NAHA) action, and the IT support of the institute’s Land Management Unit’s (LMU), in developing the system and enabling it to run seven days a week, including during holidays. Particular thanks are expressed to the authorities of those countries that provided detached national experts to the JRC for the development of the EFAS prototype (i.e. Austria, Czech Republic, Germany, Hungary and
25
Slovakia). The authors also wish to thank the Deutsche Wetterdienst and the European Centre for Medium-Range Weather Forecasts, and the JRC’s Institute for Protection and Security of the Citizen (IPSC) for data and information. Finally all EFAS partner organizations must be thanked for their interest, active support and feed-back without which the development of the system would not have been successful. F. Pappenberger and N. McCormick are thanked
HESSD
5, 257–287, 2008EFAS – Concept and development
J. Thielen et al.
Title Page
Abstract Introduction
Conclusions References
Tables Figures
◭ ◮
◭ ◮
Back Close
Full Screen / Esc
Printer-friendly Version
Interactive Discussion
for the review of this manuscript. For their financial support the authors thank the European Parliament, DG Environment and DG Enterprise.
References
Bartholmes, J. and Todini, E.: Coupling of meteorological and hydrological mdoels for flood forecasting, Hydrol. Earth Syst. Sci., 9(4), 333–346, 2005.
5
Bartholmes, J. C., Thielen, J., Ramos, M. H., and Gentilini, S.: The European Flood Alert Sys-tem EFAS – Part 2: Statistical skill assessment of probabilistic and deterministic operational forecasts, Hydrol. Earth Syst. Sci. Discuss., 5, 289–322, 2008,
http://www.hydrol-earth-syst-sci-discuss.net/5/289/2008/.
Br ´azdil, R., Pfister, C., Wanner, H., von Storch, H., and Luterbacher, J.: Historical climatology
10
in Europe – The state of the art, Climatic Change, 70, 363–430, 2005.
Buizza, R., Bidlot, J.-R., Wedi, N., Fuentes, M., Hamrud, M., Holt, G., and Vitart, F.: The new ECMWF VAREPS, Q. J. Roy. Meteor. Soc., 133, 681–695, 2007.
Buizza R., Hollingsworth, A., Lalaurette, F., and Ghelli, A.: Probabilistic Predictions of Precip-itation Using the ECMWF Ensemble Prediction System, Weather Forecast., 14, 168–189,
15
1999.
De Roo, A., Gouweleeuw, B., Thielen, J., Bates, P., Hollingsworth, A., et al.: Development of a European Flood Forecasting System, I. R. B. M., 1(1), 49–59, 2003.
De Roo, A.: LISFLOOD: a rainfall-runoffmodel for large river basins to assess the influence of land use changes on flood risk, in: Ribamod: river basin modelling, management and flood
20
mitigation, edited by: Balabanis, P., Bronstert, A., Casale, R., and Samuels, P., Concerted action, European Commission, EUR 18287 EN, 349–357, 1999.
De Roo, A., Ramos, M. H., Thielen, J., Franchello, G., Bartholmes, J., Wachter, K., Niemeyer, S., Kalas, M., Laguardia, G., and van der Kniff, J.: The Alpine floods of August 2005. What did EFAS forecast, what was observed, which feedback was received from end-users?, EFAS
25
Post-event summary report, European Commission, EUR 22154 EN, p. 94, 2006.
Demeritt, D., Cloke, H., Pappenberger, F., Thielen, J., Bartholmes, J., and Ramos, M.-H.: En-semble Prediction and perception of risk, uncertainty and error in flood forecasting, Env. Haz., 7, 115–127, 2007.
EEA, European Environment Agency: Mapping the impacts of recent natural disasters and
HESSD
5, 257–287, 2008EFAS – Concept and development
J. Thielen et al.
Title Page
Abstract Introduction
Conclusions References
Tables Figures
◭ ◮
◭ ◮
Back Close
Full Screen / Esc
Printer-friendly Version
Interactive Discussion
technological accidents in Europe, Environmental issue report No. 35, published by Euro-pean Environment Agency, Copenhagen, p. 47, 2003.
Feyen, L., Vrugt, J. A., ´O Nuall ´ainc, B., van der Knijff, J., and De Roo, A.: Parameter optimisa-tion and uncertainty assessment for large-scale streamflow simulaoptimisa-tion with the LISFLOOD model, J. Hydrol., 332(3–4), 276–289, 2007.
5
Franz, K., Ajami, N., Schaake, J., and Buizza, R.: Hydrologic Ensemble Prediction Experiment Focuses on Reliable Forecasts, Eos, 86(25), p. 239, 2005.
Goubanova, K. and Li, L.: Extremes in temperature and precipitation around the Mediterranean basin in an ensemble of future climate scenarios simulations, Gobal Planet. Change, 57, 27– 42, 2007.
10
Gouweleeuw, B., Reggiani, P., and De Roo, A. (Eds.): A European Flood Forecasting System EFFS, Full Report, European Report EUR 21208, EC DG JRC & WL Delft Hydraulics, p. 304, 2004
Gouweleeuw, B., Thielen, J., Franchello, G., De Roo, A., Buizza, R.: Flood forecasting us-ing medium-range probabilistic weather prediction. Hydrol. Earth Syst. Sci., 9(4), 365–380,
15
2005
Hamill, T., Clark, M., Schaake, J., and Buizza, R: 2nd HEPEX Workshop Summary Report, Boulder, Colorado (http://hydis8.eng.uci.edu/hepex/scndwksp/HEPEX05-Summary.
pdf), 2005.
ICPDR International Commission for the Protection of the Danube River Basin: Flooding fears
20
return to the Danube, In Danube Watch, 2, 14–15, 2006.
Kalas, M., Ramos, M.-H., Thielen, J., and Babiakova, G.: Evaluation of the medium-range European flood forecasts for the March–April 2006 flood in the Morava River, J. Hydrol. Hydromech., in press, 2008.
Kowalski-Trakofler, K. M., Vaught, C., and Scharf, T.: Judgement and decision making under
25
stress: an overview for emergency managers, Int. J. Emerg. Manag., 1(3), 278–289, 2003. Kwadijk, J.: EFFS – European Flood Forecasting System, Final report of Contract
EVG1-CT-1999-00011 (http://effs.wldelft.nl), 2003.
Lehner, B., Doll, P., Alcamo, J., Henrichs, T., and Kaspar, F. Estimating the impact of global change on flood and drought risks in Europe: a continental, integrated analysis, Climatic
30
Change, 75, 273–299, 2006
HESSD
5, 257–287, 2008EFAS – Concept and development
J. Thielen et al.
Title Page
Abstract Introduction
Conclusions References
Tables Figures
◭ ◮
◭ ◮
Back Close
Full Screen / Esc
Printer-friendly Version
Interactive Discussion
flood events, Q. J. R. Meteor. Soc., 127, 2095–2115, 2001.
Marsigli, C., Boccanera, F., Montani, A., and Paccagnella, T.: The COSMO-LEPS mesoscale ensemble system: validation of the methodology and verification,. Nonlin. Processes Geo-phys., 12, 527–536, 2005,
http://www.nonlin-processes-geophys.net/12/527/2005/.
5
Milly, P. C. D., Wetherald, R. T., Dunne, K. A., and Delworth, T. L.: Increasing risk of great floods in a changing clime, Nature, 415, 514–517, 2002.
Molteni, F., Buizza, R., Palmer, T. N., and Petroliagis, T.: The ECMWF ensemble prediction system: methodology and validation, Q. J. R. Meteor. Soc., 122, 73–119, 1996
Palmer, T. N. and Raisanen, J.: Quantifying the risk of extreme seasonal precipitation events in
10
a changing climate, Nature, 415, 512–514, 2002
Paton, D. and Flin, R.: Disaster Stress: an emergency management perspective, Disaster Prevention and Management, 8(4), 261–267, 1999.
Reed, S., Schaake, J., and Zhang, Z.: A distributed hydrologic model and threshold frequency-based method for flash flood forecasting at ungauged locations, J. Hydrology, 337, 402–420,
15
2007.
Ramos, M. H., Bartholmes, J., and Thielen-del Pozo, J.: Development of decision support products based on ensemble weather forecasts in the European Flood Alert System, A. S. L., 8, 113–119, 2007.
Roulin, E.: Skill and relative economic value of medium-range hydrological ensemble
predic-20
tions, Hydrol. Earth Syst. Sci., 11, 725–737, 2007,
http://www.hydrol-earth-syst-sci.net/11/725/2007/.
Schaake, J., Franz, K., Bradley, A., and Buizza, R.: The Hydrologic Ensemble Prediction Ex-periment (HEPEX), Hydrol. Earth Syst. Sci. Discuss., 3, 3321–3332, 2006,
http://www.hydrol-earth-syst-sci-discuss.net/3/3321/2006/.
25
Schaake, J. C., Hamill, T. M., Buizza, R., and Clark, M.: HEPEX, the Hydrological Ensemble Prediction Experiment, B. Am. Meteorol. Soc., 88, 1541–1547, 2007.
Tibaldi, S., Paccagnella, T., Marsigli, C., Montani, A., and Nerozzi, F.: Limited-Area Ensem-ble Forecasting: the COSMO-LEPS System, Predictabilty of Weather and Climate, CAM-BRIDGE University Press, 2006.
30
Thielen, J., De Roo, A., and Schmuck, G.: First LISFLOOD ALERT workshop – practical ben-efit from European research, http://efas.jrc.it/workshop2003/reports/Summary-Report-1st
HESSD
5, 257–287, 2008EFAS – Concept and development
J. Thielen et al.
Title Page
Abstract Introduction
Conclusions References
Tables Figures
◭ ◮
◭ ◮
Back Close
Full Screen / Esc
Printer-friendly Version
Interactive Discussion
Thielen, J., Ramos, M. H., Bartholmes, J., De Roo, A., Cloke, H., Pappenberger, F., and De-meritt, D.: Summary report of the 1st EFAS workshop on the use of Ensemble Prediction System in flood forecasting, 21–22 November 2005, Ispra, European Commission, Report, EUR 22118 EN (http://efas.jrc.it/workshop2005/index.html), p. 23, 2005.
Thielen, J., Bartholmes, J., Ramos, M.-H., Kalas, M., van der Knijff, J., and De Roo, A.: Added
5
value of ensemble prediction system products for medium-range flood forecasting on Euro-pean scale, in: Proceedings of the workshop “Ensemble Predictions and Uncertainties in Flood Forecasting”, International Commission for the Hydrology of the Rhine Basin (CHR), Bern Switzerland, 30–31 March 2006, 77–82, 2006.
Thielen, J., Bartholmes, J., and Schaake, J. (Eds.): 3rd HEPEX workshop, Book of Abstracts,
10
European Commission, Report, EUR22861 EN, http://hydis8.eng.uci.edu/hepex/thrdwksp/
thrdwksp.html, 2007.
Toothill, J.: Central European Flooding August 2002, Technical Report EQECAT, ABS Consult-ing, 2002, 21, 2002.
Van Der Knijff, J. and De Roo, A.: LISFLOOD – distributed water balance and flood simulation
15
model, User manual (version December 2005), European Commission, EN22166, p. 80, 2006.
HESSD
5, 257–287, 2008EFAS – Concept and development
J. Thielen et al.
Title Page
Abstract Introduction
Conclusions References
Tables Figures
◭ ◮
◭ ◮
Back Close
Full Screen / Esc
Printer-friendly Version
Interactive Discussion Table 1.EFAS input data in the period 2005/2006 whereP stands for precipitation,T for mean
daily temperature andE0for potential evaporation over bare soil,E T0potential evapotranspira-tion andE S0potential evaporation over vegetated surfaces.
DWD ECMWF – ECMWF – Observed deterministic EPS meteorological
data (JRC MARS) Temporal Staggered, Staggered, 6 h (1–10 days) Daily
resolution 1 h (1–3 days), 3 h (1–3 days), 3 h (4–7 days) 6 h (4–10 days)
Spatial Staggered, TL511L60 TL255L40 Gridded, resolution 7 km (1–3 days) (∼40 km) (∼80 km)∗ 50×50 km
& 40 km
Times 12:00; 12:00; 12:00; Irregular,
provided 00:00 00:00 00:00 typically at 23:00 Input fields 1 (P,T,E) 1 (P,T,E) 50+1 (P,T,E) P,T,E0,E S0,E T0
Bias None None None None removal
HESSD
5, 257–287, 2008EFAS – Concept and development
J. Thielen et al.
Title Page
Abstract Introduction
Conclusions References
Tables Figures
◭ ◮
◭ ◮
Back Close
Full Screen / Esc
Printer-friendly Version
Interactive Discussion Table 2.EFAS thresholds, their colour code and associated hazard class.
EFAS Colour Description threshold
S (Severe) Very high possibility of flooding, potentially severe flooding expected. H (High) High possibility of flooding, bank-full conditions or higher expected. M (Medium) Water levels high but no flooding expected.
HESSD
5, 257–287, 2008EFAS – Concept and development
J. Thielen et al.
Title Page
Abstract Introduction
Conclusions References
Tables Figures
◭ ◮
◭ ◮
Back Close
Full Screen / Esc
Printer-friendly Version
HESSD
5, 257–287, 2008EFAS – Concept and development
J. Thielen et al.
Title Page
Abstract Introduction
Conclusions References
Tables Figures
◭ ◮
◭ ◮
Back Close
Full Screen / Esc
Printer-friendly Version
Interactive Discussion Fig. 2.Distribution of Nash-Sutcliffe coefficients calculated from 188 stations located at different
HESSD
5, 257–287, 2008EFAS – Concept and development
J. Thielen et al.
Title Page
Abstract Introduction
Conclusions References
Tables Figures
◭ ◮
◭ ◮
Back Close
Full Screen / Esc
Printer-friendly Version
Interactive Discussion Fig. 3.Example of an EFAS threshold exceedance map based on deterministic forecasts (left)
HESSD
5, 257–287, 2008EFAS – Concept and development
J. Thielen et al.
Title Page
Abstract Introduction
Conclusions References
Tables Figures
◭ ◮
◭ ◮
Back Close
Full Screen / Esc
Printer-friendly Version
Interactive Discussion Fig. 4.Left: hydrographs based on DWD (black) and ECMWF (brown) deterministic forecasts,
HESSD
5, 257–287, 2008EFAS – Concept and development
J. Thielen et al.
Title Page
Abstract Introduction
Conclusions References
Tables Figures
◭ ◮
◭ ◮
Back Close
Full Screen / Esc
Printer-friendly Version
Interactive Discussion Fig. 5. Persistence of EFAS threshold exceedances based on ECMWF deterministic (top)
HESSD
5, 257–287, 2008EFAS – Concept and development
J. Thielen et al.
Title Page
Abstract Introduction
Conclusions References
Tables Figures
◭ ◮
◭ ◮
Back Close
Full Screen / Esc
Printer-friendly Version
Interactive Discussion
1