Nanoscale Imaging of Caveolin-1 Membrane
Domains
In Vivo
Kristin A. Gabor1,2,3¤a, Dahan Kim1¤b, Carol H. Kim2,3*, Samuel T. Hess1,3*
1Department of Physics and Astronomy, University of Maine, Orono, Maine, United States of America, 2Graduate School of Biomedical Sciences, University of Maine, Orono, Maine, United States of America, 3Department of Molecular and Biomedical Sciences, University of Maine, Orono, Maine, United States of America
¤a Current address: Immunity, Inflammation and Disease Laboratory, National Institutes of Environmental Health Sciences, Research Triangle Park, North Carolina, United States of America
¤b Current address: Department of Physics, University of Wisconsin-Madison, Madison, Wisconsin, United States of America
*carolkim@maine.edu(CHK);sam.hess@umit.maine.edu(STH)
Abstract
Light microscopy enables noninvasive imaging of fluorescent species in biological speci-mens, but resolution is generally limited by diffraction to ~200–250 nm. Many biological
pro-cesses occur on smaller length scales, highlighting the importance of techniques that can image below the diffraction limit and provide valuable single-molecule information. In recent years, imaging techniques have been developed which can achieve resolution below the diffraction limit. Utilizing one such technique, fluorescence photoactivation localization mi-croscopy (FPALM), we demonstrated its ability to construct super-resolution images from single molecules in a living zebrafish embryo, expanding the realm of previous super-reso-lution imaging to a living vertebrate organism. We imaged caveolin-1in vivo, in living zebra-fish embryos. Our results demonstrate the successful image acquisition of super-resolution images in a living vertebrate organism, opening several opportunities to answer more dynamic biological questionsin vivoat the previously inaccessible nanoscale.
Introduction
Many crucial biological processes occur on length scales that are inaccessible to conventional light microscopy techniques. This highlights the importance of techniques that can image at high resolution and provide valuable nanoscale information from single molecules. Conven-tional fluorescence microscopy with labeling techniques has brought revolutionary advances in our understanding of protein distributions and functions in the past two decades, albeit at dif-fraction-limited resolutions. The technique described herein,in vivoFPALM, enables construc-tion of super-resoluconstruc-tion images from localizaconstruc-tions of individual molecules in a living zebrafish. Such studies are likely to lead to a plethora of opportunities for studies relating to dynamic biological processes such as the pathogenesis of various diseases, the immune response to path-ogen invasion of the host and real-time movements and interactions of proteins of interest.
OPEN ACCESS
Citation:Gabor KA, Kim D, Kim CH, Hess ST (2015) Nanoscale Imaging of Caveolin-1 Membrane DomainsIn Vivo. PLoS ONE 10(2): e0117225. doi:10.1371/journal.pone.0117225
Academic Editor:David Holowka, Cornell University, UNITED STATES
Received:February 13, 2014
Accepted:December 20, 2014
Published:February 3, 2015
Copyright:© 2015 Gabor et al. This is an open access article distributed under the terms of the Creative Commons Attribution License, which permits unrestricted use, distribution, and reproduction in any medium, provided the original author and source are credited.
In recent years, techniques have been developed which can achieve super-resolution using localization of large numbers of optically resolvable single molecules [1–3] or stimulated emis-sion depletion [4], achieving effective resolutions in the range of 20–30 nm. Localization-based super-resolution microscopy methods have been shown to image living cells [5], three-dimen-sional specimens [6,7], and multiple fluorescent species [8–10]. These methods, however, do not provide super-resolution single molecule information in a living organism. Here, fluores-cence photoactivation localization microscopy (FPALM) imaging in a living zebrafish embryo is demonstrated using widefield illumination, enabling imaging of single molecules in a thick sample with an effective resolution of ~ 45 nm.
Previous super-resolution microscopy studies utilizing living species [5,11–13] have not been performed in a living vertebrate organism. Despite the invaluable information thatin vitro studies can offer, the molecular membrane organization observed in such systems may not fully reflect intact processes that occur in functioning and interacting tissues of a living organism. Studying the dynamics of individual Cav-1a molecules in a living zebrafish embryo can elucidate processes that take place at caveolae during the course of embryonic development. Cav-1a was selected based on its distinct size, morphology, and estimated number of molecules in a given caveolae. Previousin vitrostudies using zebrafish cells revealed that Cav-1 was critical for antivi-ral signaling because when Cav-1 was depleted, clusters of Cav-1 molecules were dispersed, re-sulting in an abrogated immune response to virus infection [14]. These studies helped inspire the development of this technique forin vivoimaging. Using FPALM, we imaged Dendra2 [15,16] genetically fused to the zebrafish Caveolin-1a (Cav-1a) membrane protein, which has been shown to serve as the primary protein responsible for the formation of caveolae membrane do-mains [17,18]. An FPALM setup with widefield illumination was used to visualize individual molecules in cells of living zebrafish embryos. Our results demonstrate the presence of caveolae membrane domains in a living organism, consistent with previous studies that we have per-formed using zebrafish cells [14]. Applications ofin vivoFPALM techniques provide opportuni-ties to ask and answer a multitude of questions in a living organism at diffraction-unlimited nanoscales. In these studies, we used an exposure time of ~3 ms per frame and achieved a locali-zation precision of ~ 40 nm and density of ~9500 molecules/μm2with a total of 10–15 seconds of acquisition time per rendered image (3000–5000 frames per image).
To perform measurements in a physiologically relevant system, we have extended FPALM to the level of a living vertebrate organism. Such studies enable validation of previous findings in anin vivomodel system. The zebrafish,Danio rerio, was used as a model organism for this study. Zebrafish embryos are an ideal model organism forin vivomicroscopy studies due to their optical clarity, size, and amenability to genetic manipulation. For instance, zebrafish have been used for real-time imaging of GFP-labeled cells, or fluorescently labeled proteins or path-ogens being expressed in a living embryo. In addition, use of the zebrafishcaspermutant [19] which was genetically modified to be transparent for the lifetime of the fish, afforded low back-ground levels in the present study. Using the zebrafish, we demonstrate that it is possible to perform FPALM in a living vertebrate by imaging cav1a-dendra2in vivoin living zebrafish em-bryos. Our results demonstrate the successful image acquisition of super-resolution images in a living vertebrate organism and present new opportunities to answer more dynamic biological questions in functioning tissues of a living organism.
Materials and Methods
Ethics Statement
Zebrafish used in this study were handled in accordance with the recommendations in the Guide for the Care and Use of Laboratory Animals of the National Institutes of Health. The and analysis, decision to publish, or preparation of
the manuscript.
protocol was approved by the Institutional Animal Care and Use Committee (IACUC) at the University of Maine. IACUC approved guidelines for zebrafish care followed the standard procedures (www.zfin.org) of a 14 h light, 10 h dark cycle at 28°C.
Zebrafish Care and Maintenance
Zebrafish were maintained in the Zebrafish Facility at the University of Maine, Orono. The facility was maintained according to IACUC standards. Embryos were obtained by natural crosses. Fertilized eggs were collected and raised in egg water (60μg/mL Instant Ocean sea salts (Aquarium Systems, Mentor, OH)) at 28°C. The zebrafish used for these studies were either wild-type AB orcasper fmsembryos [19], which is a mutant line in which the embryos display no pigmentation. Studies were also performed in age-matched wild-type embryos and similar results were achieved.
Microinjection of DNA into Zebrafish
Cav1a-HL4-dendra2 DNA was linearized by restriction enzyme digestion. The resulting DNA was purified using the PCR Purification Kit (Qiagen, Venlo, Netherlands) and quantitated by Nanodrop spectroscopy. Purified DNA (100 pg/embryo) was microinjected into the cell of zeb-rafish embryos at the one-cell stage. For some experiments DNA was co-injected with morpho-lino oligonucleotide (MO) targeted against Cav-1a as previously described [14]. Microinjection was controlled by a MPPI-2 pressure microinjector (Applied Scientific Instruments) and pulled microcapillary pipettes (Sutter Instruments, Novato, CA) to inject the plasmid. Injected embry-os were then allowed to develop in egg water at 28°C. Prior to imaging, embryembry-os were manually dechorionated.
Super Resolution Imaging with FPALM
placed at the sample. The camera was controlled using Solis software (Andor). Images were acquired using LabVIEWsoftware (National Instruments Corporation, Austin, TX). Note that while at present there is no field-specific standard, the super-resolution microscopy data obtained here (including rendered images and localized molecular coordinates), will be made available upon request.
FPALM Analysis.FPALM analysis was performed as previously described, using custom
software written in MATLAB (Mathworks, Inc. Natick, MA). Raw frames (1000–5000 frames) were background subtracted using the rolling ball method [21] prior to the standard localiza-tion routine. Positive intensity peaks with at least one pixel above a minimum threshold were fitted to a two-dimensional Gaussian to determine the x and y coordinate, amplitude, 1/e2 radi-us, and offset of each point spread function (PSF). During the localization procedure, one of two positive intensity peaks within 621 nm (corresponding to 4.5 pixels) of each other was dis-carded to ensure localization of only one PSF in the diffraction-limited region. Further, when localizations occur within 300 nm in two or more consecutive frames, only one of the localiza-tion was retained in order to prevent multiple counting of the same PSF.
Clusters were identified as described previously [22] using a single-linkage cluster analysis. Briefly, clusters were determined based on molecular positions identified during the localiza-tion analysis. The posilocaliza-tions of molecules that were within a maximum distance of 30 nm were defined as being within the same cluster. All molecules within 30 nm of a given molecule were identified using an iterative approach and then new molecules were added for neighbors within 30 nm. This process was repeated until all members of a given cluster were obtained. The num-ber of molecules per unit area (density) was determined based on the coordinates of molecules determined to lie within the same cluster. The density of clusters was calculated as the number of molecules per square micron of the area in the cluster.
Sample drift was corrected using methods similar to those published previously [7,23,24]. All final images shown were drift corrected. Drift was corrected by calculating cross-correlation between transmitted light images taken before and after FPALM acquisition using the same EMCCD camera used for FPALM image acquisition. The displacement of the sample was cal-culated by determining the cross-correlation between the two images using the pixel counts of the transmitted light images and fitting the central peak of the resulting cross-correlation sur-face with a 2D Gaussian. The trajectory of the drift was linearly interpolated between the two end points of the displacement, and the localized molecule positions were then subtracted by the amount of drift interpolated according to their frame number. In cases where the cross-correlation peak was not strong, the particular data set was discarded to ensure proper com-pensation of a sample drift. All analysis was performed using custom software in MATLAB (Mathworks, Natick, MA).
Results
Schematic of Sample Preparation
Identification of Single Molecules
in vivo
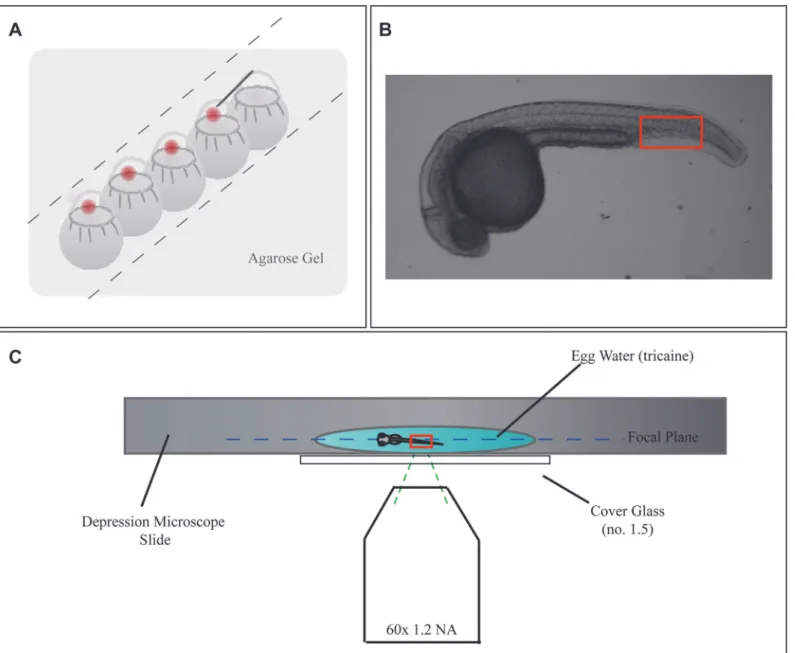
Using the FPALM setup described in Materials and Methods, images on the computer preview screen, prior to acquisition, were visually examined for single molecule fluorescence emission with diffraction-limited profile consistent in size and duration with the PA-FPs being activated and excited. At the above pixel size and laser intensities we employed for the PA-FPs used in our studies, the PSF of molecules were observed to have a diameter of 2–3 pixels and were visi-ble for 1–4 frames, or ~3–12 ms in duration. Following this confirmation of well-profiled PSFs, images were acquired as described in Materials and Methods. Note that the images and analysis Figure 1. Widefield FPALM Enables Penetration Into Sample.Schematic of experimental setup.A)Diagram demonstrating howCasper fmsembryos were injected at the 1-cell stage with linearized DNA plus phenol red indicator.B)A widefield image of a 24 hpf zebrafish embryo. Outlined in red is the region of the tail that FPALM images were acquired at, as it is the thinnest part of the fish and also has minimum autofluorescence.C)A 24 hpf embryo was placed in a microscope slide with a single shallow depression, immersed in a drop of non-lethal tricaine (solubilized in egg water). A cover slide (#1.5) was placed over the slide, covering the embryo and the coverslip was mounted on a microscopy setup suitable for FPALM.
applies only to the localized, fluorescent Cav-1a molecules and does not account for the endog-enous, non-fluorescent Cav-1a molecules that may be present in the analyzed cells.
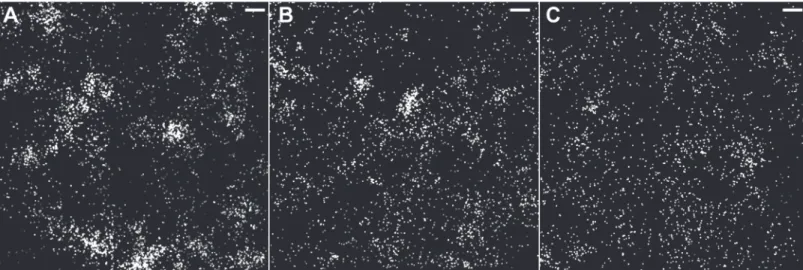
For the localization analysis of acquired frames, single photoactivated molecules were iden-tified and localized as described previously [2,10,20,25,26]. Some photoactivatable fluorescent proteins are known to reversibly photoswitch. However, dendra2 was in part selected because it demonstrates in irreversible photoconversion [15] and has limited susceptibility to reversible switching [27]. Typical background noise ranged from ~7–12 photons. Similar background levels were observed in control embryos injected with DNA elution buffer (data not shown). Further, to demonstrate the cycle of activation, localization, and photobleaching, analysis was performed on consecutive raw frames of data taken from an image of an embryo that was in-jected with pcDNA3.1 cav1a-HL4 dendra2 plasmid. A single raw frame which has an activated molecule that was identified and localized during analysis is shown (Fig. 2). The five raw frames prior to the molecule are shown as well as the five raw frames subsequent to the activated mole-cule. This sequence of raw frames shows no molecule, an activated molecule which was local-ized, followed by no visible molecule, presumably due to photobleaching.
Typical super resolution techniques such as FPALM offer localization precisions of ~20 nm laterally, which is ~10-fold greater than resolutions of conventional optical microscopies. However, due to their fine resolution, such techniques are more sensitive to sample drift, which could lead to blurred images with poor resolution or misinterpretation of data, especially in an anesthetized but living organism. We applied ourin vivoimages with methods which correct for two-dimensional drift in a manner that has been previously reported [1,7,23,24]. This correction is performed using transmitted light images without extraneous fiduciary markers [1,3,28].
During image acquisition, sample or instrument drift can occur over the range of several hundred nanometers. For super-resolution imaging techniques, even a small drift can distort images, depending on the size of the structure in question [1,7,23,24]. In the past, fiduciary markers such as gold nanoparticles, quantum dots, or fluorescent beads have been introduced into the sample to aid with drift correction. However, these methods require the addition of markers into a sample, potentially perturbing the biology itself, and the instrument may need to be adjusted to image or accommodate such markers. An alternative to fiduciary markers re-lies on the structure itself to be used to measure and compensate for drift [7,24]. In applications of our in vivo imaging, the dynamic rearrangement of structures may be the question of inter-est, and such methods cannot be directly used here. As an alternative, we applied the cross-cor-relation of transmitted light images, before and after the acquisition, which does not change as rapidly as cellular membrane constitutions, under suitable conditions. For our studies, it was assumed that drift within a single recorded camera frame was negligible. We excluded data sets for which we could not identify a clear peak in the cross-correlation between the transmitted light images, taken before and after the FPALM acquisitions. A lack of such cross-correlation peak indicates great morphological changes of the cell during the imaging, which would inter-fere with the ability to reliably determine the sample drift using this method. Uncertainty of Figure 2. Identification of Single Moleculesin vivo.The image demonstrates the ability to identify and localize single molecules above background in a living zebrafish embryo. Each image showsa single frame during image acquisitionof a cell in an embryo during localization analysis.Casper fmszebrafish were injected at the 1-cell stage with plasmid DNA and images were captures 24 h post injection (i.e. 24 hpf). A single molecule is shown over consecutive frames, where the molecule is not present, turned on during the frame in which it is activated and localized, and then presumably has photobleached during acquisition of the subsequent frames. Note that the single molecule image appears to be approximately the width expected from the diffraction limit. Brightness and contrast were linearly adjusted in ImageJ for all frames for presentation purposes.Scale bar,500 nm.
our drift-correction was determined by calculating 95% confidence intervals for the Gaussian fitting of the cross-correlation peaks. For the drift-correction data set (n = 7 cells), the uncer-tainty of our drift correction ranged from 7–37nm, all below the localization precision of 40nm in our work.
In vivo
visualization of Caveolae-Like Membrane Domains Using
FPALM
To test the specificity of the pcDNA3.1 cav1a-HL4 dendra2 images, a Cav-1a MO was used to knockdown the expression of Cav-1a protein. Zebrafish embryos were injected at the 1-cell stage with both plasmid DNA (cav1a-Dendra2,Fig. 3A) or Cav-1a MO (Fig. 3B). To confirm that no effects were a result of the MO injection, Control MO was also co-injected with cav1a-HL4-dendra2, and no differences were seen as a result of the MO (data not shown). Prior to imaging, embryos were manually dechorionated (24 h post injection) before being immersed in tricaine for imaging. Caveolae were observed in embryos injected with cav1a-Dendra2 (i.e. no Cav-1a MO knockdown) (Fig. 3A). However, in embryos injected with Cav-1a MO and cav1a-Dendra2, very few (29) molecules were localized (Fig. 3B), demonstrating that upon knockdown of Cav-1a expression with the MO, fluorescently labeled caveolae were not observed.
FPALM Imaging
in vivo
Enables Penetration into Zebrafish with
Sub-Diffraction Limited Resolution
Although single molecule microscopy in a living organism has been demonstrated with TIRF [29], TIRF does not enable imaging of thick samples because its setup restricts the excitation of fluorophores to those in close proximity to the coverglass (~100 nm thickness) [30]. This opti-cal section thickness is approximately one-tenth that afforded by confoopti-cal fluorescence micros-copy techniques. However, confocal microsmicros-copy does not approach the resolution levels that Figure 3. Cav-1 Specificity of Localized Molecules DemonstratesIn vivoVisualization of Caveolae.Casper fmszebrafish were injected at the 1-cell stage with plasmid DNA and images were captured 24 h post injection (i.e. 24 hpf). A) Control MO + Cav-1b dendra2 demonstrates single cav1 molecules are localized. B) Image rendered from Cav1b MO+Cav-1b dendra2 embryos with knockdown of Cav1b expression demonstrates that the molecules seen in control are in fact Cav1b molecules.Scale bar,1μm.
super-resolution techniques can provide. Here, FPALM imaging in a zebrafish embryo is dem-onstrated using widefield illumination, which excites fluorophores in the entire column of laser illumination and thus enables imaging of single molecules in a thick sample. An FPALM image with simple widefield illumination produces a two-dimensional projection of molecules within ~400 nm in the axial direction, for the numerical aperture (NA) of the objective lens used here, as determined by the axial focal volume of the PSF. Excitation of molecules over a wide range of axial positions with widefield illumination in principle allows three-dimensional imaging with biplane [6] or astigmatism [7] to be performedin vivo.
Zebrafish embryos were injected at the 1-cell stage with both plasmid DNA (pcDNA3.1 cav1a-HL4 dendra2) and manually dechorionated at 24 h post injection, prior to imaging. Em-bryos were immersed in tricaine and imaged as shown inFig. 1. The focal plane for imaging was determined based on observations of 405-nm-dependent single molecule photoactivation and a high density of molecules visible within each camera frame. Regions of interest from ten cells each from two different fish were analyzed (n = two separate experiments). Data for ren-dered images was captured in this plane (Fig. 4A). After acquisitions within this plane were completed, the imaging plane was moved up (deeper into the embryo) by ~5μm for imaging, and a new data set of 5000 frames was acquired (Fig. 4B). This axial translation was repeated once more such that a third acquisition was obtained with the imaging plane ~10μm into the sample, relative to the initial imaging plane (Fig. 4C) (for a total of three acquisitions spaced evenly ~5μm apart over a total range of 10μm). At the original focal plane, 10,046 molecules were localized. Images taken deeper into the sample had fewer molecules (9,319 and 4,434 mol-ecules, respectively). Thus, unlike TIRF microscopy, the ability to move the focal plane, com-bined with widefield illumination for FPALM, yielded large numbers of molecules acquired at different depths, allowing possibilities of section-specific studies of living tissuesin vivo.
Caveolae-like Structures Visible at Cell Membrane
An important question was whether we were definitively imaging caveolae, and whether, after overexpression of Cav-1a, imaged structures represented native caveolae.Fig. 3demonstrated
Figure 4. Widefield FPALM Enables Penetration Into Sample.Single molecule localization with FPALM has greater Z-depth into the sample than TIRF microscopy. Images show a region of a zebrafish cell after localization of single molecules.Casper fmszebrafish were injected at the 1-cell stage with plasmid DNA and images were captured 24 h post injection (i.e. 24 hpf).(A)Image at focal plane of fish with high dendra2 expression (0μm/10,046
molecules);(B)Image shown 5μm above the focal plane depicted in A (9319 molecules);(C)Image shown 5μm above the focal plane depicted in B, or
10μm above the focal plane depicted in A (4434 molecules).Scale bar,500 nm.
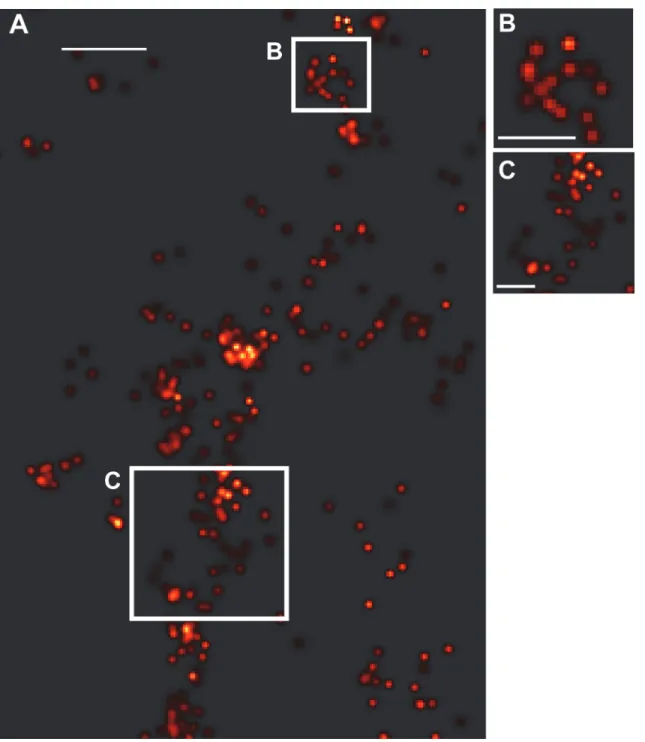
the specificity with which we were imaging Cav-1a. However, in order to look more closely at the structure being imaged, we performed additional experiments looking at the cell membrane for evidence of caveolae-like morphology (Fig. 5). We assessed the size of caveolae-like clusters and counted the number of molecules per cluster in membrane clusters that we identified as putative caveolae. Fifteen cells/clusters from two different fish were analyzed from two separate experiments. The average diameter of the observed caveolae was ~124 nm± 7.4, while the num-ber of molecules per caveolae was 116 with a standard error of the mean ± 17. Estimating the density of localizations for a circular domain of 124 nm diameter, we obtain an area ofA=πr2= 0.0123μm2, yielding a density of ~9500 molecules/μm2, or an average nearest neighbor distance ofd= ~10.3±0.8 nm.
Discussion
In this study, we performed super-resolution microscopy in a living zebrafish embryo. By studying living zebrafish embryos, we extended FPALM toin vivoimaging of a vertebrate organism. Performing FPALM in a living zebrafish embryo is a major extension of super-resolution microscopy and opens the possibility for nanoscale imaging of proteins (and other molecules) of interest in a living organism.In vivoFPALM exploits the optical clarity of the zebrafish to image biological structures beyond the diffraction limit with resolutions limited only by density and localization precisions of molecules. Such studies can yield a greater level of understanding of caveolae domains. Caveolae are important for signal transduction, are uti-lized by pathogens to gain entry into host cells, and are important in organizing antiviral recep-tor molecules for host innate immune response [14].
Recent publications have reported the use of stimulated emission depletion (STED) to imageCaenorhabditis elegans(C.elegans) nematodes expressing a GFP-fusion protein to look at neurons with an approximate resolution of<60 nm [11], PALM to image an actin protein in
live bacteria cells at ~40 nm resolution [12,31], and TIRF to visualize molecules and perform single particle tracking in a zebrafish cell line and also in 2-day-old zebrafish embryos [29]. From our results we estimate a localization precision ofσxy= ~40 nm. Because the nearest
neighbor distanced= ~10.3±0.8 nm is much smaller thanσxy, the resolution is limited
primari-ly byσ
xy, and therefore can be estimated as r~
ffiffiffiffiffiffiffiffiffiffiffiffiffiffiffiffiffiffiffiffiffiffi s2
xyþ ð2dÞ
2
q
= 45 nm. [26,32]. This is consistent with the size of caveolae we measured (124 nm ± 7.4 nm), which is expected to be somewhat larger than the actual size (50–80nm) due to the (45 nm) resolutionin vivo. Similarly to zebra-fish,C.elegansare transparent and small in size, and therefore amenable to microscopy studies of biological functionsin vivo. Single molecule investigations such as these have led to impor-tant insights into intracellular processes nematodes or bacteria. However, these models greatly lack the complexity and genetic similarity to humans needed in an advanced animal model for many aspects of human health and TIRF is limited to imaging a thin layer in close proximity to the coverslip. Our research interests led us to seek a method for extending the field of super-resolution microscopy to studies within a vertebrate organism displaying functional similarities to humans.
tend to form convolutions of the actual structure to yield slightly larger and blurred images, as in all localization microscopy methods. The number of molecules/cluster (~116; s.e.m. is ± 17) is comparable to that which we have previously observedin vitro(~135 molecules/cluster) [14]. Due to their sub-diffraction size, caveolae have been difficult to image using diffraction limited fluorescence microscopy, however FPALM affords the ability to image caveolae in a liv-ing organism. Both caveolae and the main protein components of caveolae, the caveolins, have Figure 5. Caveolae-like structures evident at cell membrane.(A) Shown are molecules along the membrane of one cell representative of the experiment, where clusters of Cav-1 molecules can be seen. Magnifications (B, C) of the regions marked by the white boxes in A show structures indicative of caveolae. Scale bar for A,250 nm.Scale bar for B-C,125 nm.
been linked to a variety of human diseases such as cancer, diabetes, atherosclerosis, Alzhei-mer’s, and muscular dystrophy [17]. Here, we have demonstrated the ability to image caveolae in a living zebrafish. Further, we have shown the ability to localize molecules up to 10μm with-in the live zebrafish, but believe that deeper penetration is possible, withwith-in the range afforded by the working distance of the objective lens, under controlled amounts of fluorescence scatter-ing and background. Current studies are underway to determine the fundamental limitations on depth.
The imaging parameters discussed herein are not exhaustive, and current work is being per-formed to provide additional options and improvements to the FPALM imaging described. A primary concern includes locating proteins of interest within the zebrafish or knowing which cells are being imaged. In contrast to cell culture experiments where monolayer cells are being imaged or TIRF [29] imaging with a limited sample penetration depth (~100 nm thickness), we are imaging into a thick, three dimensional sample. Such problems can be alleviated by tis-sue-specific labeling techniques and locating fluorescence signals from the labels, which do not overlap with fluorescence emission used for FPALM imaging. Due to the shape of the cells im-agedin vivo, we predict that we are looking at epithelial or fibroblast cells. The studies de-scribed here were performed using a protein of interest that was structurally distinct and that has also been imagedin vitro[14]. Embryos were first examined for expression of unconverted Dendra2 and scanned until images on the camera screen showed flashes of light consistent in size and duration with PA-FPs (~2–3 pixels for ~ 10 ms over 2–4 frames) being activated and showing single molecule fluorescence. One advantage of using this construct was that Cav-1 molecules are highly expressed, which further facilitated imaging with greater penetration into the embryo, where protein density was still sufficient to image large numbers (thousands) of single molecules to provide sufficient density of molecules and thus high image resolutions. La-beling density is an important consideration because a sufficient number of localizations are needed to define a structure with enough resolution, and the number of localizations is limited by the density of labels on the protein of interest.
Providing a noninvasive tool for super-resolution imaging,in vivoFPALM can enable inves-tigations of many more types of intracellular processes. The present study demonstrates the possibility of extendingin vivosingle molecule super-resolution imaging to a wide variety of new applications. Transgenic zebrafish lines that stably express photoactivatable fluorescent fu-sion proteins could be used, or new ones generated, in acasper fmsgenetic background so that investigations can be performed at later developmental stages of the zebrafish. Utilizing a photoconvertible probe such as dendra2 that enables pre-screening of embryos with fluores-cence from its inactive form is recommended, since the photophysical properties of the probe used will play a significant role in the spatial resolution and the rate of image acquisition. The zebrafish is an ideal model organism for a variety of processes such as infection and immunity [33–42], cancer [40,41,43], and muscular dystrophy [44,45] andin vivoFPALM provides the opportunity to provide insights into mechanisms underlying a variety disease processes at the molecular level.
In our studies, typical background noise observed was ~7–12 photons. The use of thecasper fmstransgenic zebrafish line greatly alleviated background due to the lack of melanocytes and iridophores in thecasper fmsembryos [19]; however, the fish still featured measurable levels of inherent autofluorescence and out-of-focus background. Probe choice is again important when considering background, as using probes with large contrast will improve signal-to-background ratios. Additionally, probes with longer wavelength emission may help minimize detected background from having reduced light scattering.
Still, further possibilities for exploiting the optical transparency of zebrafish for FPALM im-aging are numerous and offer many advantages over previously described techniques. In prin-ciple,in vivoimaging with FPALM is compatible with polarization-FPALM (P-FPALM) [46], biplane-FPALM (BP-FPALM) [6] and multicolor imaging [9]. To achieve combinations of these techniques would require the addition of a polarizing beamsplitter, a 50:50 beamsplitter or a dichroic mirror, as well as mirrors, and lenses to the original FPALM detection path. Similar to the multi-color imagingin vitropreviously demonstrated [9], employing additional PA-FPs forin vivocolocalization imaging experiments can be easily achieved. Optimal probe combinations with spectral separation, high brightness, contrast and rate of photon emission should be used to further progress toward nanoscale colocalization of proteins of living vertebrate organismsin vivo.
The advent of super resolution microscopy imaging techniques such as FPALM is pushing the biomedical sciences into an era where imaging below the diffraction limit is becoming as commonplace as conventional imaging currently has been in the past. We have demonstrated a method for imaging single molecules in a living organism with resolution below the diffrac-tion limit. The imaging capabilities and possibilities ofin vivoFPALM should substantially benefit investigations into biological functions in a living vertebrate organism with relevance to human diseases. Applications ofin vivoFPALM techniques provide the opportunity to ask and answer a multitude of questions in a living organism with diffraction-unlimited resolutions. New biological insights are hopefully imminent.
Acknowledgments
The authors thank Dr. Nikki Curthoys, Dr. Paul Millard, and Dr. Con Sullivan for useful dis-cussions, and Phil Andresen, Andrew Nelson, Richard Luc, and Mat Parent for technical and programming assistance.
Author Contributions
Conceived and designed the experiments: KAG CHK STH. Performed the experiments: KAG DK. Analyzed the data: KAG DK CHK STH. Contributed reagents/materials/analysis tools: CHK STH. Wrote the paper: KAG STH.
References
1. Rust MJ, Bates M, Zhuang X (2006) Sub-diffraction-limit imaging by stochastic optical reconstruction microscopy (STORM). Nat Methods 3: 793–795. PMID:16896339
2. Hess ST, Girirajan TP, Mason MD (2006) Ultra-high resolution imaging by fluorescence photoactivation localization microscopy. Biophys J 91: 4258–4272. PMID:16980368
3. Betzig E, Patterson GH, Sougrat R, Lindwasser OW, Olenych S, et al. (2006) Imaging intracellular fluo-rescent proteins at nanometer resolution. Science 313: 1642–1645. PMID:16902090
5. Hess ST, Gould TJ, Gudheti MV, Maas SA, Mills KD, et al. (2007) Dynamic clustered distribution of hemagglutinin resolved at 40 nm in living cell membranes discriminates between raft theories. Proc Natl Acad Sci U S A 104: 17370–17375. PMID:17959773
6. Juette MF, Gould TJ, Lessard MD, Mlodzianoski MJ, Nagpure BS, et al. (2008) Three-dimensional sub-100 nm resolution fluorescence microscopy of thick samples. Nat Methods 5: 527–529. doi:10.1038/
nmeth.1211PMID:18469823
7. Huang B, Wang W, Bates M, Zhuang X (2008) Three-dimensional super-resolution imaging by stochas-tic opstochas-tical reconstruction microscopy. Science 319: 810–813. doi:10.1126/science.1153529PMID:
18174397
8. Bates M, Huang B, Dempsey GT, Zhuang X (2007) Multicolor super-resolution imaging with photo-switchable fluorescent probes. Science 317: 1749–1753. PMID:17702910
9. Gunewardene MS, Subach FV, Gould TJ, Penoncello GP, Gudheti MV, et al. (2011) Superresolution imaging of multiple fluorescent proteins with highly overlapping emission spectra in living cells. Biophys J 101: 1522–1528. doi:10.1016/j.bpj.2011.07.049PMID:21943434
10. Gabor KG, MS., Santucci D, and Hess ST (2011) Localization-Based Super-Resolution Light Microsco-py. Microscopy Today 19: 12–16.
11. Rankin BR, Moneron G, Wurm CA, Nelson JC, Walter A, et al. (2011) Nanoscopy in a living multicellular organism expressing GFP. Biophys J 100: L63–65. doi:10.1016/j.bpj.2011.05.020PMID:21689517
12. Biteen JS, Moerner WE (2010) Single-molecule and superresolution imaging in live bacteria cells. Cold Spring Harb Perspect Biol 2: a000448. doi:10.1101/cshperspect.a000448PMID:20300204
13. Biteen JS, Shapiro L, Moerner WE (2011) Exploring protein superstructures and dynamics in live bacte-rial cells using single-molecule and superresolution imaging. Methods Mol Biol 783: 139–158. doi:10.
1007/978-1-61779-282-3_8PMID:21909887
14. Gabor KA, Stevens CR, Pietraszewski MJ, Gould TJ, Shim J, et al. (2013) Super resolution microscopy reveals that caveolin-1 is required for spatial organization of CRFB1 and subsequent antiviral signaling in zebrafish. PLoS One 8: e68759. doi:10.1371/journal.pone.0068759PMID:23874753
15. Chudakov DM, Lukyanov S, Lukyanov KA (2007) Using photoactivatable fluorescent protein Dendra2 to track protein movement. Biotechniques 42: 553, 555, 557 passim. PMID:17515192
16. Chudakov DM, Lukyanov S, Lukyanov KA (2007) Tracking intracellular protein movements using photoswitchable fluorescent proteins PS-CFP2 and Dendra2. Nat Protoc 2: 2024–2032. PMID:
17703215
17. Parton RG, Simons K (2007) The multiple faces of caveolae. Nat Rev Mol Cell Biol 8: 185–194. PMID:
17318224
18. Galbiati F, Razani B, Lisanti MP (2001) Emerging themes in lipid rafts and caveolae. Cell 106: 403–
411. PMID:11525727
19. White RM, Sessa A, Burke C, Bowman T, LeBlanc J, et al. (2008) Transparent adult zebrafish as a tool for in vivo transplantation analysis. Cell Stem Cell 2: 183–189. doi:10.1016/j.stem.2007.11.002PMID:
18371439
20. Gould TJ, Verkhusha VV, Hess ST (2009) Imaging biological structures with fluorescence photoactiva-tion localizaphotoactiva-tion microscopy. Nat Protoc 4: 291–308. doi:10.1038/nprot.2008.246PMID:19214181
21. Sternberg SR (1983) Biomedical Image Processing. Computer 16: 22–34.
22. Gudheti MV, Curthoys NM, Gould TJ, Kim D, Gunewardene MS, et al. (2013) Actin mediates the nano-scale membrane organization of the clustered membrane protein influenza hemagglutinin. Biophys J 104: 2182–2192. doi:10.1016/j.bpj.2013.03.054PMID:23708358
23. Mlodzianoski MJ, Schreiner JM, Callahan SP, Smolkova K, Dlaskova A, et al. (2011) Sample drift cor-rection in 3D fluorescence photoactivation localization microscopy. Opt Express 19: 15009–15019.
doi:10.1364/OE.19.015009PMID:21934862
24. Huang B, Jones SA, Brandenburg B, Zhuang X (2008) Whole-cell 3D STORM reveals interactions be-tween cellular structures with nanometer-scale resolution. Nat Methods 5: 1047–1052. doi:10.1038/
nmeth.1274PMID:19029906
25. Gould TJ, Hess ST (2008) Chapter 12: Nanoscale biological fluorescence imaging: breaking the diffrac-tion barrier. Methods Cell Biol 89: 329–358. doi:10.1016/S0091-679X(08)00612-2PMID:19118681
26. Hess ST, Gould TJ, Gunewardene M, Bewersdorf J, Mason MD (2009) Ultrahigh resolution imaging of biomolecules by fluorescence photoactivation localization microscopy. Methods Mol Biol 544: 483–
522. doi:10.1007/978-1-59745-483-4_32PMID:19488720
27. Lee SH, Shin JY, Lee A, Bustamante C (2012) Counting single photoactivatable fluorescent molecules by photoactivated localization microscopy (PALM). Proc Natl Acad Sci U S A 109: 17436–17441. doi:
28. Lee SH, Baday M, Tjioe M, Simonson PD, Zhang R, et al. (2012) Using fixed fiduciary markers for stage drift correction. Opt Express 20: 12177–12183. doi:10.1364/OE.20.012177PMID:22714205
29. Schaaf MJ, Koopmans WJ, Meckel T, van Noort J, Snaar-Jagalska BE, et al. (2009) Single-molecule microscopy reveals membrane microdomain organization of cells in a living vertebrate. Biophys J 97: 1206–1214. doi:10.1016/j.bpj.2009.05.044PMID:19686669
30. Reck-Peterson SL, Derr ND, Stuurman N (2010) Imaging single molecules using total internal reflection fluorescence microscopy (TIRFM). Cold Spring Harb Protoc 2010: pdb top73.
31. Biteen JS, Thompson MA, Tselentis NK, Bowman GR, Shapiro L, et al. (2008) Super-resolution imag-ing in live Caulobacter crescentus cells usimag-ing photoswitchable EYFP. Nat Methods 5: 947–949. doi:
10.1038/nmeth.1258PMID:18794860
32. Shroff H, Galbraith CG, Galbraith JA, White H, Gillette J, et al. (2007) Dual-color superresolution imag-ing of genetically expressed probes within individual adhesion complexes. Proc Natl Acad Sci U S A 104: 20308–20313. PMID:18077327
33. Dooley K, Zon LI (2000) Zebrafish: a model system for the study of human disease. Curr Opin Genet Dev 10: 252–256. PMID:10826982
34. Kanther M, Rawls JF (2010) Host-microbe interactions in the developing zebrafish. Curr Opin Immunol 22: 10–19. doi:10.1016/j.coi.2010.01.006PMID:20153622
35. Lieschke GJ, Currie PD (2007) Animal models of human disease: zebrafish swim into view. Nat Rev Genet 8: 353–367. PMID:17440532
36. Meeker ND, Trede NS (2008) Immunology and zebrafish: spawning new models of human disease. Dev Comp Immunol 32: 745–757. doi:10.1016/j.dci.2007.11.011PMID:18222541
37. Phelan PE, Pressley ME, Witten PE, Mellon MT, Blake S, et al. (2005) Characterization of snakehead rhabdovirus infection in zebrafish (Danio rerio). J Virol 79: 1842–1852. PMID:15650208
38. Phennicie RT, Sullivan MJ, Singer JT, Yoder JA, Kim CH (2011) Specific resistance to Pseudomonas aeruginosa infection in zebrafish is mediated by the cystic fibrosis transmembrane conductance regula-tor. Infect Immun 78: 4542–4550.
39. Prouty MG, Correa NE, Barker LP, Jagadeeswaran P, Klose KE (2003) Zebrafish-Mycobacterium mari-num model for mycobacterial pathogenesis. FEMS Microbiol Lett 225: 177–182. PMID:12951238
40. Sullivan C, Kim CH (2008) Zebrafish as a model for infectious disease and immune function. Fish Shell-fish Immunol 25: 341–350. doi:10.1016/j.fsi.2008.05.005PMID:18640057
41. van der Sar AM, Appelmelk BJ, Vandenbroucke-Grauls CM, Bitter W (2004) A star with stripes: zebra-fish as an infection model. Trends Microbiol 12: 451–457. PMID:15381194
42. van der Sar AM, Musters RJ, van Eeden FJ, Appelmelk BJ, Vandenbroucke-Grauls CM, et al. (2003) Zebrafish embryos as a model host for the real time analysis of Salmonella typhimurium infections. Cell Microbiol 5: 601–611. PMID:12925130
43. Mione M, Meijer AH, Snaar-Jagalska BE, Spaink HP, Trede NS (2009) Disease modeling in zebrafish: cancer and immune responses—a report on a workshop held in Spoleto, Italy, July 20–22, 2009.
Zebra-fish 6: 445–451. doi:10.1089/zeb.2009.0638PMID:20047471
44. Bassett DI, Bryson-Richardson RJ, Daggett DF, Gautier P, Keenan DG, et al. (2003) Dystrophin is re-quired for the formation of stable muscle attachments in the zebrafish embryo. Development 130: 5851–5860. PMID:14573513
45. Goody MF, Kelly MW, Lessard KN, Khalil A, Henry CA (2010) Nrk2b-mediated NAD+ production regu-lates cell adhesion and is required for muscle morphogenesis in vivo: Nrk2b and NAD+ in muscle mor-phogenesis. Dev Biol 344: 809–826. doi:10.1016/j.ydbio.2010.05.513PMID:20566368
46. Gould TJ, Gunewardene MS, Gudheti MV, Verkhusha VV, Yin SR, et al. (2008) Nanoscale imaging of molecular positions and anisotropies. Nat Methods 5: 1027–1030. doi:10.1038/nmeth.1271PMID: