• Nenhum resultado encontrado

On recent (2008–2012) stratospheric aerosols observed by lidar over Japan

N/A
N/A
Protected

Academic year: 2017

Share "On recent (2008–2012) stratospheric aerosols observed by lidar over Japan"

Copied!
25
0
0

Texto

(1)

ACPD

12, 22757–22781, 2012

On recent stratospheric aerosols observed by

lidar over Japan

O. Uchino et al.

Title Page

Abstract Introduction

Conclusions References

Tables Figures

◭ ◮

◭ ◮

Back Close

Full Screen / Esc

Printer-friendly Version Interactive Discussion

Discussion

P

a

per

|

Dis

cussion

P

a

per

|

Discussion

P

a

per

|

Discussio

n

P

a

per

Atmos. Chem. Phys. Discuss., 12, 22757–22781, 2012 www.atmos-chem-phys-discuss.net/12/22757/2012/ doi:10.5194/acpd-12-22757-2012

© Author(s) 2012. CC Attribution 3.0 License.

Atmospheric Chemistry and Physics Discussions

This discussion paper is/has been under review for the journal Atmospheric Chemistry and Physics (ACP). Please refer to the corresponding final paper in ACP if available.

On recent (2008–2012) stratospheric

aerosols observed by lidar over Japan

O. Uchino1,2, T. Sakai2, T. Nagai2, K. Nakamae1, I. Morino1, K. Arai3,

H. Okumura3, S. Takubo3, T. Kawasaki3, Y. Mano2, T. Matsunaga1, and T. Yokota1

1

National Institute for Environmental Studies, 16-2 Onogawa, Tsukuba, Ibaraki 305-8506, Japan

2

Meteorological Research Institute, 1-1 Nagamine, Tsukuba, Ibaraki 305-0052, Japan 3

Saga University, 1 Honjou, Saga, Saga 840-8502, Japan

Received: 20 July 2012 – Accepted: 23 August 2012 – Published: 3 September 2012

Correspondence to: O. Uchino (uchino.osamu@nies.go.jp)

(2)

ACPD

12, 22757–22781, 2012

On recent stratospheric aerosols observed by

lidar over Japan

O. Uchino et al.

Title Page

Abstract Introduction

Conclusions References

Tables Figures

◭ ◮

◭ ◮

Back Close

Full Screen / Esc

Printer-friendly Version Interactive Discussion

Discussion

P

a

per

|

Dis

cussion

P

a

per

|

Discussion

P

a

per

|

Discussio

n

P

a

per

|

Abstract

An increase in stratospheric aerosols caused by the volcanic eruption of Mt. Nabro

(13.37◦N, 41.70◦E) on 12 June 2011 was first detected by lidar at Tsukuba (36.05◦N,

140.13◦E) and Saga (33.24◦N, 130.29◦E) in Japan. The maximum backscattering

ra-tios at a wavelength of 532 nm were 2.0 at 17.0 km on 10 July 2011 at Tsukuba and 3.6

5

at 18.2 km on 23 June 2011 at Saga. The maximum integrated backscattering coeffi

-cients (IBCs) above the first tropopause height were 4.18×10⁻⁴sr−1 on 11 February

2012 at Tsukuba and 4.19×10⁻⁴sr−1on 23 June 2011 at Saga, respectively.

A time series of lidar observational results at Tsukuba have also been reported from January 2008 through May 2012. Increases in stratospheric aerosols were observed

10

after the volcanic eruptions of Mt. Kasatochi (52.18◦N, 175.51E) in August 2008 and

Mt. Sarychev Peak (48.09◦N, 153.20◦E) in June 2009. The yearly averaged IBCs at

Tsukuba were 2.60×10⁻⁴sr−1, 2.52×10⁻⁴sr−1, 2.45×10⁻⁴sr−1, and 2.20×10⁻⁴sr−1

for 2008, 2009, 2010, and 2011, respectively. These values were about twice the IBC

background level (1.21×10⁻⁴sr−1) from 1997 to 2001 at Tsukuba. We briefly discuss

15

the influence of the increased aerosols on climate and the implications for analysis of satellite data.

1 Introduction

Stratospheric aerosols play important roles in climate regulation and atmospheric

chemistry. The effects of the aerosols produced by the Pinatubo eruption is a good

20

example. The volcanic eruption of Mt. Pinatubo (15.14◦N, 120.35◦E) on 15 June 1991

injected huge amounts of SO2 and ash into the stratosphere. The Volcanic

Explosiv-ity Index (VEI) was 6 (Smithsonian Institution, 2012). The eruption injected into the

stratosphere an amount of SO2 estimated to be about 20 Tg, almost three times the

input from the 1982 El Chich ´on eruption (Bluth et al., 1992). The injected SO2 was

25

(3)

ACPD

12, 22757–22781, 2012

On recent stratospheric aerosols observed by

lidar over Japan

O. Uchino et al.

Title Page

Abstract Introduction

Conclusions References

Tables Figures

◭ ◮

◭ ◮

Back Close

Full Screen / Esc

Printer-friendly Version Interactive Discussion

Discussion

P

a

per

|

Dis

cussion

P

a

per

|

Discussion

P

a

per

|

Discussio

n

P

a

per

Read et al. (1993) estimated the e-folding decay time of SO2 to be 33 days. The first

increase of aerosols from the Pinatubo eruption was observed at an altitude of 15.7 km

over Tsukuba (36.05◦N, 140.13◦E) on 28 June 1991. The Pinatubo aerosol particles

were effectively transported from tropical regions into northern mid-latitudes during

fall through spring with planetary wave activity. The maximum backscattering ratio

ob-5

served at a wavelength of 532 nm was 14.1 at 22.7 km over Tsukuba on 29 November

1991. The maximum value of the integrated backscattering coefficient (IBC) above the

first tropopause height was 7.1×10⁻³sr−1over Tsukuba on 22 February 1992 (Uchino

et al., 1995).

The stratospheric aerosol surface area increased after the Pinatubo eruption (J ¨ager

10

et al., 1995; Uchino, 1996), and severe ozone loss occurred in 1992 and 1993 because of heterogeneous chemical reactions on aerosol surfaces in the presence of high con-centrations of anthropogenic chlorine and bromine (Hofmann et al., 1994; Kondo et al., 1995; WMO, 1995; Solomon et al., 1996).

The maximum net (thermal minus solar) radiative forcing from the 1991 Pinatubo

15

eruption was about−3 W m−2 (Hansen et al., 2005). Global lower stratospheric (30–

100 hPa) temperature anomalies increased after the eruption, and global tropospheric (300–850 hPa) temperature anomalies decreased after the eruption in spite of the warm ENSO episode in 1991/1992 (Kawamata et al., 1992). Global tropospheric tem-peratures generally increase after a warm ENSO episode. For two years following

ma-20

jor volcanic eruptions, global mean surface temperatures decrease by 0.1–0.2◦C, and

by 0.3◦C during the summer in the latitude band 30–60◦N (Robock and Mao, 1995). A

model simulation of the effects of the 1991 Pinatubo eruption predicted a decrease in

the global surface temperature by about 0.5◦C in September, October, and November

1992, in agreement with observations during that time (Hansen et al., 1996).

25

(4)

ACPD

12, 22757–22781, 2012

On recent stratospheric aerosols observed by

lidar over Japan

O. Uchino et al.

Title Page

Abstract Introduction

Conclusions References

Tables Figures

◭ ◮

◭ ◮

Back Close

Full Screen / Esc

Printer-friendly Version Interactive Discussion

Discussion

P

a

per

|

Dis

cussion

P

a

per

|

Discussion

P

a

per

|

Discussio

n

P

a

per

|

during the winter because they increase the temperature gradient between the equator and high latitudes. The stronger stratospheric polar night jet extends into the tropo-sphere through interactions with planetary waves, and changes in tropospheric circu-lation induce a stronger polar vortex and equatorward propagation of waves (Kodera, 1994). As a result, warm tropospheric temperature anomalies occur in the winter in the

5

Northern Hemisphere after major volcanic eruptions in the tropics.

The IBC of the Pinatubo aerosols decayed with e-folding times of 1.14, 1.29, and

1.37 yr over Tsukuba and Naha (26.2◦N, 127.7E) in Japan and over Lauder (45.0S,

169.7◦E) in New Zealand, respectively. The IBC over Tsukuba varied in a clearly

sea-sonal manner, with a maximum in winter and early spring and a minimum in summer.

10

The IBC over Tsukuba reached the background level in October 1997 (Nagai et al., 2010).

Since about 2000, an increase of 4–7 % per year in the IBC has been detected

within the 20–30 km altitude range at both Mauna Loa, Hawaii (19◦N), and Boulder,

Colorado (40◦N) (Hofmann et al., 2009). Likewise, after the IBC over Lauder reached

15

a minimum between 1997 and 2000, it increased 3.8 % per year from 2000 to 2009 (Nagai et al., 2010). Based on some satellite data, the stratospheric aerosol optical thickness (AOT) increased after 2000 as the result of a series of moderate but in-creasingly intense volcanic eruptions (Vernier et al., 2011). In fact, increases in strato-spheric aerosols were reported from lidar observations after the volcanic eruptions of

20

Mt. Kasatochi (52.18◦N, 175.51E) in August 2008 (Bitar et al., 2010) and Mt. Sarychev

Peak (48.09◦N, 153.20◦E) in June 2009 (Uchino et al., 2010; O’Neill et al., 2012).

In this paper we report the first observational results of stratospheric aerosols in

the year following the volcanic eruption of Mt. Nabro (13.37◦N, 41.70E) in June 2011

at two lidar sites in Tsukuba and Saga (33.24◦N, 130.29◦E), Japan. These two lidar

25

sites are prioritized validation sites for studying the influence of aerosols and thin

cir-rus clouds on column-averaged dry air mole fractions of carbon dioxide (XCO2) and

methane (XCH4) derived from data collected by the Greenhouse gases Observing

(5)

ACPD

12, 22757–22781, 2012

On recent stratospheric aerosols observed by

lidar over Japan

O. Uchino et al.

Title Page

Abstract Introduction

Conclusions References

Tables Figures

◭ ◮

◭ ◮

Back Close

Full Screen / Esc

Printer-friendly Version Interactive Discussion

Discussion

P

a

per

|

Dis

cussion

P

a

per

|

Discussion

P

a

per

|

Discussio

n

P

a

per

GOSAT was launched on 23 January 2009. At Saga, lidar observations started in March 2010. Next, we present lidar observational results from January 2008 to May 2012 over Tsukuba. Finally we discuss briefly the influence of the recent increase in stratospheric aerosols on GOSAT products and compare their impact on climate to the 1991 Pinatubo eruption.

5

2 Lidar instruments and data analysis

The compact lidars installed at Tsukuba and Saga were two-wavelength polarization lidar systems (Table 1), the fundamental and second harmonic having wavelengths

of 1064 nm (λ1) and 532 nm (λ2), respectively. Backscattered photons from the

atmo-sphere were collected by one or two Schmidt Cassegrain type telescopes. A

polar-10

izer divided photons at λ2 into components parallel (P) and perpendicular (S) to the

transmitted laser polarization plane. The received photons were converted to electrical

signals by an avalanche photodiode (APD, C30956EH) atλ1. Atλ2, three or five

photo-multiplier tubes (PMTs, R3234-01) were used to simultaneously obtain

high-dynamic-range signals from near the surface to an altitude of∼40 km. Transient recorders used

15

a 12-bit analog-to-digital (A/D) converter and a photon counter (TR 20-160) to process the output signals of the APD and PMTs. Because the APD signals were noisy above

altitudes of about 20–25 km, we used only lidar data atλ2for stratospheric aerosols.

The backscattering ratioR is defined as

R=(BR+BA)/BR, (1)

20

whereBR and BAare the molecular and aerosol backscattering coefficients,

respec-tively. We derived backscattering ratio profiles with an inversion method (Fernald,

1984). The lidar ratioS (particle extinction to backscatter ratio) is dependent on the

stratospheric aerosol size distribution and refractive index, and equalled 20–60 sr at

25

(6)

ACPD

12, 22757–22781, 2012

On recent stratospheric aerosols observed by

lidar over Japan

O. Uchino et al.

Title Page

Abstract Introduction

Conclusions References

Tables Figures

◭ ◮

◭ ◮

Back Close

Full Screen / Esc

Printer-friendly Version Interactive Discussion

Discussion

P

a

per

|

Dis

cussion

P

a

per

|

Discussion

P

a

per

|

Discussio

n

P

a

per

|

it equals about 50 sr for usual stratospheric aerosols. We assumed that the lidar ratio equalled 50 sr for the moderate volcanic eruptions of Kasatochi in 2008, Sarychev in June 2009 and Nabro in June 2011. We used the nearest operational radiosonde data to calculate the atmospheric molecular density. The radiosonde sounding stations are

Tateno (36.05◦N, 140.13E) and Fukuoka (33.58N, 130.38E) for Tsukuba and Saga,

5

respectively. We used the 1976 US Standard Atmosphere model above balloon burst altitudes (US Committee on Extension of the Standard Atmosphere, 1976). The lidar backscattered signal was interactively normalized to unity around 25–33 km, where aerosol-free conditions could be assumed.

We obtained IBCs by summing upBAs from the first tropopause height to an altitude

10

of 33 km. When cirrus clouds appeared above the tropopause, we set the lower limit of the integration to just above the altitude of the cirrus clouds. If the signal-to-noise ratio at higher altitudes was not good enough for integration purposes, the upper limit of the integration was decreased to a lower altitude where the signal-to-noise ratio was acceptable (Nagai et al., 2010)

15

The total linear depolarization ratio (δ) is defined as

δ=S/(P +S)·100 (%) (2)

whereP and S are the parallel and perpendicular components of the backscattered

signals. The particle depolarizationδpis obtained from the equation

20

δp=(δ·Rδm)/(R−1)·100 (%) (3)

whereδmis the depolarization ratio of atmospheric molecules (Sakai et al., 2003). We

adopted a vertical resolution of 150 m in the following analysis.

3 Observational results over Tsukuba and Saga after the 2011 Nabro eruption 25

(7)

ACPD

12, 22757–22781, 2012

On recent stratospheric aerosols observed by

lidar over Japan

O. Uchino et al.

Title Page

Abstract Introduction

Conclusions References

Tables Figures

◭ ◮

◭ ◮

Back Close

Full Screen / Esc

Printer-friendly Version Interactive Discussion

Discussion

P

a

per

|

Dis

cussion

P

a

per

|

Discussion

P

a

per

|

Discussio

n

P

a

per

(MODIS) on the Aqua satellite (NASA, 2012). The first SO2associated with the

erup-tion was measured on 12 June by the Infrared Atmospheric Sounding Interferometer

(IASI), and continued emissions were observed for weeks. The total mass of SO2

mea-sured by IASI was on the order of 1.5 Tg (Clarisse et al., 2012). Over Tsukuba, new aerosol layers with double peaks were observed on 20 June 2011 about 8 days after

5

the eruption (Fig. 1). The peak values ofRwere 1.58 and 1.32 at 16.0 and 16.4 km,

re-spectively. The values ofδandδpwere 1.25 % and 3.4 %, respectively, at 16.0 km and

1.94 % and 7.9 %, respectively, at 16.4 km. Non-spherical ash particles were probably

included in the layers with sulfuric acid particles that were produced from SO2through

chemical reactions. Non-spherical particles were also present in the lower region of the

10

aerosol layer on 12 September (δp=4.7 % at 17.0 km). The maximum backscattering

ratio (Rmax) of 2.0 was observed at 17.0 km on 10 July 2011.

Over Saga, new stratospheric aerosols with double peaks were detected on 23 June

2011. Peak values of R were 2.27 and 3.68 at 17.2 and 18.2 km, respectively. The

values of δp were 0.2 % and 0.8 % at 17.2 and 18.2 km, respectively. In this case,

15

aerosols were probably composed of spherical particles becauseδp was very small.

However, some non-spherical particles were also seen in the lower regions of the layers

on 29 August (δp=3.6 % at 16.6 km) and 24 September (δp=4.0 % at 16.6 km). In the

1991 Pinatubo eruption, non-spherical particles were present in the lower stratosphere for at least six months (Nagai et al., 1993) because the Pinatubo ash particles were

20

injected into higher altitudes than the Nabro ash particles.

We used the National Centers for Environmental Prediction (NCEP)/National Center for Atmospheric Research (NCAR) reanalysis data (Kalnay et al., 1996) and the Me-teorological Data Explorer (METEX), developed by Jiye Zeng at the Centre for Global Environmental Research (CGER) in the National Institute for Environmental Studies

25

(NIES) to calculate isentropic forward trajectories of 36 air parcels that originated from a

square of±1◦surrounding the Nabro volcano at altitudes of 16, 17, and 18 km. The

(8)

tempera-ACPD

12, 22757–22781, 2012

On recent stratospheric aerosols observed by

lidar over Japan

O. Uchino et al.

Title Page

Abstract Introduction

Conclusions References

Tables Figures

◭ ◮

◭ ◮

Back Close

Full Screen / Esc

Printer-friendly Version Interactive Discussion

Discussion

P

a

per

|

Dis

cussion

P

a

per

|

Discussion

P

a

per

|

Discussio

n

P

a

per

|

ture of 384.3 K) over Mt. Nabro were transported to∼16 km over Tsukuba on 20 June,

a result that was consistent with lidar observations as shown in Fig. 1. The air parcels moved eastward around the northern part of the Tibetan high-pressure ridge (Fig. 3).

The composite image of maximum observed SO2columns in Fig. 12 of Clarisse et al.

(2012) also shows this feature. We confirmed that the backward trajectory of an air

5

parcel from Tsukuba (16 km, 13:00 UT on 20 June 2011) arrived at a point (16.7 km,

14.62◦N, 33.42◦E) near Mt. Nabro on 23:00 UTC on 12 June. Therefore, new aerosol

layers observed over Japan in late June 2011 could have originated from the Nabro eruption on 12 June.

Figure 4 shows the time variation of IBC (pink solid diamond) and first tropopause

10

height (blue open circle) over Tsukuba (upper panel) and Saga (lower panel) from

June 2011 to May 2012. Over Tsukuba, the largest values of the IBC were ∼3.0×

10−4sr−1 in summer and ∼4.0×10⁻⁴sr−1 in winter. The maximum IBC was 4.18×

10−4sr−1 on 11 February 2012. In general the IBC increased when the tropopause

height decreased. Over Saga, the maximum IBC was 4.19×10⁻⁴sr−1on 23 June 2011,

15

the day of the first arrival of the Nabro aerosols. Then the IBC decreased quickly within a week, but increased again in late July. The IBC then decreased gradually from August

to December 2011, except for a brief peak larger than∼3.5×10⁻⁴sr−1on 24 and 25

November. The IBC increased again in January and February 2012. The mean value

of the IBC over Saga was 1.86×10⁻⁴sr−1from June 2011 to May 2012.

20

4 Time variation of stratospheric aerosols over Tsukuba from January 2008 to May 2012 and discussion

Mt. Kasatochi in the Aleutian Islands erupted on 7 and 8 August 2008, and the VEI was 4 (Smithsonian Institution, 2012). The Ozone Monitoring Instrument (OMI) on NASA’s

Aura satellite tracked a dense cloud that contained about 1.5 Tg of SO2. The SO2

25

clouds spread over the Arctic and eastward across the United States and Canada

(9)

vol-ACPD

12, 22757–22781, 2012

On recent stratospheric aerosols observed by

lidar over Japan

O. Uchino et al.

Title Page

Abstract Introduction

Conclusions References

Tables Figures

◭ ◮

◭ ◮

Back Close

Full Screen / Esc

Printer-friendly Version Interactive Discussion

Discussion

P

a

per

|

Dis

cussion

P

a

per

|

Discussion

P

a

per

|

Discussio

n

P

a

per

canic plume were detected with lidar one week after the eruption and for the next four months thereafter (Bitar et al., 2010). Over Tsukuba, stratospheric aerosols

pro-duced from those SO2gases were detected at 17.3 km and 16.0 km on 2 September

and at 18.7 km and 17.3 km on 16 September, about one month after the eruption

(Fig. 5). Clear peaks ofR were also seen on 4 and 21 October, but subsequently those

5

peaks were ambiguous. Obvious stratospheric aerosols from the Kasatochi eruption

were also observed from 10 September to 13 October over Ryori (39.03◦N, 141.82◦E)

(Sakashita et al., 2009).

Mt. Sarychev Peak erupted on 12 June 2009, and the VEI was 4 (Smithsonian Insti-tution, 2012). A new aerosol layer was observed at 20.6 km on 25 June over Tsukuba

10

(Fig. 6). The peak value ofR was 3.5. Becauseδp was 7 %, some non-spherical ash

particles were probably included in the layer. Backward trajectory analysis revealed that aerosols in the layer were transported to Tsukuba by easterly winds. Aerosols observed around 14–15 km on 5 July were transported by westerly winds. Enhanced aerosol lay-ers were also observed over other three lidar sites in Japan (Uchino et al., 2010).

15

Mt. Merapi (7.54◦S, 110.44◦E), one of Indonesia’s most active volcanoes, erupted on

October 2010, and the VEI was 4 (Smithsonian, 2012). Shortly thereafter we did not observe enhanced stratospheric aerosols that originated from the Merapi eruption,

be-cause noticeable peaks ofR were not detected.

The temporal variation of the IBC over Tsukuba from January 2008 through May

20

2012 is shown in Fig. 7, with the exception of about two months in 2011 after the Tohoku

earthquake off the Pacific Coast of Japan, when lidar data were not obtained. The

earthquake occurred in the northern part of Japan on 11 March 2011. After the decay of the Pinatubo aerosols, stratospheric aerosols were at background levels from October 1997 to September 2001 at Tsukuba (Nagai et al., 2010). The annual mean of the

25

IBC for the background aerosols was 1.21×10⁻⁴sr−1. Based on the fit of a sinusoidal

function to the data, the amplitude of the seasonal variation was 6.84×10⁻⁵sr−1, with

(10)

ACPD

12, 22757–22781, 2012

On recent stratospheric aerosols observed by

lidar over Japan

O. Uchino et al.

Title Page

Abstract Introduction

Conclusions References

Tables Figures

◭ ◮

◭ ◮

Back Close

Full Screen / Esc

Printer-friendly Version Interactive Discussion

Discussion

P

a

per

|

Dis

cussion

P

a

per

|

Discussion

P

a

per

|

Discussio

n

P

a

per

|

has occurred over the period 1972–2004, and therefore the background level of the IBC observed over Tsukuba from October 1997 to September 2001 might be similar to the background levels during the period 1972–2004.

Most IBCs from January 2008 through May 2012 in Fig. 7 were larger than those as-sociated with background aerosols during October 1997 through September 2001. The

5

IBCs increased after the volcanic eruptions of Mt. Kasatochi in August 2008 and Mt.

Sarychev Peak in June 2009. The total masses of SO2 from the Kasatochi, Sarychev

Peak, and Nabro eruptions were estimated to be 1.6 Tg, 0.9 Tg, and 1.5 Tg, respectively (Clarisse et al., 2012). However, the production rate of stratospheric aerosols depends

on the amounts of SO2 that are injected into the stratosphere. Before the Kasatochi

10

eruption, the IBC was larger than the background level, an observation consistent with that of Vernier et al. (2011) and possibly due to some other volcanic eruptions in the

tropics, including Tavurvur (4.27◦S, 152.2◦E) on 7 October 2006 and Soufri `ere Hills

(16.72◦N, 62.18W) on 20 May 2006.

The yearly averaged IBCs over Tsukuba were 2.60×10⁻⁴sr−1, 2.52×10⁻⁴sr−1,

15

2.45×10⁻⁴sr−1, and 2.20×10⁻⁴sr−1 for 2008, 2009, 2010, and 2011, respectively.

Therefore the elevations of the IBCs above background level were 1.39×10⁻⁴sr−1,

1.31×10⁻⁴sr−1, 1.24×10⁻⁴sr−1, and 0.99×10⁻⁴sr−1, respectively. The

correspond-ing elevations of the AOTs above background levels were 0.0070, 0.0066, 0.0062, and 0.0050, respectively, for an assumed lidar ratio of 50 sr. The corresponding increases of

20

negative radiative forcing (cooling) were roughly 0.18 W m−2, 0.17 W m−2, 0.16 W m−2

and 0.13 W m−2, respectively, based on a conversion factor of 25 W m−2 from AOT to

radiative forcing (Hansen et al., 2005; Solomon et al., 2011). These values are not small compared to the positive radiative forcing (heating) caused by increases in

at-mospheric CO2, which has averaged about 0.28 W m−

2

over the decade since 2000

25

(Solomon et al., 2011; NOAA, 2012). The average AOT for the 12 months following

Pinatubo was 0.13 over Tsukuba, and the Pinatubo aerosol cooling was 3.1 W m−2.

(11)

ACPD

12, 22757–22781, 2012

On recent stratospheric aerosols observed by

lidar over Japan

O. Uchino et al.

Title Page

Abstract Introduction

Conclusions References

Tables Figures

◭ ◮

◭ ◮

Back Close

Full Screen / Esc

Printer-friendly Version Interactive Discussion

Discussion

P

a

per

|

Dis

cussion

P

a

per

|

Discussion

P

a

per

|

Discussio

n

P

a

per

The surface temperature could be lowered by about 0.015–0.025◦C during the

sum-mer if we divide 0.3–0.5◦C by 20. It is very difficult to detect such a small change of

surface temperature during one year. However, it is noteworthy that increased strato-spheric aerosol radiative cooling continued for at least four years, from January 2008 to May 2012. Climate models have been used to simulate climate for a year after volcanic

5

eruptions (Haywood et al., 2010; Kravitz et al., 2011), but multi-year simulations will be

necessary to understand the effects of longer term increases in stratospheric aerosols,

because, for example, the ocean integrates volcanic radiative cooling and responds over a wide range of time scales (Stenchikov et al., 2009).

We next estimated the influence of the increase in stratospheric aerosols after

vol-10

canic eruptions on the XCO2 determined by GOSAT. When the GOSAT XCO2 is

re-trieved by using the 1.6-µm band without taking account of sulfuric acid particles in

the stratosphere, the negative bias of XCO2 is estimated to be 0.3 % (∼1 ppm) for an

AOT of 0.02 at 550 nm and surface albedo at 0.1 (Ota et al., 2008). It is noteworthy that the largest values of AOT at 532 nm after the volcanic eruptions of Mt. Sarychev

15

and Mt. Nabro were equal to or larger than 0.02. A regional and time-dependent bias

of 1 ppm is not small for surface CO2flux estimation (Rayer and O’Brien, 2001; Takagi

et al., 2011). Therefore, it is necessary to take into account the effects of increased

stratospheric aerosols for GOSAT XCO2retrieval (Uchino et al., 2012).

5 Concluding remarks

20

An increase in stratospheric aerosols caused by the volcanic eruption of Mt. Nabro on 12 June 2011 was first observed by lidars at Tsukuba and Saga in Japan. The maximum backscattering ratios at 532 nm were 2.0 at 17.0 km on 10 July over Tsukuba and 3.6 at 18.2 km on 23 June over Saga. The maximum integrated backscattering

coefficients above the first tropopause height to 33 km were 4.18×10⁻⁴sr−1 on 11

25

(12)

ACPD

12, 22757–22781, 2012

On recent stratospheric aerosols observed by

lidar over Japan

O. Uchino et al.

Title Page

Abstract Introduction

Conclusions References

Tables Figures

◭ ◮

◭ ◮

Back Close

Full Screen / Esc

Printer-friendly Version Interactive Discussion

Discussion

P

a

per

|

Dis

cussion

P

a

per

|

Discussion

P

a

per

|

Discussio

n

P

a

per

|

Lidar observational results at Tsukuba from January 2008 through May 2012 re-vealed increases in stratospheric aerosols after the volcanic eruptions of Mt. Kasatochi in August 2008 and Mt. Sarychev Peak in June 2009. The yearly averaged IBCs at

Tsukuba were 2.60×10⁻⁴sr−1, 2.52×10⁻⁴sr−1, 2.45×10⁻⁴sr−1, and 2.20×10⁻⁴sr−1

for 2008, 2009, 2010, and 2011, respectively. These values were about twice the IBC of

5

the background level (1.21×10⁻⁴sr−1) during the period from 1997 to 2001 at Tsukuba.

The elevations of annual average AOT above background levels were about 0.0050– 0.0070 from 2008 to 2011 based on an assumed lidar ratio of 50 sr. The negative

ra-diative forcing (cooling) was then roughly 0.13–0.18 W m−2for the same period based

on a conversion factor of 25 W m−2 from AOT to radiative forcing. These values are

10

not small compared to the radiative heating associated with increases in CO2, about

0.28 W m−2over the decade since 2000 (Solomon et al., 2011; NOAA, 2012). However,

because the concentrations of these volcanic aerosols are not always spatially homo-geneous, their radiative forcing might be overestimated. The influence of the increase

in stratospheric aerosols caused by volcanic eruptions on GOSAT XCO2 retrieval is

15

non-negligible.

Acknowledgement. We are grateful to Jiye Zeng for making METEX data available to us. We used the NCEP reanalysis data and radiosonde data measured by the Japan Meteorological Agency. The location and activity report of each volcano were quoted from the Smithsonian Institution – Global Volcanism Program (http://www.volcano.si.edu/index.cfm). This research 20

was supported in part by the Environment Research and Technology Development Fund (A-1102) of the Ministry of the Environment, Japan.

References

Bitar, L., Duck, T. J., Kristiansen, N. I., Stohl, A., and Beauchamp, S.: Lidar observations of Kasatochi volcano aerosols in the troposphere and stratosphere, J. Geophys. Res., 115, 25

(13)

ACPD

12, 22757–22781, 2012

On recent stratospheric aerosols observed by

lidar over Japan

O. Uchino et al.

Title Page

Abstract Introduction

Conclusions References

Tables Figures

◭ ◮

◭ ◮

Back Close

Full Screen / Esc

Printer-friendly Version Interactive Discussion

Discussion

P

a

per

|

Dis

cussion

P

a

per

|

Discussion

P

a

per

|

Discussio

n

P

a

per

Bluth, G. J. S., Doiron, S. D., Schnetzler, C. C., Krueger, A. J., and Walter, L. S.: Global tracking of the SO2clouds from the June, 1991 Mount Pinatubo eruptions, Geophys. Res. Lett., 19, 151–154, doi:10.1029/91GL02792, 1992.

Clarisse, L., Hurtmans, D., Clerbaux, C., Hadji-Lazaro, J., Ngadi, Y., and Coheur, P.-F.: Re-trieval of sulphur dioxide from the infrared atmospheric sounding interferometer (IASI), At-5

mos. Meas. Tech., 5, 581–594, doi:10.5194/amt-5-581-2012, 2012.

Deshler, T., Anderson-Sprecher, R., J ¨ager, H., Barnes, J., Hofmann, D. J., Clemesha, B., Si-monich, D., Osborn, M., Grainger, R. G., and Godin-Beekmann, S.: Trends in the nonvol-canic component of stratospheric aerosol over the period 1971–2004, J. Geophys. Res., 111, D01201, doi:10.1029/2005JD006089, 2006.

10

Fernald, F. G.: Analysis of atmospheric lidar observations: some comments, Appl. Opt, 23, 652–653, doi:10.1364/AO.23.000652, 1984.

Hansen, J., Sato, M., Ruedy, R., Lacis, A., Asamoah, K., Borenstein, S., Brown, E., Cairns, B., Caliri, G., Campbell, M., Curran, B., de Castro, S., Druyan, L., Fox, M., Johnson, C., Lerner, J., McCormick, M. P., Miller, R., Minnis, P., Morrison, A., Pandolfo, L., Ramberran, I., 15

Zaucker, F., Robinson, M., Russell, P., Shah, K., Stone, P., Tegen, I., Thomason, L., Wilder, J., and Wilson, H.: A Pinatubo climate modeling investigation, in: The Mount Pinatubo Eruption Effects on the Atmosphere and Climate, NATO ASI Ser., vol. I 42, edited by Fiocco, G., Fua, D., and Visconti, G., Springer-Verlag, Berlin Heidelberg, 233–272, 1996.

Hansen, J., Sato, M., Ruedy, R., Nazarenko, L., Lacis, A., Schmidt, G. A., Russell, G., Aleinov, I., 20

Bauer, M., Bauer, S., Bell, N., Cairns, B., Canuto, V., Chandler, M., Cheng, Y., Del Genio, A., Faluvegi, G., Fleming, E., Friend, A., Hall, T., Jackman, C., Kelley, M., Kiang, N., Koch, D., Lean, J., Lerner, J., Lo, K., Menon, S., Miller, R., Minnis, P., Novakov, T., Oinas, V., Perlwitz, J., Perlwitz, J., Rind, D., Romanou, A., Shindell, D., Stone, P., Sun, S., Tausnev, N., Thresher, D., Wielicki, B., Wong, T., Yao, M., and Zhang, S.: Efficacy of climate forcings, J. Geophys. Res., 25

110, D18104, doi:10.1029/2005JD005776, 2005.

Haywood, J. M., Jones, A., Clarisse, L., Bourassa, A., Barnes, J., Telford, P., Bellouin, N., Boucher, O., Agnew, P., Clerbaux, C., Coheur, P., Degenstein, D., and Braesicke, P.: Ob-servations of the eruption of the Sarychev volcano and simulations using the HadGEM2 climate model, J. Geophys. Res., 115, D21212, doi:10.1029/2010JD014447, 2010.

30

(14)

strato-ACPD

12, 22757–22781, 2012

On recent stratospheric aerosols observed by

lidar over Japan

O. Uchino et al.

Title Page

Abstract Introduction

Conclusions References

Tables Figures

◭ ◮

◭ ◮

Back Close

Full Screen / Esc

Printer-friendly Version Interactive Discussion

Discussion

P

a

per

|

Dis

cussion

P

a

per

|

Discussion

P

a

per

|

Discussio

n

P

a

per

|

sphere over the United States in 1992–1993: evidence for heterogeneous chemistry on the Pinatubo aerosol, Geophys. Res. Lett., 21, 65–68, doi:10.1029/93GL02526, 1994.

Hofmann, D., Barnes, J., O’Neill, M., Trudeau, M., and Neely, R.: Increase in background strato-spheric aerosol observed with lidar at Mauna Loa Observatory and Boulder, Colorado, Geo-phys. Res. Lett., 36, L15808, doi:10.1029/2009GL039008, 2009.

5

J ¨ager, H. and Deshler, T.: Lidar backscatter to extinction, mass and area conversions for strato-spheric aerosols based on midlatitude balloonborne size distribution measurements, Geo-phys. Res. Lett, 29, 1929, doi:10.1029/2002GL015609, 2002.

J ¨ager, H. and Deshler, T.: Correction to “Lidar backscatter to extinction, mass and area con-versions for stratospheric aerosols based on midlatitude balloonborne size distribution mea-10

surements”, Geophys. Res. Lett., 30, 1382, doi:10.1029/2003GL017189, 2003.

J ¨ager, H., Uchino, O., Nagai, T., Fujimoto, T. Freudenthaler, V., and Homburg, F.: Ground-based remote sensing of the decay of the Pinatubo eruption cloud at three Northern Hemisphere sites Geophys. Res. Lett, 22, 607–610, doi:10.1029/95GL00054, 1995.

Kalnay, E., Kanamitsu, M., Kistler, R., Collins, W., Deaven, D., Gandin, L., Iredell, M., Saha, S., 15

White, G., Woollen, J., Zhu, Y., Chelliah, M., Ebisuzaki, W., Higgins, W., Janowiak, J., Mo, K. C., Ropelewski, C., Wang, J., Leetmaa, A., Reynolds, R., Jenne, R., and Joseph, D.: The NCEP/NCAR 40-year reanalysis project, B. Amer. Meteor. Soc., 77, 437–471, 1996. Kawamata, M., Yamada, S., Kudoh, T., and Takano, K.: Atmospheric temperature variation after

the 1991 Mt. Pinatubo eruption, J. Meteor. Soc. Jpn., 70, 1161–1166, 1992. 20

Kodera, K.: Influence of volcanic eruptions on the troposphere through stratospheric dy-namical processes in the Northern Hemisphere winter, J. Geophys. Res., 99, 1273–1282, doi:10.1029/93JD02731, 1994.

Kondo, Y., Zhao, Y., Uchino, O., Nagai, T., Fujimoto, T., Itabe, T., Mizutani, K., and Shibata, T.: Stratospheric ozone changes at 43◦ N and 36◦N over Japan between 1991 and 1994, Geo-25

phys. Res. Lett., 22, 3223–3226, doi:10.1029/95GL03180, 1995.

Kravitz, B., Robock, A., Bourassa, A., Deshler, T., Wu, D., Mattis, I., Finger, F., Hoffmann, A., Ritter, C., Bitar, L., Duck, T. J., and Barnes, J. E.: Simulation and observations of strato-spheric aerosols from the 2009 Sarychev volcanic eruption,J. Geophys. Res., 116, D18211, doi:10.1029/2010JD015501, 2011.

30

(15)

ACPD

12, 22757–22781, 2012

On recent stratospheric aerosols observed by

lidar over Japan

O. Uchino et al.

Title Page

Abstract Introduction

Conclusions References

Tables Figures

◭ ◮

◭ ◮

Back Close

Full Screen / Esc

Printer-friendly Version Interactive Discussion

Discussion

P

a

per

|

Dis

cussion

P

a

per

|

Discussion

P

a

per

|

Discussio

n

P

a

per

Preliminary validation of column-averaged volume mixing ratios of carbon dioxide and methane retrieved from GOSAT short-wavelength infrared spectra, Atmos. Meas. Tech., 4, 1061–1076, doi:10.5194/amt-4-1061-2011, 2011.

Nagai, T., Uchino, O., Fujimoto, T., Sai, Y., Tamashiro, K., Nomura, R., and Sunagawa, T.: Lidar observation of the stratospheric aerosol layer over Okinawa, Japan, after the Mt. Pinatubo 5

volcanic eruption, J. Meteor. Soc. Jpn., 71, 749–755, 1993.

Nagai, T., Liley, B., Sakai, T., Shibata, T., and Uchino, O.: Post-Pinatubo evolution and subse-quent trend of the stratospheric aerosol layer observed by mid-latitude lidars in both hemi-spheres, SOLA, 6, 69–72, doi:10.2151/sola.2010-018, 2010.

NASA: Earth Observatory, available at: http://earthobservatory.nasa.gov/NaturalHazards, last 10

access: July 2012.

NOAA: The NOAA Annual Greenhouse Gas Index (AGGI), available at: http://www.esrl.noaa. gov/gmd/aggi/, last access: July 2012.

O’Neil, N. T., Perro, C., Saha, A., Lesins, G., Duck, T. J., Eloranta, E. W., Nott, G. J., Hoff -man, A., Karumudi, M. L., Ritter, C., Bourassa, A., Abboud, I., Carn, S. A., and Savastiouk, V.: 15

Properties of Sarychev sulphate aerosols over the Arctic, J. Geophys. Res., 117, D04203, doi:10.1029/2011JD016838, 2012.

Ota, Y., Yoshida, Y., and Yokota, T.: Study of retrieving column amount of carbon dioxide from satellite-based near-infrared observation of solar scattered light in clear sky condition – error estimation and optimization of vertical pressure grid, J. Remote Sens. Soc. Jpn., 28, 152– 20

160, 2008 (in Japanese).

Rayner, P. J. and O’Brien, D. M.: The utility of remotely sensed CO2 concentration data in surface source inversions, Geophys. Res. Lett., 28, 175–178, doi:10.1029/2000GL011912, 2001.

Read, W. G., Froidevaux, L., and Waters, J. W.: Microwave limb sounder measurement of 25

stratospheric SO2 from the Mt. Pinatubo Volcano, Geophys. Res. Lett., 20, 1299–1302, doi:10.1029/93GL00831, 1993.

Robock, A. and Mao, J.: The volcanic signal in surface temperature observations, J. Clim., 8, 1086–1103, 1995.

Sakai, T., Nagai, T., Nakazato, M., Mano, Y., and Matsumura, T.: Ice clouds and Asian 30

(16)

ACPD

12, 22757–22781, 2012

On recent stratospheric aerosols observed by

lidar over Japan

O. Uchino et al.

Title Page

Abstract Introduction

Conclusions References

Tables Figures

◭ ◮

◭ ◮

Back Close

Full Screen / Esc

Printer-friendly Version Interactive Discussion

Discussion

P

a

per

|

Dis

cussion

P

a

per

|

Discussion

P

a

per

|

Discussio

n

P

a

per

|

Sakashita, T., Suzuki, K., Adachi, K., and Kikuchi, Y.: Stratospheric aerosols of volcanic ori-gin observed over the Atmospheric Environment Observatory, Tenki, 56, 549–553, 2009 (in Japanese).

Smithsonian Institution: Global Volcanism Program, available at: http://www.volcano.si.edu/ world/volcano.cfm, last access: July 2012.

5

Solomon, S., Portmann, R. W., Garcia, R. R., Thomason, L. W., Poole, L. R., and Mc-Cormick, M. P.: The role of aerosol variations in anthropogenic ozone depletion at northern midlatitudes, J. Geophys. Res., 101, 6713–6727, doi:10.1029/95JD03353, 1996.

Solomon, S., Daniel, J. S., Neely III, R. R., Vernier, J.-P., Dutton, E. G., Thomason, L. W.: The persistently variable “background” stratospheric aerosol layer and global climate change, 10

Science, 333, 866–870, doi:10.1126/science.1206027, 2011.

Stenchikov, G., Delworth, T. L., Ramaswamy, V., Stouffer, R. J., Wittenberg, A., and Zeng, F.: Volcanic signals in oceans, J. Geophys. Res., 114, D16104, doi:10.1029/2008JD011673, 2009.

Takagi, H., Saeki, T., Oda, T., Saito, M., Valsala, V., Belikov, D., Saito, R., Yoshida, Y., Morino, I., 15

Uchino, O., Andres, R. J., Yokota, T., and Maksyutov, S.: On the benefit of GOSAT observa-tions to the estimation of regional CO2fluxes, SOLA, 161–164, doi:10.2151/sola.2011-041, 2011.

Uchino, O.: Scientific results of the EPIC projects, in: The Mount Pinatubo Eruption Effects on the Atmosphere and Climate, NATO ASI Ser., vol. I 42, edited by: Fiocco, G., Fua, D., and 20

Visconti, G., Springer-Verlag, Berlin Heidelberg, 127–139, 1996.

Uchino, O., Nagai, T., Fujimoto, T., Matthews, W. A., and Orange, J.: Extensive lidar observa-tions of the Pinatubo aerosol layers at Tsukuba (36.1◦N), Naha (26.2N), Japan and Lauder

(45.0◦S), New Zealand, Geophys. Res. Lett., 22, 57–60, doi:10.1029/94GL02735, 1995 Uchino, O., Sakai, T., Nagai, T., Sakashita, T., Suzuki, K., Shibata, T., Morino, I., and Yokota, T.: 25

Lidar observation of stratospheric aerosols increased from the 2009 Mount Sarychev vol-canic eruption, J. Remote Sens. Soc. Jpn., 30, 149–156, 2010 (in Japanese).

Uchino, O., Kikuchi, N., Sakai, T., Morino, I., Yoshida, Y., Nagai, T., Shimizu, A., Shibata, T., Yamazaki, A., Uchiyama, A., Kikuchi, N., Oshchepkov, S., Bril, A., and Yokota, T.: Influence of aerosols and thin cirrus clouds on the GOSAT-observed CO2: a case study over Tsukuba, 30

Atmos. Chem. Phys., 12, 3393–3404, doi:10.5194/acp-12-3393-2012, 2012.

(17)

ACPD

12, 22757–22781, 2012

On recent stratospheric aerosols observed by

lidar over Japan

O. Uchino et al.

Title Page

Abstract Introduction

Conclusions References

Tables Figures

◭ ◮

◭ ◮

Back Close

Full Screen / Esc

Printer-friendly Version Interactive Discussion

Discussion

P

a

per

|

Dis

cussion

P

a

per

|

Discussion

P

a

per

|

Discussio

n

P

a

per

Vernier, J.-P., Thomason, L. W., Pommereau, J.-P., Bourassa, A., Pelon, J., Garnier, A., Hauchecorne, A., Blanot, L., Trepte, C., Degenstein, D., and Vargas, F.: Major influence of tropical volcanic eruptions on the stratospheric aerosol layer during the last decade, Geo-phys. Res. Lett., 38, L12807, doi:10.1029/2011GL047563, 2011.

WMO: Scientific Assessment of Ozone Depletion: 1994, World Meteorological Organization 5

Global Ozone Research and Monitoring Project – Report No.37, Geneva, 1995.

Wu, P.-M., Okada, K., Tanaka, T., Sasaki, T., Nagai, T., Fujimoto, T., and Uchino, O.: Balloon observation of stratospheric aerosols over Tsukuba, Japan Two years after the Pinatubo volcanic eruption, J. Meteor. Soc. Jpn., 72, 475–480, 1994.

Yoshida, Y., Ota, Y., Eguchi, N., Kikuchi, N., Nobuta, K., Tran, H., Morino, I., and Yokota, T.: 10

(18)

ACPD

12, 22757–22781, 2012

On recent stratospheric aerosols observed by

lidar over Japan

O. Uchino et al.

Title Page

Abstract Introduction

Conclusions References

Tables Figures

◭ ◮

◭ ◮

Back Close

Full Screen / Esc

Printer-friendly Version Interactive Discussion

Discussion

P

a

per

|

Dis

cussion

P

a

per

|

Discussion

P

a

per

|

Discussio

n

P

a

per

|

Table 1.Characteristics of two-wavelength polarization lidar systems at Tsukuba and Saga.

Station Tsukuba Saga

Transmitter

Laser Nd:YAG Nd:YAG

Wavelength 532 nm 1064 nm 532 nm 1064 nm

Pulse energy 140 mJ 230 mJ 130 mJ 130 mJ

Pulse repetition 20 Hz 10 Hz

Beam divergence 0.2 mrad 0.2 mrad 0.2 mrad 0.2 mrad

Receiver

Telescope type Schmidt Cassegrain Schmidt Cassegrain

Telescope 35.5 cm (Far) 30.5 cm

Diameter 20.0 cm (Near)

Field of view 1.0 mrad 1.0 mrad

Polarization P and S None P and S None

Number of 5 2 3 1

channels

Vertical resolution 7.5 m (minimum) 7.5 m (minimum)

Detectors PMT APD PMT APD

(19)

ACPD

12, 22757–22781, 2012

On recent stratospheric aerosols observed by

lidar over Japan

O. Uchino et al.

Title Page

Abstract Introduction

Conclusions References

Tables Figures

◭ ◮

◭ ◮

Back Close

Full Screen / Esc

Printer-friendly Version Interactive Discussion

Discussion

P

a

per

|

Dis

cussion

P

a

per

|

Discussion

P

a

per

|

Discussio

n

P

a

per

10 15 20 25

0 1 2 3 4 5 6 7 8 9 10

R, δ (%)

A

lt

it

ude (

k

m

)

R Dep.

10 Jul Tsukuba

17 Aug 12 Sep 7 Oct 12 Nov 24 Dec 24 Jan

1 2 1 2 1 2 1 2 1 2 20 Jun

13 Jun

δ

2011 2012

10 15 20 25

0 1 2 3 4 5 6 7 8 9 10

R, δ (%)

A

lt

it

ude (

k

m

)

R Dep.

29 Jul Saga

29 Aug 24 Sep 20 Oct 24 Nov 14 Dec 31 Jan

1 2 1 2 1 2 1 2 1 2 23 Jun

14 Jun

δ

2011 2012

(20)

ACPD

12, 22757–22781, 2012

On recent stratospheric aerosols observed by

lidar over Japan

O. Uchino et al.

Title Page

Abstract Introduction

Conclusions References

Tables Figures

◭ ◮

◭ ◮

Back Close

Full Screen / Esc

Printer-friendly Version Interactive Discussion

Discussion

P

a

per

|

Dis

cussion

P

a

per

|

Discussion

P

a

per

|

Discussio

n

P

a

per

|

(21)

ACPD

12, 22757–22781, 2012

On recent stratospheric aerosols observed by

lidar over Japan

O. Uchino et al.

Title Page

Abstract Introduction

Conclusions References

Tables Figures

◭ ◮

◭ ◮

Back Close

Full Screen / Esc

Printer-friendly Version Interactive Discussion

Discussion

P

a

per

|

Dis

cussion

P

a

per

|

Discussion

P

a

per

|

Discussio

n

P

a

per

Fig. 3.Monthly means of geopotential height (m) and wind (m s−1

(22)

ACPD

12, 22757–22781, 2012

On recent stratospheric aerosols observed by

lidar over Japan

O. Uchino et al.

Title Page

Abstract Introduction

Conclusions References

Tables Figures

◭ ◮

◭ ◮

Back Close

Full Screen / Esc

Printer-friendly Version Interactive Discussion

Discussion

P

a

per

|

Dis

cussion

P

a

per

|

Discussion

P

a

per

|

Discussio

n

P

a

per

|

Apr1 Jan1

Oct1 Jul1

0 0.0005 0.001

5 10 15 20

H

ei

ght

(k

m

)

IBC

Tropopause Height

Tsukuba

2011 2012 10

5

0

IBC

(1

0

-4

sr

-1 )

Apr1 Jan1

Oct1 Jul1

0 0.0005 0.001

5 10 15 20

H

ei

ght

(k

m

)

IBC

Tropopause Height

Saga

2011 2012 10

5

0

IBC

(1

0

-4

sr

-1 )

(23)

ACPD

12, 22757–22781, 2012

On recent stratospheric aerosols observed by

lidar over Japan

O. Uchino et al.

Title Page

Abstract Introduction

Conclusions References

Tables Figures

◭ ◮

◭ ◮

Back Close

Full Screen / Esc

Printer-friendly Version Interactive Discussion

Discussion

P

a

per

|

Dis

cussion

P

a

per

|

Discussion

P

a

per

|

Discussio

n

P

a

per

10 15 20 25

0 1 2 3 4 5 6 7 8 9 10

R, δ (%)

A

lt

it

ude (

k

m

)

R Dep.

10 Sep

Tsukuba

16 Sep 4 Oct 21 Oct 20 Nov 20 Dec 19 Jan

1 2 1 2 1 2 1 2 1 2 2 Sep

27 Aug

δ

2008 2009

(24)

ACPD

12, 22757–22781, 2012

On recent stratospheric aerosols observed by

lidar over Japan

O. Uchino et al.

Title Page

Abstract Introduction

Conclusions References

Tables Figures

◭ ◮

◭ ◮

Back Close

Full Screen / Esc

Printer-friendly Version Interactive Discussion

Discussion

P

a

per

|

Dis

cussion

P

a

per

|

Discussion

P

a

per

|

Discussio

n

P

a

per

|

10 15 20 25

0 1 2 3 4 5 6 7 8 9 10

R, δ (%)

A

lt

it

ude (

k

m

)

R Dep.

5 Jul

Tsukuba

25 Jul 26 Aug 24 Sep 28 Oct 26 Nov 26 Dec

1 2 1 2 1 2 1 2 1 2 25 Jun

12 Jun

δ 2009

(25)

ACPD

12, 22757–22781, 2012

On recent stratospheric aerosols observed by

lidar over Japan

O. Uchino et al.

Title Page

Abstract Introduction

Conclusions References

Tables Figures

◭ ◮

◭ ◮

Back Close

Full Screen / Esc

Printer-friendly Version Interactive Discussion

Discussion

P

a

per

|

Dis

cussion

P

a

per

|

Discussion

P

a

per

|

Discussio

n

P

a

per

0 0.0005 0.001

Tsukuba background 系

2008 2009 2010 2011 2012 Jan Jan Jan Jan Jan

Nabro Merapi

Sarychev Kasatochi

10

5

0

IBC

(1

0

-4

sr

-1)

Imagem

Table 1. Characteristics of two-wavelength polarization lidar systems at Tsukuba and Saga.
Fig. 1. Vertical profiles of the backscattering ratio R (pink line) and total depolarization ratio δ (%) (blue line) at λ 2 = 532 nm over Tsukuba (upper panel) and Saga (lower panel) from June 2011 through January 2012
Fig. 2. Horizontal (upper panel) and vertical (lower panel) projections of isentropic forward trajectories of air parcels initially at an altitude of 17 km over Mt
Fig. 3. Monthly means of geopotential height (m) and wind (m s −1 ) on 100 hPa in June 2011 calculated from NCEP/NCAR reanalysis data
+5

Referências

Documentos relacionados

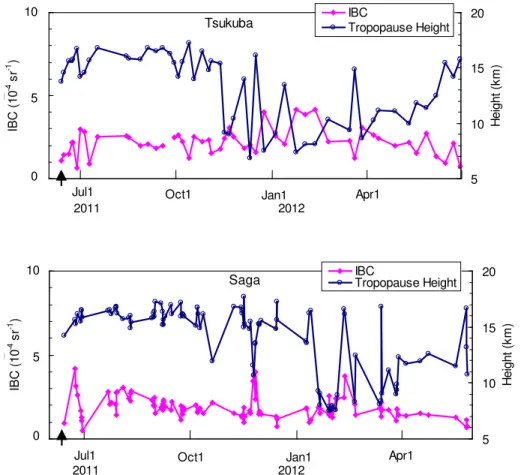
tropopause pressures (black crosses) are spread over the re- gion within about one half of an e-fold of the monthly me- dian tropopause pressure. Figure 9b shows the same pro- files

The credentials of the representatives, alternates, and advisers of the following countries were examined and declared accepted:. Argentina Bolivia Brazil

Director of Public Health Ministry of Labor, Social Welfare and Public Health.

The probability of attending school four our group of interest in this region increased by 6.5 percentage points after the expansion of the Bolsa Família program in 2007 and

Bolm Inst.. Amazon and Pará rivers. The oceanographic conditions of the area concerning the continental shelf are strong- ly influenced by the presence of n large

Este tipo de análise aplicada ao contexto do cálculo dos índices de perigo de incêndio florestal permite, depois de identificadas as variáveis associadas à

Como deveres, cabem-lhe os de esclarecer as partes acerca da natureza, finalidades, princípios fundamentais e fase de procedi- mento de mediação e regras a adoptar, abster-se de

2.1 e ffi ciently de- termines the sensitivity of the CDNC with respect to each input parameter (updraft velocity, uptake coe ffi cient, aerosol number, hygroscopicity of