ACPD
12, 12081–12117, 2012Adjoint sensitivity of CDNC
V. A. Karydis et al.
Title Page
Abstract Introduction
Conclusions References
Tables Figures
◭ ◮
◭ ◮
Back Close
Full Screen / Esc
Printer-friendly Version Interactive Discussion
Discussion
P
a
per
|
Dis
cussion
P
a
per
|
Discussion
P
a
per
|
Discussio
n
P
a
per
|
Atmos. Chem. Phys. Discuss., 12, 12081–12117, 2012 www.atmos-chem-phys-discuss.net/12/12081/2012/ doi:10.5194/acpd-12-12081-2012
© Author(s) 2012. CC Attribution 3.0 License.
Atmospheric Chemistry and Physics Discussions
This discussion paper is/has been under review for the journal Atmospheric Chemistry and Physics (ACP). Please refer to the corresponding final paper in ACP if available.
Adjoint sensitivity of global cloud droplet
number to aerosol and dynamical
parameters
V. A. Karydis1, S. L. Capps2, A. G. Russell3, and A. Nenes1,2
1
School of Earth and Atmospheric Sciences, Georgia Institute of Technology, Atlanta, GA, USA
2
School of Chemical and Biomolecular Engineering, Georgia Institute of Technology, Atlanta, GA, USA
3
School of Civil and Environmental Engineering, Georgia Institute of Technology, Atlanta, GA, USA
Received: 11 April 2012 – Accepted: 23 April 2012 – Published: 10 May 2012
Correspondence to: A. Nenes ([email protected])
ACPD
12, 12081–12117, 2012Adjoint sensitivity of CDNC
V. A. Karydis et al.
Title Page
Abstract Introduction
Conclusions References
Tables Figures
◭ ◮
◭ ◮
Back Close
Full Screen / Esc
Printer-friendly Version Interactive Discussion
Discussion
P
a
per
|
Dis
cussion
P
a
per
|
Discussion
P
a
per
|
Discussio
n
P
a
per
|
Abstract
We present the development of the adjoint of a comprehensive cloud droplet formation parameterization for use in aerosol-cloud-climate interaction studies. The adjoint effi -ciently and accurately calculates the sensitivity of cloud droplet number concentration (CDNC) to all parameterization inputs (e.g., updraft velocity, water uptake coefficient,
5
aerosol number and hygroscopicity) with a single execution. The droplet adjoint is then integrated within three dimensional (3-D) aerosol modeling frameworks to quantify the sensitivity of CDNC formation globally to each parameter. Sensitivities are computed for year-long executions of the NASA Global Modeling Initiative (GMI) Chemical Trans-port Model (CTM), using wind fields computed with the Goddard Institute for Space
10
Studies (GISS) Global Circulation Model (GCM) II′, and the GEOS-Chem CTM, driven by meteorological input from the Goddard Earth Observing System (GEOS) of the NASA Global Modeling and Assimilation Office (GMAO). We find that over polluted (pristine) areas, CDNC is more sensitive to updraft velocity and uptake coefficient (aerosol number and hygroscopicity). Over the oceans of the Northern Hemisphere,
15
addition of anthropogenic or biomass burning aerosol increases predicted CDNC in contrast to coarse-mode sea salt which tends to decrease CDNC. Over the Southern Oceans, CDNC is most sensitive to sea salt, which is the main aerosol component in the area. Globally, CDNC is predicted to be less sensitive to changes in the hygro-scopicity of the aerosols than in their concentration with the exception of dust where
20
CDNC is very sensitive to particle hydrophilicity over arid areas. Regionally, the sen-sitivities differ considerably between the two frameworks and quantitatively reveal why the models differ considerably in their indirect forcing estimates.
1 Introduction
As cloud condensation nuclei (CCN), aerosols modulate the radiative properties of
25
ACPD
12, 12081–12117, 2012Adjoint sensitivity of CDNC
V. A. Karydis et al.
Title Page
Abstract Introduction
Conclusions References
Tables Figures
◭ ◮
◭ ◮
Back Close
Full Screen / Esc
Printer-friendly Version Interactive Discussion
Discussion
P
a
per
|
Dis
cussion
P
a
per
|
Discussion
P
a
per
|
Discussio
n
P
a
per
|
climate models (GCMs), the aerosol-cloud link is modeled by direct application of a cloud droplet formation parameterization (Boucher and Lohmann, 1995; Abdul-Razzak and Ghan, 2000; Nenes and Seinfeld, 2003; Segal and Khain, 2006), or using the latter within a two moment framework (Seifert and Beheng, 2006; Morrison and Gettelman, 2008).
5
The calculation of climate sensitivity to model parameters is at the heart of any climate impact assessment study. It is almost exclusively evaluated by “brute force methods”, in which relevant parameters are independently perturbed and the model response is quantified in a separate simulation. For aerosol-cloud-climate interaction studies, parameters related to aerosol emissions, hygroscopicity and dynamical
forc-10
ing at cloud base are most often perturbed. For example, Spracklen et al. (2005), by using the global aerosol microphysics model GLOMAP and individually perturbing the process parameters, conclude that uncertainties in microphysical processes have a larger effect on global sulfate and sea salt derived condensation nuclei (CN) and CCN concentrations than uncertainties in present-day sulfur emissions. Sotiropoulou
15
et al. (2006, 2007) used the GISS GCM Model II′ with an explicit treatment of aerosol-cloud interactions to estimate the sensitivity of CDNC to CCN number, and quantify the uncertainty in shortwave cloud radiative forcing and autoconversion rate associated with the application of K ¨ohler theory. Their study suggested that this error is not signif-icant compared to errors in the size distribution or subgrid cloud dynamics. Korhoren
20
et al. (2010), using GLOMAP, studied the sensitivity of CDNC, aerosol size distribution, and natural aerosol processes to sea salt emission increases. Woodhouse et al. (2010) used GLOMAP to calculate the sensitivity of CCN to changes in dimethyl-sulfide (DMS) emission using multiple present-day and future sea-surface DMS climatologies. Bara-hona et al. (2011) used the NASA GMI model to calculate the relative change of CDNC
25
ACPD
12, 12081–12117, 2012Adjoint sensitivity of CDNC
V. A. Karydis et al.
Title Page
Abstract Introduction
Conclusions References
Tables Figures
◭ ◮
◭ ◮
Back Close
Full Screen / Esc
Printer-friendly Version Interactive Discussion
Discussion
P
a
per
|
Dis
cussion
P
a
per
|
Discussion
P
a
per
|
Discussio
n
P
a
per
|
cloud optical depth, liquid cloud fraction, and CDNC from satellite retrievals and com-pared the derived sensitivity to a corresponding estimate from the Norwegian Earth System Model (NorESM).
Brute force is often used to compute sensitivities in process-focused studies. For ex-ample, Ervens et al. (2007) used the dataset acquired during the ICARTT field study
5
to determine that the measured aerosol size distribution is the most important factor for achieving CCN closure. A simple representation of aerosol composition (soluble fraction) was sufficient for closure, especially at high supersaturations. In order to es-timate the effect of the organic fraction composition and mixing state assumptions on CCN predictions, Ervens et al. (2010) analyzed data from six different locations, which
10
include aerosol size distribution, chemical composition, and CCN observational data. Their results suggested that while fresher pollution aerosol could not be represented without knowledge of more complex composition, CCN derived from aged aerosols could be predicted within a factor of two with any mixing state assumption. According to this study, a factor of two uncertainty in CCN concentration could be translated to an
15
uncertainty of∼15 % in cloud droplet concentration.
The studies presented above are in no way a thorough literature review on aerosol-cloud interactions, but are examples where sensitivity is estimated by applying a finite difference on a function through discrete model evaluation, often with multiple model executions per parameter investigated. To increase efficiency of these investigations
20
and to assess the role of nonlinearity in cloud droplet activation, approaches other than finite differences have been employed in recent years. Anttila and Kerminen (2007) in-vestigated the role of Aitken mode particles in continental convective cloud formation with a probabilistic collocation method, which approximates the function of the param-eterization with polynomials. Haertner et al. (2009) combined single and multiple
pa-25
ACPD
12, 12081–12117, 2012Adjoint sensitivity of CDNC
V. A. Karydis et al.
Title Page
Abstract Introduction
Conclusions References
Tables Figures
◭ ◮
◭ ◮
Back Close
Full Screen / Esc
Printer-friendly Version Interactive Discussion
Discussion
P
a
per
|
Dis
cussion
P
a
per
|
Discussion
P
a
per
|
Discussio
n
P
a
per
|
parameters (e.g., updraft, surface tension) on the cloud droplet number. Most recently, Lee et al. (2011b) developed and used a Gaussian process emulator for the GLOMAP global model to estimate the CCN sensitivity to model parameters (e.g., oxidation ac-tivation parameter, mass accommodation coefficient) in polluted and remote marine environments as a function of altitude.
5
Alternatively, sensitivities can be explicitly calculated. For example, Rissman et al. (2004) used a droplet formation parameterization to derive analytical expressions of the sensitivity of CDNC to aerosol and dynamical parameters. These expressions were then used to compare the sensitivity of droplet number to aerosol chemical com-position, updraft velocity and size distribution parameters. In particular, they
demon-10
strated that the effect of aerosol composition on CDNC can be as much as 1.5 times more important than than the corresponding effect of updraft velocity. Although com-prehensive, this approach requires significant development, and it may not be feasible for more complex process formulations. Alternately, the adjoint technique is an attrac-tive approach for computing sensitivities as it accurately and efficiently quantifies the
15
required perturbations in each control parameter for a requisite change in a calculated quantity in a single execution (Giering, 2000). When applied to a cloud droplet forma-tion parameterizaforma-tion, an adjoint model quantifies the sensitivities of CDNC,Nd, to all
input parameters,I (i.e., ∂Nd
∂I ). The primary challenge to its application remains the
ef-fort required to develop the adjoint, although in many cases automatic differentiation
20
tools can facilitate development of adjoint from existing codes.
The meteorological and oceanographic modeling communities initiated the extension of the adjoint method, originally developed in control theory (Lions, 1971), to geochem-ical applications (Ghil and Malanotterizzoli, 1991). Adjoint techniques are a primary means of estimating model parameters and inputs (e.g., initial conditions) by
assimi-25
ACPD
12, 12081–12117, 2012Adjoint sensitivity of CDNC
V. A. Karydis et al.
Title Page
Abstract Introduction
Conclusions References
Tables Figures
◭ ◮
◭ ◮
Back Close
Full Screen / Esc
Printer-friendly Version Interactive Discussion
Discussion
P
a
per
|
Dis
cussion
P
a
per
|
Discussion
P
a
per
|
Discussio
n
P
a
per
|
0.03 in surface albedo). Investigations of parameter (e.g., emissions rates, rate con-stants) importance have become possible with increased computational resources and development of automatic differentiation tools that facilitate formulation of adjoint mod-els (e.g., TAPENADE; Hasco ¨et, 2004). Sensitivities of gaseous species concentrations have been widely investigated (Menut et al., 2000; Vukicevic and Hess, 2000; Sandu
5
et al., 2005; Hakami et al., 2005; Martien and Harley, 2006) and, more recently, sensitiv-ities of aerosol species concentrations have been probed with this technique (Hakami et al., 2005; Henze et al., 2009; Kopacz et al., 2011; Capps et al., 2012). Adding the sensitivity of cloud droplet formation and propagating aerosol sensitivities thereon con-siderably augment the capabilities of these adjoint model frameworks and, if included
10
in coupled climate models, could offer a unique insight into what drives CDNC and indirect forcing variability.
Here we present the development of the adjoint of the Kumar et al. (2009) cloud droplet formation parameterization. We then demonstrate its capabilities by integrating it within the NASA Global Modeling Initiative (GMI) and GEOS-Chem 3-D CTMs. The
15
augmented CTMs are then used to compute the global sensitivity field of CDNC to updraft velocity, uptake coefficient, hygroscopicity of soluble particles, adsorption pa-rameters of insoluble particles, and aerosol concentration. The sensitivities are then used to explain sources and differences of CDNC predictions and indirect forcing as-sessments.
20
2 Development of the cloud droplet formation parameterization adjoint
2.1 The cloud droplet formation parameterization
The calculation of CDNC is carried out in two conceptual steps (Fig. 1). The first step involves the determination of the “CCN spectrum”,Fs(s), which is the number of CCN that can activate to form droplets at a certain level of supersaturations. The second step
25
ACPD
12, 12081–12117, 2012Adjoint sensitivity of CDNC
V. A. Karydis et al.
Title Page
Abstract Introduction
Conclusions References
Tables Figures
◭ ◮
◭ ◮
Back Close
Full Screen / Esc
Printer-friendly Version Interactive Discussion
Discussion
P
a
per
|
Dis
cussion
P
a
per
|
Discussion
P
a
per
|
Discussio
n
P
a
per
|
cloudy parcels so that the droplet number that forms is equal toFs(smax).F
s
(s) is com-puted based on Kumar et al. (2009) in which soluble particles are described by K ¨ohler theory, where CCN activity is determined solely by the amount of solute present. In-soluble particles also contribute CCN; their activity is determined by the amount of adsorbed water on the insoluble surface of the particles and the vapor pressure
de-5
pression from any soluble salts present (Kumar et al., 2011a,b).Fs(s) for an external mixture of lognormal particle size distributions is given by:
Fs(s)=
s Z
0
ns(s)ds= nm
X
i=1 Ni
2 erfc
−
lnsg,i
s
x√2 ln (σi)
(1)
wheresg,i is the critical supersaturation of the particle with a diameter equal to the
ge-ometric mean diameter of the modei,σi is the geometric standard deviation for mode
10
i, andx is an exponent that expresses the aerosol-water vapor interactions. In partic-ular, for hygroscopic aerosols, following K ¨ohler theory,x=−32(Fountoukis and Nenes, 2005), while in adsorption theory based on the Frenkel-Halsey-Hill (FHH) isotherm,x varies between−0.8 and −1.2 and depends on the adsorption parameters, AFHHand BFHH(Kumar et al., 2009, 2011a). Kumar et al. (2011b) also extended the FHH
frame-15
work to include a soluble fraction (to represent aged dust), so thatx also depends on the soluble fraction.
The maximum supersaturation, smax is calculated from an equation that expresses the supersaturation tendency in the ascending cloudy air parcels (Nenes and Seinfeld, 2003; Barahona and Nenes, 2007),
20
2aV πγρw
−GsmaxI(0,smax)=0 (2)
ACPD
12, 12081–12117, 2012Adjoint sensitivity of CDNC
V. A. Karydis et al.
Title Page
Abstract Introduction
Conclusions References
Tables Figures
◭ ◮
◭ ◮
Back Close
Full Screen / Esc
Printer-friendly Version Interactive Discussion
Discussion
P
a
per
|
Dis
cussion
P
a
per
|
Discussion
P
a
per
|
Discussio
n
P
a
per
|
integral” (Barahona et al., 2010; Barahona and Nenes, 2007; Kumar et al., 2009), and it expresses the condensational depletion of supersaturation upon the growing droplets at the point ofsmaxin the cloud updraft. Equation (2) is solved numerically. Once smax is determined, the CDNC is just the value of the CCN spectrum atsmax(Nd=F(smax)) from Eq. (1).
5
2.2 Development of the adjoint
The adjoint model corresponding to the parameterization of Sect. 2.1 efficiently de-termines the sensitivity of the CDNC with respect to each input parameter (updraft velocity, uptake coefficient, aerosol number, hygroscopicity of soluble aerosol species, adsorption parameters of insoluble aerosols) (Fig. 1). The adjoint is developed
assum-10
ing the hydrophilicity of insoluble particles is driven solely by the adsorption parameters (leaving variations in the dust soluble fraction as presented by Kumar et al. (2011b) for a future study). One call of the adjoint requires forward model execution (Fig. 1, green and blue arrows) followed by reverse calculation of the same functions and the asso-ciated derivative calculations (Fig. 1, red elements). Thus, a single execution of the
15
parameterization adjoint calculates this array of sensitivities by propagating an adjoint forcing through a reverse execution of the derivatives of the model equations. Gener-ally, the code is augmented for each elementary calculation in the model by applying the chain rule of derivative calculus with the automatic differentiation tool TAPENADE (Hasco ¨et, 2004).
20
The approach outlined above applies only to code with explicit functional depen-dence of results on intermediate or input parameters. Since the calculation of the maximum supersaturation, smax, requires the implicit bisection method, direct calcu-lation of sensitivities is precluded. Capps et al. (2012) also encountered this issue when developing the adjoint of the ISORROPIA thermodynamics code and addressed
25
ACPD
12, 12081–12117, 2012Adjoint sensitivity of CDNC
V. A. Karydis et al.
Title Page
Abstract Introduction
Conclusions References
Tables Figures
◭ ◮
◭ ◮
Back Close
Full Screen / Esc
Printer-friendly Version Interactive Discussion
Discussion
P
a
per
|
Dis
cussion
P
a
per
|
Discussion
P
a
per
|
Discussio
n
P
a
per
|
model of the maximum supersaturation calculation. This code is then used to calcu-late the derivative of the objective function of the bisection method with respect to the converged root value. With this sensitivity, a single N-R step is taken after bisection con-vergence in the forward model calculation. The reverse execution of the adjoint model propagates derivatives only through the N-R step (not bisection) and then through the
5
derivatives of the CCN spectrum computation (Fig. 1, red elements). Thereby, after calculation of the forward model at the specified parameter values, the derivative of CDNC with respect to each intermediate variable in the code is computed and passed through the augmented code in reverse order. The result is the efficient, simultaneous calculation of the adjoint sensitivities of CDNC with respect to the parameterization
10
inputs.
2.3 Evaluation of droplet parameterization adjoint
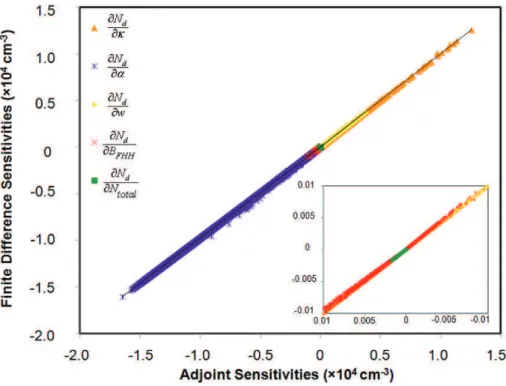
The accuracy of the adjoint model is extensively verified against forward model sensitiv-ities (Fig. 2) calculated using central finite differences (brute force). The finite difference calculation requires an additional forward model evaluation per input parameter, using
15
a 1 % relative perturbation in each input parameter. To cover a wide range of conditions, monthly averaged aerosol concentrations (spanning one year) from every grid cell of the GMI model (Sect. 3.1) is used as input to the adjoint of the cloud droplet formation parameterization. In addition, ten different updraft velocities were used ranging from 0.1 m s−1to 5 m s−1, five uptake coefficients ranging from 0.06 to 1, and threeAFHHand
20
ACPD
12, 12081–12117, 2012Adjoint sensitivity of CDNC
V. A. Karydis et al.
Title Page
Abstract Introduction
Conclusions References
Tables Figures
◭ ◮
◭ ◮
Back Close
Full Screen / Esc
Printer-friendly Version Interactive Discussion
Discussion
P
a
per
|
Dis
cussion
P
a
per
|
Discussion
P
a
per
|
Discussio
n
P
a
per
|
3 Application of droplet adjoint in three dimensional model frameworks
3.1 The NASA Global Modeling Initiative (GMI)
The GMI 3-D global CTM (http://gmi.gsfc.nasa.gov) was originally described by Rot-man (2001) and Considine et al. (2005). The aerosol module used in this study includes primary emissions, gas phase and aqueous phase chemistry with one hour time step,
5
wet and dry deposition, hygroscopic growth, and was provided by Liu et al. (2005). The horizontal resolution is 4◦×5◦ latitude by longitude and the vertical resolution has 23 layers and a model top at 0.1 hPa. The model time step for chemistry is one hour. Winds, temperatures, and other meteorological quantities used in this work are taken from the GISS GCM II′. Emissions are provided by Liu et al. (2005) and include SO2,
10
DMS, H2O2, black carbon, organic carbon, mineral dust, and sea salt.
Monthly averaged mass concentrations of aerosols are computed from GMI and are given as an input to the cloud droplet formation parameterization. Aerosols are dis-tributed in four modes: sulfate, organic mass and black carbon from fossil fuel combus-tion; organic mass and black carbon from biomass burning; sulfate and sea salt from
15
marine processes; and mineral dust. Aerosols from the first three modes are assumed to follow K ¨ohler theory for CCN activation whereas mineral dust is assumed to be in-soluble and to follow FHH adsorption theory. Particles within each mode are modeled as internally mixed and follow a prescribed in-cloud number size distribution following the approach of Karydis et al. (2011) (Table 1).
20
Other important parameters for CDNC calculations include an effective water vapor uptake coefficient of 0.06 (Fountoukis et al., 2007) and FHH adsorption parameters, AFHH=2.25 and BFHH=1.2 (Kumar et al., 2011a; Karydis et al., 2011). Additionally, the updraft velocities are representative of typical stratocumulus clouds and are con-strained using observations, V =0.3 m s−1 over land, and V =0.15 m s−1 over ocean
25
ACPD
12, 12081–12117, 2012Adjoint sensitivity of CDNC
V. A. Karydis et al.
Title Page
Abstract Introduction
Conclusions References
Tables Figures
◭ ◮
◭ ◮
Back Close
Full Screen / Esc
Printer-friendly Version Interactive Discussion
Discussion
P
a
per
|
Dis
cussion
P
a
per
|
Discussion
P
a
per
|
Discussio
n
P
a
per
|
they found that the model is in reasonably good agreement with observations in most of the cases.
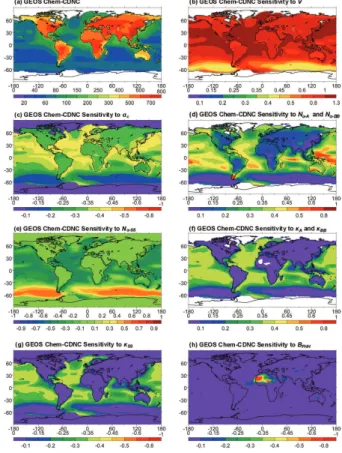
3.2 GEOS-Chem
The GEOS-Chem 3-D global CTM (v9-01-01; http://geos-chem.org) documented first in Bey et al. (2001) and Park et al. (2004), is driven by the NASA GMAO
GEOS-5
5 GCM. The model was executed for December 2006 to December 2008, with the first year considered to be model spin-up. The temporal resolution of GEOS-5 is 6 h or 3 h for surface variables and mixing depths; the data are aggregated from 0.5◦ by 0.67◦ horizontal resolution to 2◦ by 2.5◦, and in vertical resolution from 72 to 47 hybrid pressure-sigma levels from the surface to 0.01 hPa (Bey et al., 2001).
10
The model simulates tropospheric ozone-NOx-hydrocarbon-aerosol chemistry as de-scribed by Zhang et al. (2011). The sulfate-nitrate-ammonium aerosol system interacts with the gas phase according to equilibrium thermodynamics (Park et al., 2004; Pye et al., 2009) calculated with ISORROPIA II (Fountoukis et al., 2007). The rate of in-cloud production of sulfate is in accordance with the liquid water content given by
15
GEOS-5 for each grid cell as recently described by Fisher et al. (2011). Other inorganic aerosol species represented are accumulation and coarse mode sea salt (Alexander et al., 2005) and four classes of dust aerosol (Fairlie et al., 2007). Nitrate and sul-fate can accumulate on sea salt aerosol. Organic aerosol (OC) and elemental carbon (EC) are represented as either hydrophobic or hydrophilic; hydrophobic carbonaceous
20
aerosol shift to hydrophilic (1.2 day e-folding time) (Park et al., 2003).
Emissions of aerosol-related species are compiled from a variety of inventories. An-thropogenic emissions of CO, NOx, and SO2 are defined by the EDGAR 3.2 monthly global inventory for 2000 (Olivier and Berdowski, 2001), which are scaled to mod-eled years according to economic data (van Donkelaar et al., 2008) or superseded
25
ACPD
12, 12081–12117, 2012Adjoint sensitivity of CDNC
V. A. Karydis et al.
Title Page
Abstract Introduction
Conclusions References
Tables Figures
◭ ◮
◭ ◮
Back Close
Full Screen / Esc
Printer-friendly Version Interactive Discussion
Discussion
P
a
per
|
Dis
cussion
P
a
per
|
Discussion
P
a
per
|
Discussio
n
P
a
per
|
implemented by Leibensperger et al. (2011). Global shipping emissions are from ICOADS, which were implemented by Lee et al. (2011a). Natural emissions include open biomass burning from GFED2 (van der Werf et al., 2009); biogenic soil NOx emissions of Yienger and Levy (1995); eruptive and non-eruptive volcanic SO2 emis-sions developed by T. Diehl (http://aerocom.met.no/data.html) and implemented in
5
GEOS-Chem by Fisher et al. (2011); and lightning NOx in accordance with Price and Rind (1992).
Deposition processes govern the removal of aerosol and related gases. Water-soluble gases and aerosols undergo wet deposition as described by Mari et al. (2000) and Liu et al. (2001), respectively. Recently, corrections were implemented to improve
10
washout for highly soluble gases other than HNO3 (Amos et al., 2012) and to allow washout and rainout in the same grid box (Wang et al., 2004). The resistance-in-series scheme of Wesely (1989), implemented by Wang et al. (1998), describes dry deposi-tion.
Monthly-averaged mass concentrations of aerosols are computed from GEOS-Chem
15
and are given as an input to the cloud droplet formation parameterization. Aerosols are distributed in three modes: sulfate, ammonium, nitrate, organic mass, and black carbon from anthropogenic and biomass burning sources; sulfate, nitrate, and sea salt from marine processes; and mineral dust. The CCN activity of aerosols from the first two modes is assumed to follow K ¨ohler theory for CCN activation whereas mineral dust is
20
ACPD
12, 12081–12117, 2012Adjoint sensitivity of CDNC
V. A. Karydis et al.
Title Page
Abstract Introduction
Conclusions References
Tables Figures
◭ ◮
◭ ◮
Back Close
Full Screen / Esc
Printer-friendly Version Interactive Discussion
Discussion
P
a
per
|
Dis
cussion
P
a
per
|
Discussion
P
a
per
|
Discussio
n
P
a
per
|
4 Results and discussion
4.1 Overview of model predictions
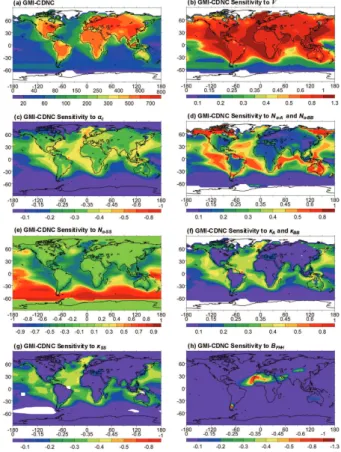
The predicted annual mean CDNC at the first model level derived from the aerosol concentration fields of GMI and GEOS-Chem models are shown in Figs. 3a and 4a, respectively. CDNC refers to the number concentration of droplets nucleated in-cloud
5
and represents an upper limit since the parameterization does not account for droplet depletion by collision, coalescence and collection. As expected, higher CDNC concen-trations (up to 750 cm−3) are predicted over the mid-latitudes of the Northern Hemi-sphere (i.e., over east Asia, Europe, and Eastern US), which is in accordance with the high CCN concentrations occurred over the industrialized regions. The predicted
10
CDNC based on the GEOS-Chem aerosol concentration field is higher over East Asia than over Europe or the United States. GMI predicts similar CDNC over these three regions. Given that the years simulated by GEOS-Chem and GMI are 2008 and 1999, respectively, this trend depicts the increase of East Asian emissions during the last decade. Over the Southern Hemisphere continents, large CDNC values occur over
15
South America and Africa in regions affected by biomass burning. The predicted CDNC from GEOS-Chem (up to 700 cm−3) is higher than the corresponding GMI predictions (up to 600 cm−3) over these regions. Over oceans, CDNC is increased up to 200 cm−3 by continental aerosol transported from the subtropical west coasts of Africa and Amer-ica, and the east coasts of North America and Asia (Minnis et al., 1992; Prospero et al.,
20
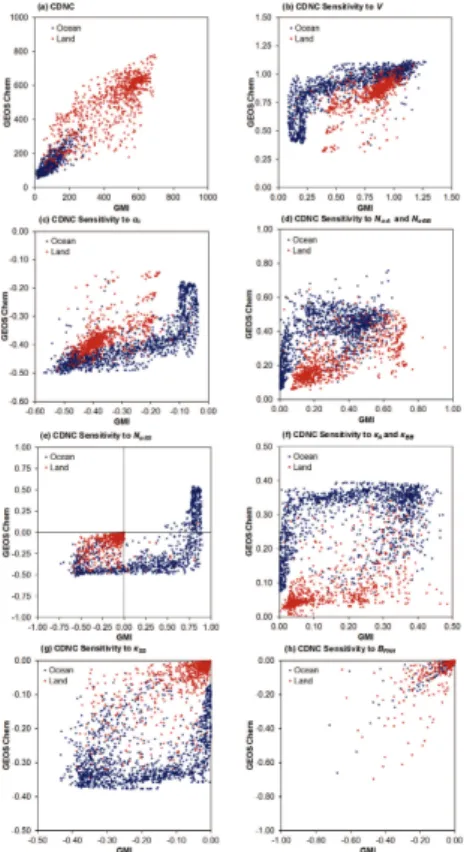
1983). Lower CDNCs are predicted over the cleaner remote oceans of the Southern Hemisphere and in the Polar Regions (up to 80 cm−3) . The lowest concentration pre-dicted by GEOS-Chem (∼40 cm−3) is about twofold higher than GMI (∼20 cm−3). Fig-ure 5a depicts the comparison between the CDNC derived from GMI and GEOS-Chem models. While the predictions between both models follow each other, on average
25
ACPD
12, 12081–12117, 2012Adjoint sensitivity of CDNC
V. A. Karydis et al.
Title Page
Abstract Introduction
Conclusions References
Tables Figures
◭ ◮
◭ ◮
Back Close
Full Screen / Esc
Printer-friendly Version Interactive Discussion
Discussion
P
a
per
|
Dis
cussion
P
a
per
|
Discussion
P
a
per
|
Discussio
n
P
a
per
|
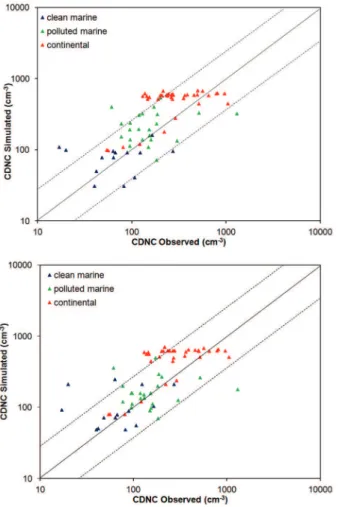
two models is observed over land mainly due to the different aerosol and aerosol pre-cursor emissions used by the two models as their emission inventories span a decade. The predicted CDNC from GEOS-Chem and GMI are also compared against obser-vational data from continental, polluted marine and clean marine regions around the world, described by Karydis et al. (2011). The summary of this comparison (Fig. 6)
5
shows that over clean marine regions, concentration ranges from 31 cm−3(49 cm−3) to 161 cm−3(247 cm−3) (Eastern Pacific) are predicted from GMI (GEOS-Chem), respec-tively; these agree with observed CDNC values mostly to within 50 % for 79 % of the cases, which range from 17 cm−3to 272 cm−3. The predicted CDNC range increases to 72–520 cm−3(in GMI) and 70–498 cm−3(in GEOS-Chem) over polluted marine regions
10
close to coasts. These are well within the observed values over those regions (61– 325 cm−3) and the 83 % and 87 % of the GMI and GEOS-Chem predictions, respec-tively, diverge less than 50 % from the measurements. The predicted CDNC over con-tinental regions ranges between 98 cm−3and 677 cm−3 in GMI and between 80 cm−3 and 704 cm−3in GEOS-Chem; observed values range from 56 cm−3up to 1050 cm−3.
15
The majority (75 % and 69 %) of the CDNC predictions from GMI and GEOS-Chem, respectively, diverge less than 50 % from the available measurements over the conti-nents.
4.2 Sensitivity of global CDNC distribution to input parameters
CDNC sensitivities were calculated to input parameters (updraft velocity, uptake coeffi
-20
cient, and aerosol concentration) and for comparison are presented as fully normalized by the value of the input parameter and predicted CDNC (i.e., NI
d
∂Nd
∂I =
∂lnNd
∂lnI , whereI
is the input parameter considered ).
Updraft velocity: Figures 3b and 4b depict the global annual average sensitivity dis-tribution of CDNC to updraft velocity,V, derived from GMI and GEOS-Chem models,
25
ACPD
12, 12081–12117, 2012Adjoint sensitivity of CDNC
V. A. Karydis et al.
Title Page
Abstract Introduction
Conclusions References
Tables Figures
◭ ◮
◭ ◮
Back Close
Full Screen / Esc
Printer-friendly Version Interactive Discussion
Discussion
P
a
per
|
Dis
cussion
P
a
per
|
Discussion
P
a
per
|
Discussio
n
P
a
per
|
2010). Therefore, the CDNC sensitivity to updraft velocity, ∂Nd
∂V =αbV
b−1
, is higher when V is low since “b−1” is always negative, and depends on the available con-densation nuclei (CN) and the predicted activation fraction (CCNCN ) as follows. ∂Nd
∂V can
be written as ∂Nd
∂CCN
∂CCN
∂smax
∂smax ∂V ;
∂Nd
∂CCN (atsmax) is constant and equal to 1 (Nenes et al., 2001), ∂∂sCCN
max is higher in low activation fractions, and
∂smax
∂V is higher in low updrafts. In 5
areas where the activation fraction is high (i.e. Southern Oceans), ∂∂sCCN
max is very small, as most of the aerosols are already activated into droplets, so the CDNC sensitivity to updraft velocity is predicted to be as low as 0.2 and 0.4 by GMI and GEOS-Chem, respectively. GEOS-Chem predicts a higher sensitivity over the pristine environments than GMI due to the lower activation fractions of the former over these areas. When
10
the activation fraction is low (i.e., polluted marine and continental environments), the
∂CCN
∂smax and ∂smax
∂V are high, resulting in large CDNC sensitivity to updraft velocity over
these areas. Given that the updraft velocity over oceans tends to be lower than over land, the sensitivity of CDNC is larger over the polluted marine areas and especially close to coasts than over the continents with values up to 1.2 and 1.3 over W. Europe
15
by GEOS-Chem and GMI, respectively. Over the continents, the sensitivity is larger over Eastern Asia, Central Europe, and Eastern North America (up to 1) where the activation fraction is predicted to be low (between 1 % and 6 %). Figure 5b depicts the comparison between the CDNC sensitivity to updraft velocity derived from GMI and GEOS-Chem models. GEOS-Chem tends to predict higher sensitivities than GMI in
20
most of the cases, especially over the ocean, because the activation fraction in the GMI is higher than in GEOS-Chem (not shown).
Uptake coefficient: The sensitivity of CDNC to water uptake coefficient, ∂Nd
∂αc, is
neg-ative and larger over the polluted environments of the Northern Hemisphere (Figs. 3c, 4c). The sensitivity is negative because a higher coefficient increases the water uptake
25
ACPD
12, 12081–12117, 2012Adjoint sensitivity of CDNC
V. A. Karydis et al.
Title Page
Abstract Introduction
Conclusions References
Tables Figures
◭ ◮
◭ ◮
Back Close
Full Screen / Esc
Printer-friendly Version Interactive Discussion
Discussion
P
a
per
|
Dis
cussion
P
a
per
|
Discussion
P
a
per
|
Discussio
n
P
a
per
|
over the west coasts of Europe and North Africa (up to−0.6). ∂Nd
∂αc is also large (∼ −0.4)
over Eastern Asia, Europe, Eastern US, as well as over the biomass burning areas of South America and Central Africa, due to the low activation fractions. Over more pristine environments, such as the Southern Oceans, uptake coefficient has a lower impact on CDNC, with ∂Nd
∂αc ≥ −0.1 and −0.2 by the GMI and GEOS-Chem models,
5
respectively. Over these environments, the availability of the aerosols is much lower (activation fraction is high) and therefore changes inαcresult in only small changes to the overall water uptake and maximum supersaturation. Similar to updraft velocity, the GEOS-Chem tends to predict higher CDNC sensitivity to uptake coefficient than GMI in most of the cases (Fig. 5c) owing to the lower activation fraction in the former.
Sensitiv-10
ities to updraft velocity and uptake coefficient have similar spatial distribution (Figs. 3b, c and 4b, c ) but they are opposite in sign (Fig. 7a). CDNC is predicted to be roughly twofold less sensitive to changes in the uptake coefficient than in the updraft velocity (Fig. 7a) and can be rationalized as follows. According to Fountoukis and Nenes (2005),
∂D′
V
∂αc ∼ −0.5, where D
′
V is the mass transfer coefficient that accounts for gas-phase
15
non-continuum effects (effective diffusivity) of water vapor onto the droplets. Substi-tuting D′
V in the G term of Eq. (2) we obtain V =
πγρw
2a DV′smaxI(0,smax) and therefore
∂V ∂αc ∼
∂D′
V
∂αc πγρw
2a smaxI(0,smax)∼ −0.5
πγρw
2a smaxI(0,smax). Consequently, changing the up-take coefficient is equivalent to a negatively proportional change the updraft velocity, and explains the strong anti correlation between ∂Nd
∂αc and
CCN CN .
20
Aerosol concentration: The sensitivity of CDNC to anthropogenic and biomass burn-ing aerosol concentrations, ∂Nd
∂(Nα−A+Nα−BB), which include sulfate, OC, and BC (for GMI), and, sulfate, nitrate, ammonium, OC, and BC (for GEOS-Chem) depends on environ-mental conditions (Figs. 3d and 4d). In polluted areas, an increase in aerosol con-centration will lead to a small increase in CDNC as both the smax and the droplet
25
ACPD
12, 12081–12117, 2012Adjoint sensitivity of CDNC
V. A. Karydis et al.
Title Page
Abstract Introduction
Conclusions References
Tables Figures
◭ ◮
◭ ◮
Back Close
Full Screen / Esc
Printer-friendly Version Interactive Discussion
Discussion
P
a
per
|
Dis
cussion
P
a
per
|
Discussion
P
a
per
|
Discussio
n
P
a
per
|
concentration is increased. Consequently, both GMI and GEOS-Chem predict a mod-erate influence (up to 0.2) of aerosol concentration on CDNC over East Asia, Eu-rope, and Eastern Northern America, as well as over the biomass burning areas of South America and South Africa; the lowest values are predicted over East Asia (less than 0.1). The moderate value of ∂Nd
∂(Nα−A+Nα−BB) computed is in accordance with P ¨oschl
5
et al. (2010), where the formation of cloud droplets in the polluted environments of the Amazon Basin, influenced by intense biomass burning, depended primarily on the up-draft velocity and not on aerosol number. On the other hand, the sensitivity of CDNC to aerosol concentration is moderate along the polluted coasts ( ∂Nd
∂(Nα−A+Nα−BB)∼0.4) and increases as we move to more pristine environments such as the tropical Pacific and
10
Atlantic Oceans (up to 0.7). The ∂Nd
∂(Nα−A+Nα−BB) over the southern oceans is not large given that CDNC is most sensitive to sea salt, the main aerosol component in the area. Sotiropoulou et al. (2007) also presented the global spatial relative sensitivity of CDNC to CCN number, and found that sensitivity increased from polluted (∼0.7) to more pristine (∼0.9) environments (a behavior consistent with the results discussed above
15
but somewhat greater in magnitude). Figure 5d depicts the comparison between the
∂Nd
∂(Nα−A+Nα−BB) derived from GMI and GEOS-Chem models. While the predictions of the two models agree relatively well over land, GEOS-Chem predicts higher sensitivities over oceans than GMI. This discrepancy can be attributed to the higher anthropogenic aerosol concentrations predicted by GEOS-Chem over marine environments compared
20
to GMI.
The sensitivity of CDNC to sea salt aerosols, ∂Nd
∂Nα−SS, over the Southern Oceans is predicted to be up to 1 and 0.6 by the GMI and GEOS-Chem applications, respec-tively (Figs. 3e and 4e). This twofold difference can be attributed to the lower CDNC concentrations predicted over this area by the GMI model compared to GEOS-Chem
25
ACPD
12, 12081–12117, 2012Adjoint sensitivity of CDNC
V. A. Karydis et al.
Title Page
Abstract Introduction
Conclusions References
Tables Figures
◭ ◮
◭ ◮
Back Close
Full Screen / Esc
Printer-friendly Version Interactive Discussion
Discussion
P
a
per
|
Dis
cussion
P
a
per
|
Discussion
P
a
per
|
Discussio
n
P
a
per
|
biomass burning aerosols for water vapor. Given that coarse sea salt activates at much lower sc than the other aerosols, its addition may substantially increase the aerosol surface area at the point ofsmax, lowering the available water vapor,smaxand CDNC (Ghan et al., 1998; Barahona et al., 2010). Because of this, the sensitivity of CDNC to sea salt aerosol concentration over polluted marine environments is negative (up to
5
−0.6) (Figs. 3e and 4e). On the other hand, sensitivity of CDNC to submicron sea salt aerosol (i.e. assuming that coarse sea salt does not vary) is positive, similar to the effect of the anthropogenic and biomass burning aerosols on CDNC described above. Fig-ure 5e contrasts the CDNC sensitivity to sea salt aerosol concentration between GMI and GEOS-Chem models. Where GEOS-Chem suggests negative sensitivity, GMI
pre-10
dicts positive sensitivity; the difference is explained by GEOS-Chem predicting higher anthropogenic aerosol concentrations than GMI model over extended regions in the mid-latitudes and Southern Oceans. The presence of these additional anthropogenic aerosols reducesmaxand make CDNC more susceptible to depletion effects from sea salt.
15
Aerosol hygroscopicity: Figures 3f and 4f depicts the sensitivity of CDNC to anthro-pogenic and biomass burning aerosol hygroscopicity. Over areas high aerosol load, the smax and the droplet activation fraction are very low; thus, increasing the hygro-scopicity of the aerosols will have a very small impact on CDNC (less than 0.1) as the tendency to increase the activation fraction will be compensated by a decrease
20
in Smax due to the increasing competition for water vapor. Ervens et al. (2010) also reported that over six different continental locations, at V ∼0.3 m s−1, the sensitivity of CDNC to particle composition (κ) was about 0.1 to 0.2. This suggests that over these regions, a simple assumption of the aerosol composition and mixing state is ad-equate for an accurate prediction of CDNC. Over moderately polluted areas (i.e., over
25
ACPD
12, 12081–12117, 2012Adjoint sensitivity of CDNC
V. A. Karydis et al.
Title Page
Abstract Introduction
Conclusions References
Tables Figures
◭ ◮
◭ ◮
Back Close
Full Screen / Esc
Printer-friendly Version Interactive Discussion
Discussion
P
a
per
|
Dis
cussion
P
a
per
|
Discussion
P
a
per
|
Discussio
n
P
a
per
|
GEOS-Chem predict that over Atlantic and Pacific Oceans, the CDNC sensitivity to an-thropogenic and biomass burning aerosol hygroscopicity is up to 0.4 (Figs. 3f, 4f). Given that the ∂Nd
∂V ∼1 in this region (Figs. 3b, 4b), our results are consistent with Rissman
et al. (2004), who also found that the sensitivity ratio ∂Nd/∂κ
∂Nd/∂V in marine stratocumulus is
up to 0.4. Moreover, Moore et al. (2011), based on data from the Alaskan Arctic during
5
the ARCPAC project, found that the sensitivity of CCN to κ at 0.1 % supersaturation (similar tosmax predicted in this study over Alaska) is up to 0.3, which is in general agreement to the ∂Nd
∂κ predicted by GEOS-Chem and GMI over the same area (up to
0.15 and 0.3, respectively). Moore et al. (2012) used CCN data sampled at California during the CalNex project in order to investigate its sensitivity toκ. At 0.06 %
supersat-10
uration (similar toSmaxpredicted in this study over California) the
∂Nd
∂κ was calculated
up to 0.15, compared to 0.1 and 0.15 predicted by GEOS-Chem and GMI, respectively, over the same area. Figure 5f depicts the comparison between the CDNC sensitivity to anthropogenic and biomass burning aerosol hygroscopicity derived from GMI and GEOS-Chem models. Similar to the influence of aerosol concentration, GEOS-Chem
15
predicts higher sensitivities over oceans than GMI due to the elevated and more spa-tially extensive presence of anthropogenic aerosol concentrations in the former. Over-all, CDNC is predicted to be less sensitive (on average by twofold) to changes in the hygroscopicity of the aerosols than in their concentration in most of the cases (Fig. 7b). This agrees well with Ervens et al. (2007) who found that the measured aerosol size
20
distribution is always for primary importance for CCN closure, while the relative impor-tance of the aerosol composition is low. However, we show here that the sensitivities to compositional changes are regionally significant especially for the arctic and remote oceans.
The hydrophilicity of dust aerosols is expressed by theAFHH and BFHH adsorption
25
ACPD
12, 12081–12117, 2012Adjoint sensitivity of CDNC
V. A. Karydis et al.
Title Page
Abstract Introduction
Conclusions References
Tables Figures
◭ ◮
◭ ◮
Back Close
Full Screen / Esc
Printer-friendly Version Interactive Discussion
Discussion
P
a
per
|
Dis
cussion
P
a
per
|
Discussion
P
a
per
|
Discussio
n
P
a
per
|
GEOS-Chem applications predict a large sensitivity over the Sahara desert and across the tropical Atlantic Ocean (up to−0.8). Over the other arid areas of the world, GMI pre-dicts much higher sensitivity than GEOS-Chem. In particular, GMI prepre-dicts sensitivities as large as−1.3 over Patagonian desert,−0.5 over the Arabian Peninsula,−0.4 over the Gobi desert, and−0.3 over Australia; whereas GEOS-Chem predicts ∂Nd
∂BFHH ∼ −0.2 5
over all these areas. The sensitivity of CDNC toAFHHadsorption parameter is up to 0.1 over desert areas. Finally, in contrast to other aerosol types, the hydrophilicity of dust aerosols (expressed through the BFHH parameter) has a significantly greater impact on CDNC than the dust aerosol concentration (Fig. 7d). In particular, the sensitivity of CDNC toBFHHparameter is 5.5 and 8 times higher than to dust aerosol concentration
10
over land and ocean, respectively.
5 Conclusions
This study introduces a novel approach to comprehensively and efficiently evaluate the sensitivity of 3-D CDNC distribution to updraft velocity, aerosol uptake coefficient, aerosol number and hygroscopicity. Sensitivities are calculated by developing the
ad-15
joint of an aerosol-droplet parameterization. The parameterization used in this study considers cloud droplet formation within an ascending air parcel containing an external mixture of soluble particles and insoluble wettable particles. Sensitivity calculations are demonstrated using the GMI and GEOS-Chem 3-D global CTMs.
CDNC is sensitive to updraft velocity and uptake coefficient over land and polluted
20
marine environments and less sensitive to those parameters over pristine environments (i.e. over the Southern Ocean). In contrast to updraft velocity, the impact of the uptake coefficient to CDNC is negative. Moreover, CDNC is predicted to be less sensitive to changes in the uptake coefficient than in the updraft velocity although the two sensitiv-ities follow the same functional form. CDNC is less sensitive to aerosol concentration
25
ACPD
12, 12081–12117, 2012Adjoint sensitivity of CDNC
V. A. Karydis et al.
Title Page
Abstract Introduction
Conclusions References
Tables Figures
◭ ◮
◭ ◮
Back Close
Full Screen / Esc
Printer-friendly Version Interactive Discussion
Discussion
P
a
per
|
Dis
cussion
P
a
per
|
Discussion
P
a
per
|
Discussio
n
P
a
per
|
sea salt aerosol can reduce CDNC. Over the Southern Ocean, CDNC is almost always positively correlated to sea salt, as the competition for water vapor during droplet for-mation is not significant. Overall, CDNC is predicted to be less sensitive to changes in the hygroscopicity of the aerosols than in their concentration, although there are regions and times where they result in comparable sensitivities. Mineral dust is
con-5
sidered an exception as its hydrophilicity (expressed through theBFHHparameter) has a more significant impact on CDNC than its aerosol concentration.
When applied in Earth system modeling frameworks, adjoint sensitivity analysis can quantify the factors that govern global cloud droplet formation by unraveling the rela-tive importance of dynamical and aerosol factors required for its calculation. Immediate
10
applications include a comprehensive understanding of the diversity of indirect forcing estimates across different modeling frameworks, quantifying the influence of spatial, sectoral, and seasonal varying emissions on CDNC, and, assimilation of remote sens-ing products. The work presented here demonstrates that adjoint sensitivity analysis is a powerful technique that will provide unprecedented understanding of complex and
15
highly coupled climate modeling frameworks.
Acknowledgements. We would like to acknowledge support from NASA-ACMAP and NOAA. S. L. C. gratefully acknowledges the NSF GRF and NASA ESSF.
References
Abdul-Razzak, H. and Ghan, S. J.: A parameterization of aerosol activation 2. Multiple aerosol
20
types, J. Geophys. Res., 105, 6837–6844, doi:10.1029/1999JD901161, 2000.
Alexander, B., Park, R. J., Jacob, D. J., Li, Q. B., Yantosca, R. M., Savarino, J., Lee, C. C. W., and Thiemens, M. H.: Sulfate formation in sea-salt aerosols: constraints from oxygen isotopes, J. Geophys. Res., 110, D10307, doi:10.1029/2004jd005659, 2005.
D’Almeida, G. A.: On the variability of desert aerosol radiative characteristics, J. Geophys. Res.,
25
ACPD
12, 12081–12117, 2012Adjoint sensitivity of CDNC
V. A. Karydis et al.
Title Page
Abstract Introduction
Conclusions References
Tables Figures
◭ ◮
◭ ◮
Back Close
Full Screen / Esc
Printer-friendly Version Interactive Discussion
Discussion
P
a
per
|
Dis
cussion
P
a
per
|
Discussion
P
a
per
|
Discussio
n
P
a
per
|
Alterskjær, K., Kristj ´ansson, J. E., and Seland, Ø.: Sensitivity to deliberate sea salt seeding of marine clouds – observations and model simulations, Atmos. Chem. Phys., 12, 2795–2807, doi:10.5194/acp-12-2795-2012, 2012.
Amos, H. M., Jacob, D. J., Holmes, C. D., Fisher, J. A., Wang, Q., Yantosca, R. M., Cor-bitt, E. S., Galarneau, E., Rutter, A. P., Gustin, M. S., Steffen, A., Schauer, J. J.,
Gray-5
don, J. A., Louis, V. L. St., Talbot, R. W., Edgerton, E. S., Zhang, Y., and Sunderland, E. M.: Gas-particle partitioning of atmospheric Hg(II) and its effect on global mercury deposition, Atmos. Chem. Phys., 12, 591–603, doi:10.5194/acp-12-591-2012, 2012.
Anderson, B. E., Grant, W. B., Gregory, G. L., Browell, E. V., Collins, J. E., Sachse, G. W., Bagwell, D. R., Hudgins, C. H., Blake, B. R., and Blake, N. J.: Aerosols from biomass burning
10
over the tropical South Atlantic region: distributions and impacts, J. Geophys. Res., 101, 24117–24137, doi:10.1029/96JD00717, 1996.
Anttila, T. and Kerminen, V.-M.: On the contribution of Aitken mode particles to cloud droplet populations at continental background areas – a parametric sensitivity study, Atmos. Chem. Phys., 7, 4625–4637, doi:10.5194/acp-7-4625-2007, 2007.
15
Barahona, D. and Nenes, A.: Parameterization of cloud droplet formation in large-scale models: including effects of entrainment, J. Geophys. Res., 112, D16206, doi:10.1029/2007JD008473, 2007.
Barahona, D., West, R. E. L., Stier, P., Romakkaniemi, S., Kokkola, H., and Nenes, A.: Com-prehensively accounting for the effect of giant CCN in cloud activation parameterizations,
20
Atmos. Chem. Phys., 10, 2467–2473, doi:10.5194/acp-10-2467-2010, 2010.
Barahona, D., Sotiropoulou, R. E. P., and Nenes, A.: Global distribution of cloud droplet number concentration, autoconversion rate and aerosol indirect effect under diabatic droplet activa-tion, J. Geophy. Res., 116, D09203, doi:10.1029/2010JD015274, 2011.
Bey, I., Jacob, D. J., Yantosca, R. M., Logan, J. A., Field, B. D., Fiore, A. M., Li, Q. B.,
25
Liu, H. G. Y., Mickley, L. J., and Schultz, M. G.: Global modeling of tropospheric chem-istry with assimilated meteorology: model description and evaluation, J. Geophys. Res., 106, 23073–23095, doi:10.1029/2001jd000807, 2001.
Bond, T. C., Bhardwaj, E., Dong, R., Jogani, R., Jung, S. K., Roden, C., Streets, D. G., and Traut-mann, N. M.: Historical emissions of black and organic carbon aerosol from energy-related
30
ACPD
12, 12081–12117, 2012Adjoint sensitivity of CDNC
V. A. Karydis et al.
Title Page
Abstract Introduction
Conclusions References
Tables Figures
◭ ◮
◭ ◮
Back Close
Full Screen / Esc
Printer-friendly Version Interactive Discussion
Discussion
P
a
per
|
Dis
cussion
P
a
per
|
Discussion
P
a
per
|
Discussio
n
P
a
per
|
Boucher, O. and Lohmann, U.: The sulfate-CCN-cloud albedo effect – a sensitivity study with 2 general-circulation models, Tellus B, 47, 281–300, doi:10.1034/j.1600-0889.47.issue3.1.x, 1995.
Capps, S. L., Henze, D. K., Hakami, A., Russell, A. G., and Nenes, A.: ANISORROPIA: the adjoint of the aerosol thermodynamic model ISORROPIA, Atmos. Chem. Phys., 12, 527–
5
543, doi:10.5194/acp-12-527-2012, 2012.
Chuang, C. C., Penner, J. E., Taylor, K. E., Grossman, A. S., and Walton, J. J.: An assessment of the radiative effects of anthropogenic sulfate, J. Geophys. Res., 102, 3761–3778, 1997. Chuang, P. Y., Collins, D. R., Pawlowska, H., Snider, J. R., Jonsson, H. H., Brenguier, J. L.,
Flagan, R. C., and Seinfeld, J. H.: CCN measurements during ACE-2 and their relationship
10
to cloud microphysical properties, Tellus B, 52, 843–867, 2000.
Considine, D. B., Bergmann, D. J., and Liu, H.: Sensitivity of Global Modeling Initiative chemistry and transport model simulations of radon-222 and lead-210 to input meteorological data, Atmos. Chem. Phys., 5, 3389–3406, doi:10.5194/acp-5-3389-2005, 2005.
Ervens, B., Cubison, M., Andrews, E., Feingold, G., Ogren, J. A., Jimenez, J. L., DeCarlo, P.,
15
and Nenes, A.: Prediction of cloud condensation nucleus number concentration using mea-surements of aerosol size distributions and composition and light scattering enhancement due to humidity, J. Geophys. Res., 112, D10S32, doi:10.1029/2006jd007426, 2007.
Ervens, B., Cubison, M. J., Andrews, E., Feingold, G., Ogren, J. A., Jimenez, J. L., Quinn, P. K., Bates, T. S., Wang, J., Zhang, Q., Coe, H., Flynn, M., and Allan, J. D.: CCN predictions using
20
simplified assumptions of organic aerosol composition and mixing state: a synthesis from six different locations, Atmos. Chem. Phys., 10, 4795–4807, doi:10.5194/acp-10-4795-2010, 2010.
Fairlie, T. D., Jacob, D. J., and Park, R. J.: The impact of transpacific transport of mineral dust in the United States, Atmos. Environ., 41, 1251–1266, doi:10.1016/j.atmosenv.2006.09.048,
25
2007.
Fisher, J. A., Jacob, D. J., Wang, Q. Q., Bahreini, R., Carouge, C. C., Cubison, M. J., Dibb, J. E., Diehl, T., Jimenez, J. L., Leibensperger, E. M., Lu, Z. F., Meinders, M. B. J., Pye, H. O. T., Quinn, P. K., Sharma, S., Streets, D. G., van Donkelaar, A., and Yantosca, R. M.: Sources, distribution, and acidity of sulfate-ammonium aerosol in the Arctic in winter-spring, Atmos.
30
ACPD
12, 12081–12117, 2012Adjoint sensitivity of CDNC
V. A. Karydis et al.
Title Page
Abstract Introduction
Conclusions References
Tables Figures
◭ ◮
◭ ◮
Back Close
Full Screen / Esc
Printer-friendly Version Interactive Discussion
Discussion
P
a
per
|
Dis
cussion
P
a
per
|
Discussion
P
a
per
|
Discussio
n
P
a
per
|
Fountoukis, C. and Nenes, A.: Continued development of a cloud droplet formation parameteri-zation for global climate models, J. Geophys. Res., 110, D11212, doi:10.1029/2004jd005591, 2005.
Fountoukis, C., Nenes, A., Meskhidze, N., Bahreini, R., Conant, W. C., Jonsson, H., Murphy, S., Sorooshian, A., Varutbangkul, V., Brechtel, F., Flagan, R. C., and Seinfeld, J. H.:
Aerosol-5
cloud drop concentration closure for clouds sampled during the International Consortium for Atmospheric Research on Transport and Transformation 2004 campaign, J. Geophys. Res., 112, D10S30, doi:10.1029/2006jd007272, 2007.
Ghan, S. J., Guzman, G., and Abdul-Razzak, H.: Competition between sea salt and sulfate particles as cloud condensation nuclei, J. Atmos. Sci., 55, 3340–3347, 1998.
10
Ghil, M. and Malanotterizzoli, P.: Data assimilation in meteorology and oceanography, Adv. Geophys., 33, 141–266, doi:10.1016/s0065-2687(08)60442-2, 1991.
Giering, R.: Tangent linear and adjoint biogeochemical models, in: Inverse Methods in Global Biogeochemical Cycles, edited by: Kasibhatla, P., Heimann, M., Rayner, P., Mahowald, N., Prinn, R. G., and Hartley, D. E., Geophysical Monograph Series, American Geophysical
15
Union, Washington, 33–48, 2000.
Guibert, S., Snider, J. R., and Brenguier, J. L.: Aerosol activation in marine stratocumu-lus clouds: 1. measurement validation for a closure study, J. Geophys. Res., 108, 8628, doi:10.1029/2002JD002678, 2003.
Haerter, J. O., Roeckner, E., Tomassini, L., and von Storch, J. S.: Parametric uncertainty effects
20
on aerosol radiative forcing, Geophys. Res. Lett., 36, L15707, doi:10.1029/2009gl039050, 2009.
Hakami, A., Henze, D. K., Seinfeld, J. H., Chai, T., Tang, Y., Carmichael, G. R., and Sandu, A.: Adjoint inverse modeling of black carbon during the Asian Pacific Regional Aerosol Charac-terization Experiment, J. Geophys. Res., 110, D14301, doi:10.1029/2004jd005671, 2005.
25
Hall, M. C. G.: Application of adjoint sensitivity theory to an atmospheric general-circulation model, J. Atmos. Sci., 43, 2644–2651, 1986.
Henze, D. K., Seinfeld, J. H., and Shindell, D. T.: Inverse modeling and mapping US air quality influences of inorganic PM2.5precursor emissions using the adjoint of GEOS-Chem, Atmos. Chem. Phys., 9, 5877–5903, doi:10.5194/acp-9-5877-2009, 2009.
30
ACPD
12, 12081–12117, 2012Adjoint sensitivity of CDNC
V. A. Karydis et al.
Title Page
Abstract Introduction
Conclusions References
Tables Figures
◭ ◮
◭ ◮
Back Close
Full Screen / Esc
Printer-friendly Version Interactive Discussion
Discussion
P
a
per
|
Dis
cussion
P
a
per
|
Discussion
P
a
per
|
Discussio
n
P
a
per
|
Kopacz, M., Mauzerall, D. L., Wang, J., Leibensperger, E. M., Henze, D. K., and Singh, K.: Origin and radiative forcing of black carbon transported to the Himalayas and Tibetan Plateau, Atmos. Chem. Phys., 11, 2837–2852, doi:10.5194/acp-11-2837-2011, 2011.
Korhonen, H., Carslaw, K. S., and Romakkaniemi, S.: Enhancement of marine cloud albedo via controlled sea spray injections: a global model study of the influence of emission rates,
5
microphysics and transport, Atmos. Chem. Phys., 10, 4133–4143, doi:10.5194/acp-10-4133-2010, 2010.
Kumar, P., Sokolik, I. N., and Nenes, A.: Parameterization of cloud droplet formation for global and regional models: including adsorption activation from insoluble CCN, Atmos. Chem. Phys., 9, 2517–2532, doi:10.5194/acp-9-2517-2009, 2009.
10
Kumar, P., Sokolik, I. N., and Nenes, A.: Measurements of cloud condensation nuclei activity and droplet activation kinetics of fresh unprocessed regional dust samples and minerals, Atmos. Chem. Phys., 11, 3527–3541, doi:10.5194/acp-11-3527-2011, 2011a.
Kumar, P., Sokolik, I. N., and Nenes, A.: Cloud condensation nuclei activity and droplet activa-tion kinetics of wet processed regional dust samples and minerals, Atmos. Chem. Phys., 11,
15
8661–8676, doi:10.5194/acp-11-8661-2011, 2011b.
Lance, S., Nenes, A., and Rissman, T. A.: Chemical and dynamical effects on cloud droplet number: Implications for estimates of the aerosol indirect effect, J. Geophys. Res., 109, D22208, doi:10.1029/2004jd004596, 2004.
Le Dimet, F. X. and Talagrand, O.: Variational algorithms for analysis and assimilation of
mete-20
orological observations: theoretical aspects, Tellus B, 38, 97–110, 1986.
Lee, C., Martin, R. V., van Donkelaar, A., Lee, H., Dickerson, R. R., Hains, J. C., Krotkov, N., Richter, A., Vinnikov, K., and Schwab, J. J.: SO2 emissions and lifetimes: estimates from inverse modeling using in situ and global, space-based (SCIAMACHY and OMI) observa-tions, J. Geophys. Res., 116, D06304, doi:10.1029/2010jd014758, 2011a.
25
Lee, L. A., Carslaw, K. S., Pringle, K. J., Mann, G. W., and Spracklen, D. V.: Emulation of a complex global aerosol model to quantify sensitivity to uncertain parameters, Atmos. Chem. Phys., 11, 12253–12273, doi:10.5194/acp-11-12253-2011, 2011b.
Leibensperger, E. M., Chen, W. T., Seinfeld, J. H., Nenes, A., Adams, P. J., Streets, D. G., Ku-mar, N., and Rind, D.: Climatic effects of 1950–2050 changes in US anthropogenic aerosols
30
ACPD
12, 12081–12117, 2012Adjoint sensitivity of CDNC
V. A. Karydis et al.
Title Page
Abstract Introduction
Conclusions References
Tables Figures
◭ ◮
◭ ◮
Back Close
Full Screen / Esc
Printer-friendly Version Interactive Discussion
Discussion
P
a
per
|
Dis
cussion
P
a
per
|
Discussion
P
a
per
|
Discussio
n
P
a
per
|
Lions, J. L.: Optimal control of systems governed by partial differential equations, Springer, Berlin, Germany, 1971.
Liu, H. Y., Jacob, D. J., Bey, I., and Yantosca, R. M.: Constraints from Pb-210 and Be-7 on wet deposition and transport in a global three-dimensional chemical tracer model driven by assimilated meteorological fields, J. Geophys. Res., 106, 12109–12128,
5
doi:10.1029/2000jd900839, 2001.
Liu, X. H., Penner, J. E., and Herzog, M.: Global modeling of aerosol dynamics: model descrip-tion, evaluadescrip-tion, and interactions between sulfate and nonsulfate aerosols, J. Geophys. Res., 110, D18206, doi:10.1029/2004jd005674, 2005.
Mari, C., Jacob, D. J., and Bechtold, P.: Transport and scavenging of soluble gases in a deep
10
convective cloud, J. Geophys. Res., 105, 22255–22267, doi:10.1029/2000jd900211, 2000. Martien, P. T. and Harley, R. A.: Adjoint sensitivity analysis for a three-dimensional
photochem-ical model: implementation and method comparison, Environ. Sci. Technol., 40, 2663–2670, doi:10.1021/es0510257, 2006.
Menut, L., Vautard, R., Beekmann, M., and Honore, C.: Sensitivity of photochemical pollution
15
using the adjoint of a simplified chemistry-transport model, J. Geophys. Res., 105, 15379– 15402, doi:10.1029/1999jd900953, 2000.
Meskhidze, N., Nenes, A., Conant, W. C., and Seinfeld, J. H.: Evaluation of a new cloud droplet activation parameterization with in situ data from CRYSTAL-FACE and CSTRIPE, J. Geo-phys. Res., 110, D16202 doi:10.1029/2004jd005703, 2005.
20
Minnis, P., Heck, P. W., Young, D. F., Fairall, C. W., and Snider, J. B.: Stratocumulus cloud prop-erties derived from simultaneous satellite and island-based instrumentation during fire, J. Appl. Meteorol., 31, 317–339, 1992.
Moore, R. H., Bahreini, R., Brock, C. A., Froyd, K. D., Cozic, J., Holloway, J. S., Middle-brook, A. M., Murphy, D. M., and Nenes, A.: Hygroscopicity and composition of Alaskan
25
Arctic CCN during April 2008, Atmos. Chem. Phys., 11, 11807–11825, doi:10.5194/acp-11-11807-2011, 2011.
Moore, R. H., Cerully, K., Bahreini, R., Brock, C. A., Middlebrook, A. M., and Nenes, A.: Hygro-scopicity and composition of California CCN during summer 2010, J. Geophys. Res., 117, D00V12, doi:10.1029/2011JD017352, 2012.
30