AMTD
8, 13285–13330, 2015The Aerosol Limb Imager
B. J. Elash et al.
Title Page
Abstract Introduction
Conclusions References
Tables Figures
◭ ◮
◭ ◮
Back Close
Full Screen / Esc
Printer-friendly Version Interactive Discussion
Discussion
P
a
per
|
Discussion
P
a
per
|
Discussion
P
a
per
|
Discussion
P
a
per
|
Atmos. Meas. Tech. Discuss., 8, 13285–13330, 2015 www.atmos-meas-tech-discuss.net/8/13285/2015/ doi:10.5194/amtd-8-13285-2015
© Author(s) 2015. CC Attribution 3.0 License.
This discussion paper is/has been under review for the journal Atmospheric Measurement Techniques (AMT). Please refer to the corresponding final paper in AMT if available.
The Aerosol Limb Imager: acousto-optic
imaging of limb scattered sunlight for
stratospheric aerosol profiling
B. J. Elash, A. E. Bourassa, P. R. Loewen, N. D. Lloyd, and D. A. Degenstein
Institute of Space and Atmospheric Studies, Saskatchewan, Canada
Received: 26 October 2015 – Accepted: 30 November 2015 – Published: 17 December 2015
Correspondence to: B. J. Elash ([email protected])
AMTD
8, 13285–13330, 2015The Aerosol Limb Imager
B. J. Elash et al.
Title Page
Abstract Introduction
Conclusions References
Tables Figures
◭ ◮
◭ ◮
Back Close
Full Screen / Esc
Printer-friendly Version Interactive Discussion
Discussion
P
a
per
|
Discussion
P
a
per
|
Discussion
P
a
per
|
Discussion
P
a
per
|
Abstract
The Aerosol Limb Imager (ALI) is an optical remote sensing instrument designed to image scattered sunlight from the atmospheric limb. These measurements are used to retrieve spatially resolved information of the stratospheric aerosol distribution, including spectral extinction coefficient and particle size. Here we present the design, develop-5
ment and test results of an ALI prototype instrument. The long term goal of this work is the eventual realization of ALI on a satellite platform in low earth orbit, where it can provide high spatial resolution observations, both in the vertical and cross-track. The instrument design uses a large aperture Acousto-Optic Tunable Filter (AOTF) to image the sunlit stratospheric limb in a selectable narrow wavelength band ranging from the 10
visible to the near infrared. The ALI prototype was tested on a stratospheric balloon flight from the Canadian Space Agency (CSA) launch facility in Timmins, Canada, in September 2014. Preliminary analysis of the hyperspectral images indicate that the radiance measurements are of high quality, and we have used these to retrieve verti-cal profiles of stratospheric aerosol extinction coefficient from 650–1000 nm, along with 15
one moment of the particle size distribution. Those preliminary results are promising and development of a satellite prototype of ALI within the Canadian Space Agency is ongoing.
1 Introduction
Stratospheric aerosol plays an important role in the global radiative forcing balance 20
AMTD
8, 13285–13330, 2015The Aerosol Limb Imager
B. J. Elash et al.
Title Page
Abstract Introduction
Conclusions References
Tables Figures
◭ ◮
◭ ◮
Back Close
Full Screen / Esc
Printer-friendly Version Interactive Discussion
Discussion
P
a
per
|
Discussion
P
a
per
|
Discussion
P
a
per
|
Discussion
P
a
per
|
the variability and trends in the global stratospheric aerosol load are underway with various ground based and satellite data sets (Rieger et al., 2015; Ridley et al., 2014).
Since its discovery with stratospheric balloon observations (Junge et al., 1961), stratospheric aerosol has been measured with various techniques, although due to the variability of physical composition and particle size, the observations are essentially al-5
ways limited to some degree. In-situ balloon observations continue to be used and have provided highly valuable data sets, including most notably the long time series of optical particle counter measurements from Laramie, WY (Deshler et al., 2003, 2006; Kovi-lakam et al., 2015). Aircraft-borne nephelometers (Beuttell and Brewer, 1949; Charl-son et al., 1969) acquire detailed in-situ measurements, providing, for example, plume 10
composition (Murphy et al., 2014), but are spatially limited to the aircraft track. Ground based lidars have been used to do detailed studies of the extent of volcanic aerosol plumes (Chazette et al., 1995; Sawamura et al., 2012) and provide valuable insight into long term local variability and trends in the aerosol layer. For example, lidar ob-servations were used by Hofmann et al. (2009) to first report the observed increase in 15
stratospheric aerosol over approximately the last decade. However, the global distribu-tion, which can only really be obtained with satellite observations, provides invaluable insight into aerosol processes and variability. A good example of this is the use of satel-lite observations by Vernier et al. (2011b) to determine that the increased stratospheric aerosol load reported by Hofmann et al. (2009) was in fact due to a series of relatively 20
minor, mostly tropical, volcanic eruptions.
Satellite instrumentation capable of remote sensing stratospheric aerosol has been in use since the 1970’s, beginning with limb sounding solar occultation measurements. These have provided a reliable, accurate and essentially continuous long term record of vertically resolved aerosol extinction coefficient measurements, mostly from the series 25
com-AMTD
8, 13285–13330, 2015The Aerosol Limb Imager
B. J. Elash et al.
Title Page
Abstract Introduction
Conclusions References
Tables Figures
◭ ◮
◭ ◮
Back Close
Full Screen / Esc
Printer-friendly Version Interactive Discussion
Discussion
P
a
per
|
Discussion
P
a
per
|
Discussion
P
a
per
|
Discussion
P
a
per
|
paring the retrieved extinction profiles to other microphysical parameters (Russell and McCormick, 1989; Kovilakam et al., 2015). However, solar occultation is generally a ro-bust and stable technique as it directly measures atmospheric optical depth, along with the exo-atmospheric solar spectrum with each scan, allowing for straight forward re-trieval of aerosol extinction coefficient (Damadeo et al., 2013). Although the currently 5
operational MAESTRO and ACE-Imager instruments on SciSat (McElroy et al., 2007; Gilbert et al., 2007) have had some success producing stratospheric aerosol extinction products (Vanhellemont et al., 2008; Sioris et al., 2010), the era of solar occultation measurements essentially came to an end with SAGE III in 2006. However, a manifes-tation of SAGE III is planned for deployment on the International Space Smanifes-tation in 2016 10
(Cisewski et al., 2014).
More recently, limb scattered sunlight measurements have been used for strato-spheric aerosol retrievals. Although this technique has the advantage of being able to sample the atmosphere throughout the sunlit hemisphere, it requires the use of a com-plex forward model of multiple scattering processes along with at least some a priori 15
knowledge of the aerosol scattering cross section in order to retrieve the extinction coefficient profile. The Optical Spectrograph and InfraRed Imaging System (OSIRIS) instrument (Llewellyn et al., 2004), which was launched in 2001 and is presently still op-erational, was the first satellite limb scatter instrument to retrieve stratospheric aerosol extinction (Bourassa et al., 2007). The current OSIRIS version 5.07 data product, 20
which provides 750 nm extinction profiles at approximately 2 km vertical resolution, has been shown to agree relatively well with SAGE II and SAGE III occultation measure-ments (Bourassa et al., 2012b; Rieger et al., 2015). The SCanning Imaging Absorp-tion spectroMeter for Atmospheric CHartographY (SCIAMACHY) instrument on Envisat (Bovensmann et al., 1999) uses a retrieval technique essentially similar to OSIRIS to 25
AMTD
8, 13285–13330, 2015The Aerosol Limb Imager
B. J. Elash et al.
Title Page
Abstract Introduction
Conclusions References
Tables Figures
◭ ◮
◭ ◮
Back Close
Full Screen / Esc
Printer-friendly Version Interactive Discussion
Discussion
P
a
per
|
Discussion
P
a
per
|
Discussion
P
a
per
|
Discussion
P
a
per
|
The most recently launched limb scatter instrument is the Ozone Mapping Profiler Suite Limb Profiler (OMPS-LP) on the Suomi-NPP satellite. Although similar in spec-tral range and vertical resolution to OSIRIS, OMPS-LP is an imaging spectrometer that vertically images the limb in a single measurement. Both OSIRIS and SCIAMACHY are grating spectrometers with a narrow field of view, such that limb profiles are obtained 5
by vertically scanning through a range of tangent altitudes. The imaging capability of OMPS provides a decrease in the time required to obtain a limb profile and so in-creases the along track sampling. Recent work on the feasibility of aerosol retrieval from OMPS-LP measurements show promising results (Rault and Loughman, 2013).
Several recent studies have highlighted the requirement for continued global strato-10
spheric aerosol observations, and especially the need to resolve, both vertically and horizontally, aerosol in the lowermost stratosphere and the upper troposphere. This is the case for tracking the evolution of aerosol from volcanic eruptions, which can have a substantial effect on the aerosol optical depth in the lowermost stratosphere (Ridley et al., 2014; Andersson et al., 2015). Furthering the understanding of the transport of 15
aerosol near and across the tropopause would also benefit from higher spatial and temporal resolution observations. This is evident in the case of volcanic plumes, such as that from Nabro in 2011, the transport and origin of which has been studied exten-sively and somewhat controversially (Bourassa et al., 2012c, 2013; Vernier et al., 2013; Fromm et al., 2013, 2014; Fairlie et al., 2014; Clarisse et al., 2014). However, this is 20
also the case for the formation of background-level aerosol, particularly in the region of the Asian and North American monsoons, which have been identified as a source of substantial, seasonal and highly structured aerosol formation from precursor, tropo-spheric source gases (Vernier et al., 2011a; Neely et al., 2014; Thomason and Vernier, 2013).
25
How-AMTD
8, 13285–13330, 2015The Aerosol Limb Imager
B. J. Elash et al.
Title Page
Abstract Introduction
Conclusions References
Tables Figures
◭ ◮
◭ ◮
Back Close
Full Screen / Esc
Printer-friendly Version Interactive Discussion
Discussion
P
a
per
|
Discussion
P
a
per
|
Discussion
P
a
per
|
Discussion
P
a
per
|
ever, the stratospheric backscatter signal is weak and requires averaging of only the night time measurements over several days and typically 0.5 km vertically and 500 km horizontally (Vernier et al., 2011b). Additionally, the uncertainty in the calibration with respect to the molecular background that is on the order of the stratospheric aerosol signal leads to a potential bias in the stratospheric measurements (Rogers et al., 2011). 5
CALIPSO was launched in 2006 and although it is presently still operational, it is also operating beyond its design lifetime.
Continued stratospheric aerosol observations from space are drastically needed though few, if any, planned missions with such capability are underway. In this paper we present the design and test of a prototype instrument for potential future satellite-10
based stratospheric aerosol observation. The Aerosol Limb Imager (ALI) concept is a relatively small, low-cost, low-power, passive instrument, suitable for microsatellite deployment, with the capability to provide high spatial resolution measurements, both vertically and horizontally, of the visible/NIR aerosol extinction coefficient. The basic idea is to leverage the clear advantages of the limb scatter technique as a passive, 15
and therefore low mass and power, means to obtain daily global coverage, with a two dimensional hyperspectral imager for filling cross-track observation.
The ALI instrument concept is built around the use of an Acousto-Optic Tunable Filter (AOTF), which is a novel filtering technology that provides the ability to rapidly select the central wavelength of an image with no moving parts. These filters, which have recently 20
been developed as large aperture, imaging quality devices, operate very efficiently in the red and near infrared spectral range, which is a well matched spectral range for limb scatter sensitivity to aerosol and cloud (Rieger et al., 2014). Additionally, the spectral bandpass of the AOTF, which is typically between 3–6 nm at these wavelengths, is very suitable for the broadband scattering characteristics of the aerosol limb signal. The two 25
AMTD
8, 13285–13330, 2015The Aerosol Limb Imager
B. J. Elash et al.
Title Page
Abstract Introduction
Conclusions References
Tables Figures
◭ ◮
◭ ◮
Back Close
Full Screen / Esc
Printer-friendly Version Interactive Discussion
Discussion
P
a
per
|
Discussion
P
a
per
|
Discussion
P
a
per
|
Discussion
P
a
per
|
It should be noted that the basic instrument design concept of ALI is very similar to that of the Atmospheric Limb Tracker for the Investigation of the Upcoming Strato-sphere (ALTIUS) (Dekemper et al., 2012), which is a Belgian instrument concept from at the Belgian Institute for Space Aeronomy (BIRA). ALTIUS is designed to measure limb scattered sunlight; however, it also has solar, stellar, and planetary occultation 5
modes and is scientifically focused on trace gas measurements, particularly for ozone, whereas ALI is optimized for aerosol observation.
2 ALI instrument design
ALI is a simple optical system that images essentially a single wavelength at a time through the use of an acousto-optic tunable filter (AOTF). The AOTF is a unique device 10
that allows for the filtering without any moving parts and relatively low power consump-tion. However, the AOTF operation requires important instrument design considerations to account for its optical operation. For example, the diffractive qualities of the AOTF depend on the angle that light enters the device. Additionally, in practice the AOTF output is limited to a single linear polarization, which reduces the system throughput 15
and causes potential internal stray light in the system through the rejection of the other linear polarization. The following sections provide a brief introduction to the physical operation of the AOTF, considerations for implementation in a system designed specif-ically for aerosol, and an overview of the final ALI optical design.
2.1 Acousto-optical tunable filter
20
AMTD
8, 13285–13330, 2015The Aerosol Limb Imager
B. J. Elash et al.
Title Page
Abstract Introduction
Conclusions References
Tables Figures
◭ ◮
◭ ◮
Back Close
Full Screen / Esc
Printer-friendly Version Interactive Discussion
Discussion
P
a
per
|
Discussion
P
a
per
|
Discussion
P
a
per
|
Discussion
P
a
per
|
system has several distinct advantages due to its low mass, fast stabilization times of a few microseconds, and no moving parts. Although many applications use small, non-imaging AOTFs’ with various configurations, large aperture, birefringent, non-collinear acousto-optic devices are typically used in imaging systems. A non-collinear device is one where the input light beam and the RF acoustic wave are not aligned. Thanks to 5
recent advancements in non-collinear AOTF technology these devices now have rel-atively high efficiency and robust imaging quality (Georgiev et al., 2002; Voloshinov et al., 2007).
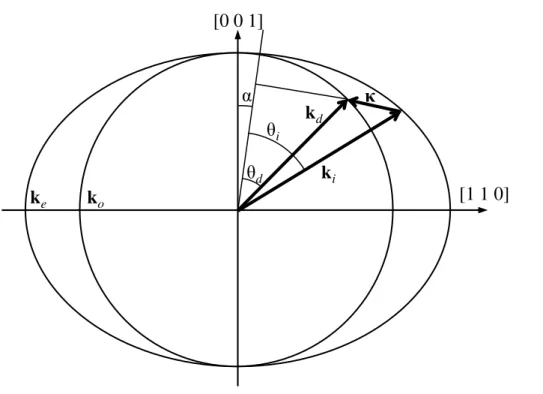
To create the diffraction of a specific wavelength, a momentum matching criterion must be held where the wave vectors of the acoustic wave match the difference of the 10
incoming and diffracted light wave vectors as seen in Fig. 1. This condition is known as the Bragg matching criterion and is given by
ki=κ+kd (1)
where|ki| = 2πni/λis the wave number of the incident light,|kd| = 2πnd/λis the wave
number of the diffracted light, and|κ| = 2πF/νis the wave number of the acousto wave. 15
The parametersλ,F andνare the wavelength of light in vacuum, the frequency of the RF wave, and the phase velocity in the crystal respectively and the indices of refraction for the incident and diffracted light areniandndrespectively. Using the condition given
in Eq. (1) and the wave vector diagram gives the following relation for a birefringent material undergoing Bragg diffraction
20
λ=∆nν
F
sin2(θi+α)
sinθi
(2)
where∆n is the absolute difference between the ordinary and extraordinary indices of refraction,θi is the angle of incidence of the incoming light, andα is the angle the
AMTD
8, 13285–13330, 2015The Aerosol Limb Imager
B. J. Elash et al.
Title Page
Abstract Introduction
Conclusions References
Tables Figures
◭ ◮
◭ ◮
Back Close
Full Screen / Esc
Printer-friendly Version Interactive Discussion
Discussion
P
a
per
|
Discussion
P
a
per
|
Discussion
P
a
per
|
Discussion
P
a
per
|
wave. This equation also displays an important implication of the operation of the de-vice that affects the design possibilities in an imaging system. That is, the wavelength of diffracted signal is dependent on the angle of incidence of the incoming wave. There-fore, passing the light beam through the AOTF at different incident angles will result in slightly different outgoing diffracted wavelengths. Also, through the described interac-5
tion, the diffracted light goes through a 90◦rotation in polarization (Voloshinov, 1996). For ALI prototyping purposes, a 10 mm×10 mm aperture imaging quality ATOF was acquired from Brimrose of America (model number TEAFI10-0.6-1.0-MSD) with a Gooch and Housego driver (model number 64020-200-2ADMDFS-A). The AOTF is optically tuned for the wavelength octave of 600 to 1200 nm, corresponding to an RF 10
range of 156 to 70 MHz. It is made from tellurium dioxide (TeO2), a birefringent crystal with indices of refraction at 800 nm of 2.226 and 2.373 for the ordinary and extraordi-nary modes respectively (Uchida, 1971). The acousto-optic diffraction angle is not con-stant angle with wavelength, so in order to achieve an essentially concon-stant diffraction angle the rear surface of the crystal is cut at a specific angle, such that the refraction 15
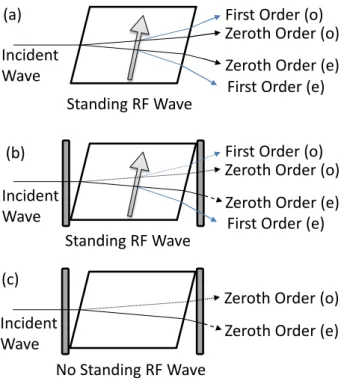
at this final surface compensates for the angular change with wavelength. For our spe-cific sample, the diffracted extraordinary light beam is compensated in this way and is diffracted 2.7◦ from the input optical axis of the device. The ordinary light beam also undergoes diffraction, but at a non-constant angle from the optical axis with respect to wavelength and is not imaged by the system. A schematic of the basic light paths 20
through the AOTF is shown in Fig. 2a.
2.2 Instrument design
The ALI prototype that we have developed has been designed specifically for testing from a stratospheric balloon at a float altitude of approximately 35 km. In this geometry, a field of view that captures a vertical image of the limb from the horizontal at float 25
AMTD
8, 13285–13330, 2015The Aerosol Limb Imager
B. J. Elash et al.
Title Page
Abstract Introduction
Conclusions References
Tables Figures
◭ ◮
◭ ◮
Back Close
Full Screen / Esc
Printer-friendly Version Interactive Discussion
Discussion
P
a
per
|
Discussion
P
a
per
|
Discussion
P
a
per
|
Discussion
P
a
per
|
resolution of the measured radiance profiles is 200 m in tangent altitude. A wavelength range of 600–1000 nm was decided upon for the prototype, mostly to align well with the spectral response of a standard and readily available CCD detector. We also attempted to pay careful attention to stray light reduction including both internal scatter and out-of-field signal.
5
The use of the AOTF essentially limits the optical design to two possible basic lay-outs: the telecentric or the telescopic system. This limitation is mainly that the incoming light beams at the AOTF device must enter at less than the acceptance angle, which is defined by a threshold beyond which the diffraction efficiency falls offsharply. These AOTF layouts have been studied previously (Suhre et al., 2004); however they are 10
briefly explained here in the context of our intended purpose of limb imaging aerosol. The upshot is that the telescopic, or afocal, system causes a wavelength gradient to be formed across the image plane, whereas the telecentric design overcomes this prob-lem but has a larger spectral point spread function, and a slight change in focus with wavelength. The optical design software Code V was used to assist in designing and 15
analyzing the performance of both of the optical layouts.
A telecentric layout leads to focused light bundles passing through the AOTF. The filtered image then has a constant wavelength across the entire image with a larger spectral point spread function, since the diffracted wavelength is dependent on inci-dent angle, as seen in Eq. (2). This layout has two inherent issues. First, it is sensitive 20
to any surface defects of the crystal since the light path is focused very near the AOTF surfaces. Second, a shift in the location of the imaging focal plane occurs that is de-pendent on wavelength such that perfect focus can only be obtained for a single wave-length. Defocusing will occur at the image plane for all other wavelengths and in order to correct for this problem additional compensating optics would need to be added or 25
AMTD
8, 13285–13330, 2015The Aerosol Limb Imager
B. J. Elash et al.
Title Page
Abstract Introduction
Conclusions References
Tables Figures
◭ ◮
◭ ◮
Back Close
Full Screen / Esc
Printer-friendly Version Interactive Discussion
Discussion
P
a
per
|
Discussion
P
a
per
|
Discussion
P
a
per
|
Discussion
P
a
per
|
enters the AOTF at the same angle, so the image will have a narrower spectral point spread function than the telecentric counterpart. However, each line-of-sight will be diffracted with a different fundamental central wavelength due to the angular depen-dence in the AOTF diffraction (Eq. 2). The scanned spectrum then has better spectral resolution than obtained with the telecentric system, but there will be a wavelength 5
gradient radiating out from the center of the image. Second, since light in this design passes through the AOTF collimated, the focal point of the image no longer changes with wavelength. Instead, a lateral displacement of each line-of-sight occurs based on the angle of incidence and the diffracted wavelength which causes a slight change in magnification of the final image. The lateral displacement that occurs is given by the 10
following relation
δ=(n(λ)−1) tθ
n(λ) (3)
whereδis the displacement from the original path. However, it turns out that this wave-length dependent change is negligible for the current ALI design.
In light of the requirements for imaging aerosol, we have chosen a telescopic design 15
for the ALI prototype. Since the wavelength gradient across the image is small com-pared to the slowly varying aerosol scattering cross section, the fixed image plane is preferable for the improvement it provides in spatial imaging, particularly as we desired to use as simple as possible an optical design.
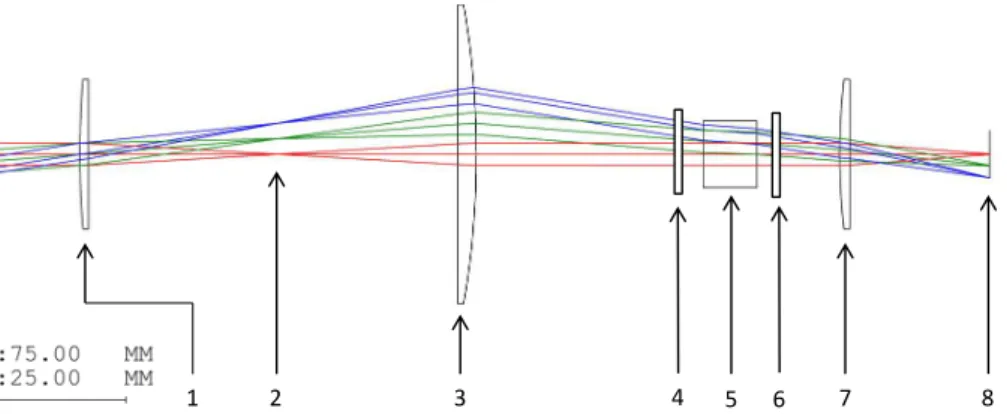
We used a very simple three lens optical layout with commercial off-the-shelf com-20
ponents. Two lenses before the AOTF form a simple telescope for the Front End Optics (FEO), and a single focusing lens behind the AOTF comprises the Back End Optics (BEO). The AOTF is oriented such that the detected image is formed from the diffracted beam of the vertically polarized, i.e. extraordinary, light (defined at the entrance aper-ture). A linear polarizer with an extinction ratio greater than 10−5is placed at the back of 25
AMTD
8, 13285–13330, 2015The Aerosol Limb Imager
B. J. Elash et al.
Title Page
Abstract Introduction
Conclusions References
Tables Figures
◭ ◮
◭ ◮
Back Close
Full Screen / Esc
Printer-friendly Version Interactive Discussion
Discussion
P
a
per
|
Discussion
P
a
per
|
Discussion
P
a
per
|
Discussion
P
a
per
|
the undiffracted beam. This is shown schematically in Fig. 2b. Note that even with the high extinction ratio of the polarizers, a not insignificant fraction of light that is in-tended to be blocked passes through the system. The diffracted extraordinary signal compresses at most a∼10 nm bandpass fraction of one polarization such that the un-absorbed broadband signal from the polarizers can be on the same order of intensity 5
as the diffracted signal.
The extraordinary diffracted light is 2.7◦from the optical axis and to compensate, the entire optical chain after the AOTF is mechanically aligned with this direction. The BEO forms the image of the signal on a QSI 616s 16 bit CCD with 1536 by 1024 pixels. A ray tracing diagram for ALI’s optical system was created using the CODE V optical design 10
software and can be seen in Fig. 4. No corrections were attempted to reduce chromatic or spherical aberrations within the system and the system exhibits some coma due the large field of view and the curvature of the lenses near the edge of the field of view. Analysis with Code V shows that the distortion due to these effects across the center two degrees of the field of view is a change of less than 1 % change across the entire 15
wavelength range. The final one degree shows a distortion of less than 4 %. An analysis was also performed to determine the minimum resolution required to achieve a Modular Transfer Function (MTF) of 0.3 across the entire field of view for all wavelengths (Smith, 2000). To obtain the MTF across the entire field of view a 7 pixel running average is required. This translates to an average vertical and horizontal resolution of 210 m 20
across the entire ALI field of view at the tangent point. A tolerance study was also performed with Code V to assess the capability of the system within the tolerances of the mounting equipment and was found that the system was insensitive to tilts and offsets within the system.
The SASKTAN-HR (Bourassa et al., 2008; Zawada et al., 2015) radiative transfer 25
AMTD
8, 13285–13330, 2015The Aerosol Limb Imager
B. J. Elash et al.
Title Page
Abstract Introduction
Conclusions References
Tables Figures
◭ ◮
◭ ◮
Back Close
Full Screen / Esc
Printer-friendly Version Interactive Discussion
Discussion
P
a
per
|
Discussion
P
a
per
|
Discussion
P
a
per
|
Discussion
P
a
per
|
exposure times. The SASKTRAN-HR model was used to compute the ratio of the mod-eled radiances from a balloon flight geometry to the ground-based geometry to scale the ground-based exposure times to those for balloon flight. The ALI entrance pupil was selected at 9.91 mm to yield flight exposure times on the order of 1 s. A summary of the optical specification for the ALI prototype is given in Table 1.
5
A long standing concern in the design of limb scatter instruments is the effective rejection of out-of-field stray light. This is due to the bright surface very near to the targeted limb in combination with the exponentially dropping limb signal with tangent altitude. For ALI test observations from the stratospheric balloon, a front end baffle was incorporated. This was designed to minimize the percentage of out-of-field light that 10
can reach the aperture without encountering at least three baffle surfaces. To further reduce the unwanted signal, each baffle maintains a height to pitch ratio greater than 0.5 (Fischer et al., 2008). The baffle is 300 mm long with a cross section of 70 mm×
70 mm and contains seven veins spaced throughout the length. The effectiveness of the baffle was measured against that of a simple aperture through laboratory testing 15
yielding an approximately 8 fold decrease in measured out-of-field stray light.
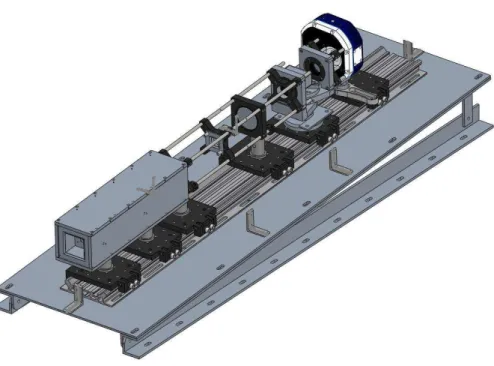
A SolidWorks rendition of the completed ALI prototype is shown in Fig. 5. The base plate of the instrument is tilted at 3◦from the horizontal so the complete 6◦vertical field of view spans from the tangent point to the ground to the float altitude once mounted on the level balloon gondola. With the simple off-the-shelf optics the operating tem-20
perature of ALI during the mission was not actively controlled, although the instrument temperature is monitored in several locations along the optical chain and at the detec-tor for later analysis. A simple covering of insulating foam with a reflective coating was used to reduce temperature extremes due to the cold ambient environment and direct solar heating.
25
AMTD
8, 13285–13330, 2015The Aerosol Limb Imager
B. J. Elash et al.
Title Page
Abstract Introduction
Conclusions References
Tables Figures
◭ ◮
◭ ◮
Back Close
Full Screen / Esc
Printer-friendly Version Interactive Discussion
Discussion
P
a
per
|
Discussion
P
a
per
|
Discussion
P
a
per
|
Discussion
P
a
per
|
and a thermal operating range of −40 to 85◦C. The onboard system provides two-way communication to a ground based station through UDP protocol and sends data, including images and housekeeping information, to the ground, as well as receives commands from ground control.
It should be noted that our choice of a telescopic optical layout for ALI is actually 5
the opposite choice of that made for the ALTIUS design, which uses a telecentric op-tical layout. For that instrument, the need for spectral resolution for trace gas retrieval makes the decision to use telecentic optics quite clear (Dekemper et al., 2012). Given that basic design difference, the overall optical specifications are quite similar between the ALI and ALITUS prototype instruments (again see Table 1 for ALI specifications), 10
although two key differences are noted. First, by using a telescopic layout the maximum field of view for ALI is determined by choosing lenses to ensure light enters ALI within the acceptance angle of the AOTF. This allows for a larger possible field of view than with a telecentric system where the field view is defined by the aperture of the AOTF. Second, the f-number for ALTIUS is 14.32 compared to 7.5 for ALI, which allows ALI 15
to increase light throughput at the cost of slightly higher aberrations in the final image. Dekemper et al. (2012) reports that the visible channel of ALTIUS was breadboarded and tested by taking ground based measurements of a smoke stack plume. They used the measurements to retrieve NO2 slant column density using 10 s exposure times; although, they note that an increase in measurement frequency would improve the in-20
strument capabilities. This also factored into our decision to use telescopic optics to increase throughout for ALI.
3 Calibration
A series of pre-flight laboratory calibrations were performed in two stages. First, the AOTF was characterized to calibrate it with respect to wavelength registration and spec-25
AMTD
8, 13285–13330, 2015The Aerosol Limb Imager
B. J. Elash et al.
Title Page
Abstract Introduction
Conclusions References
Tables Figures
◭ ◮
◭ ◮
Back Close
Full Screen / Esc
Printer-friendly Version Interactive Discussion
Discussion
P
a
per
|
Discussion
P
a
per
|
Discussion
P
a
per
|
Discussion
P
a
per
|
system to provide calibrated radiance. The following calibration measurements were performed on ALI:
– AOTF wavelength calibration
– AOTF point spread function and diffraction efficiency
– stray light calibration 5
– flat-fielding correction
3.1 AOTF wavelength calibration
The relationship between the applied acoustic wave frequency and the diffracted wave-length, which is known as the tuning curve defines the wavelength registration to the RF wave of the collected images. This was determined in the laboratory setting by filling 10
the AOTF aperture with collimated light and observing the diffracted, or filtered, signal with a HORIBA iHR320 spectrometer and Synapse 354 308 1024×256 pixel CCD. The grating used with the spectrometer had a spectral resolution of 1.2 nm, which is much less than the factory specified resolution of the ATOF. Images were taken at a constant exposure time at a set of acoustic wave radio frequencies spaced every 150 kHz from 15
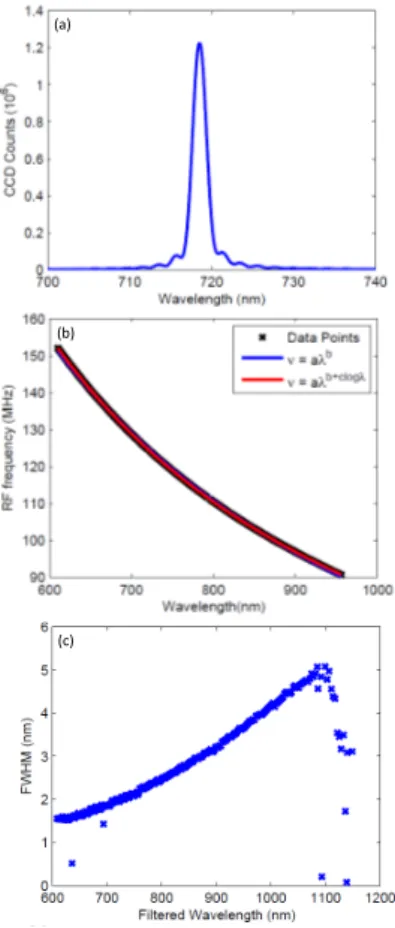
75 to 160 MHz. This corresponds to approximately one image every 1 nm. A typical spectrum recorded with the iHR320 is shown in Fig. 6a. The fringes that are visible in the spectrum in Fig. 6a are a known acousto-optic effect (Xu and Stroud, 1992) and for ALI amount to 8 to 14 % of the total signal depending on wavelength and incident angle. The maximum value of each image is then taken to be the central wavelength at 20
each respective acoustic wave frequency.
These central wavelengths for the full set of spectra were empirically found to follow a power function of the form
AMTD
8, 13285–13330, 2015The Aerosol Limb Imager
B. J. Elash et al.
Title Page
Abstract Introduction
Conclusions References
Tables Figures
◭ ◮
◭ ◮
Back Close
Full Screen / Esc
Printer-friendly Version Interactive Discussion
Discussion
P
a
per
|
Discussion
P
a
per
|
Discussion
P
a
per
|
Discussion
P
a
per
|
The fit of the data to this function form agrees to less than 0.1 % throughout the whole wavelength range such that the final tuning curve was as determined as
F =exp (19.793)λ−3.381+0.168 logλ (5)
whereλis in nanometers andF is in MHz with a 0.1 % error in the central wavelength (see Fig. 6b). It should be noted that even though the AOTF optical range is 600 to 5
1200 nm our analysis only measured wavelengths from 600 to 1080 nm due to the low quantum efficiency of the CCD beyond this range.
3.2 AOTF point spread function and diffraction efficiency
The spectral point spread function and diffraction efficiency of the AOTF were also de-termined in a similar fashion. The same set of experimental data that was used for the 10
wavelength registration was used to find the spectral point spread function by finding the full width at half maximum for each obtained spectrum. These range from 2–5 nm, increasing monotonically with wavelength, and are shown in Fig. 6c. This spectral reso-lution is well within the specification required in order to retrieve aerosol information as the aerosol scattering cross varies relatively slowly across the visible and near infrared 15
spectral range.
The same set of experimental data was also used to determine the diffraction effi -ciency of the AOTF, along with an additional measurement of the intensity of the in-cident collimated light beam. This was simply acquired by removing the AOTF from the same experimental setup. The incident light source was then measured with the 20
iHR320 spectrometer and Synapse CCD. By taking the ratio of the intensity at the diffracted wavelength to the incident intensity the diffraction efficiency was determined. It was found to vary between 54–64 % across the measured spectral range. It should be noted that the diffraction efficiency changes also with respect to incoming angle and this experimental determination only measured the diffraction efficiency at normal 25
AMTD
8, 13285–13330, 2015The Aerosol Limb Imager
B. J. Elash et al.
Title Page
Abstract Introduction
Conclusions References
Tables Figures
◭ ◮
◭ ◮
Back Close
Full Screen / Esc
Printer-friendly Version Interactive Discussion
Discussion
P
a
per
|
Discussion
P
a
per
|
Discussion
P
a
per
|
Discussion
P
a
per
|
3.3 Stray light
A laboratory experiment to characterize the stray light in the ALI system was also per-formed. Two types of stray light exist; the first is out-of-field stray light, i.e. signal that enters the optical path that originates outside of the field of view. The second is internal stray light, which is caused by scattering, reflections or other imperfections in the op-5
tical elements. As mentioned above, stray light removal is quite critical for limb scatter measurements.
The use of the AOTF has potential to increase the amount of internal stray light due to the fact that the undiffracted beam and the unmeasured polarization also propagate through the system. However, the diffraction interaction only occurs when the acoustic 10
wave signal is applied, so without the acoustic wave the recorded measurement only contains the stray light in the system. Using this characteristic, the stray light of the sys-tem was measured in the laboratory. A 250 W quartz-tungsten light source was passed through a dispersing screen and onto the entrance aperture of ALI, effectively filling the entire aperture and all angles within the field of view. Using a variety of exposure 15
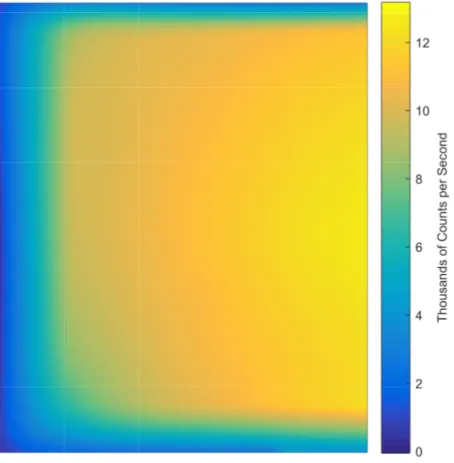
times, ranging from 0.1 to 60 s and wavelengths from 650 to 950 nm in 25 nm inter-vals, this diffuse source was imaged twice; once with the AOTF in its offstate, with no driving acoustic wave, and once with the ATOF in its on state, with the acoustic wave applied (see Fig. 2c). For each pair of measurements the image with the “AOTF-off” only contains stray light in the system, and the “AOTF-on” image contains the stray 20
light combined with the image of the diffuse source. Subtracting the “AOTF-off” image from the “AOTF-on” image yields a final image that contains only the image of the dif-fuse source. A typical example of a resulting image is shown in Fig. 7. The observed vignetting is caused by the aperture of the AOTF and is expected from the ray trace model. Note that this method also removes any dark current associated with the detec-25
AMTD
8, 13285–13330, 2015The Aerosol Limb Imager
B. J. Elash et al.
Title Page
Abstract Introduction
Conclusions References
Tables Figures
◭ ◮
◭ ◮
Back Close
Full Screen / Esc
Printer-friendly Version Interactive Discussion
Discussion
P
a
per
|
Discussion
P
a
per
|
Discussion
P
a
per
|
Discussion
P
a
per
|
3.4 Relative flat fielding calibration
The flat-field calibration corrects optical and detector level differences in the system across the field of view such that a calibrated image of a perfectly diffuse source yields a constant value across the image. The resulting images from the diffuse source de-scribed above were used to determine the flat fielding corrections for ALI. These were 5
determined in two steps: spatial and spectral. First, for the spatial correction, for each image at a given wavelength, each pixel was scaled to the mean value of the center 25×25 pixels, which had no more than a 4 % standard deviation. ALI is most sensi-tive at 775 nm so this wavelength was chosen as the reference wavelength of a relasensi-tive spectral calibration. All flat-fielding corrections were then scaled to the blackbody curve 10
of a tungsten halogen bulb normalized to 775 nm assuming an operating temperature of 3300 K for the bulb using a method by Kosch et al. (2003). No absolute calibration was performed due to lack of availability of an appropriately calibrated source.
4 Stratospheric balloon flight
4.1 Flight conditions and measurement modes
15
The Canadian Space Agency (CSA) balloon launch base is in Timmins, Ontario (48.47◦N, 81.33◦W). ALI was integrated onto a CNES pointed gondola and used on-board subsystems, including communications and power. The CNES gondola is an actively pointed gondola with azimuthal pointing precision better than 1’ with the use of an onboard star tracker. ALI was orientated so it would be maintained at 90◦ from the 20
AMTD
8, 13285–13330, 2015The Aerosol Limb Imager
B. J. Elash et al.
Title Page
Abstract Introduction
Conclusions References
Tables Figures
◭ ◮
◭ ◮
Back Close
Full Screen / Esc
Printer-friendly Version Interactive Discussion
Discussion
P
a
per
|
Discussion
P
a
per
|
Discussion
P
a
per
|
Discussion
P
a
per
|
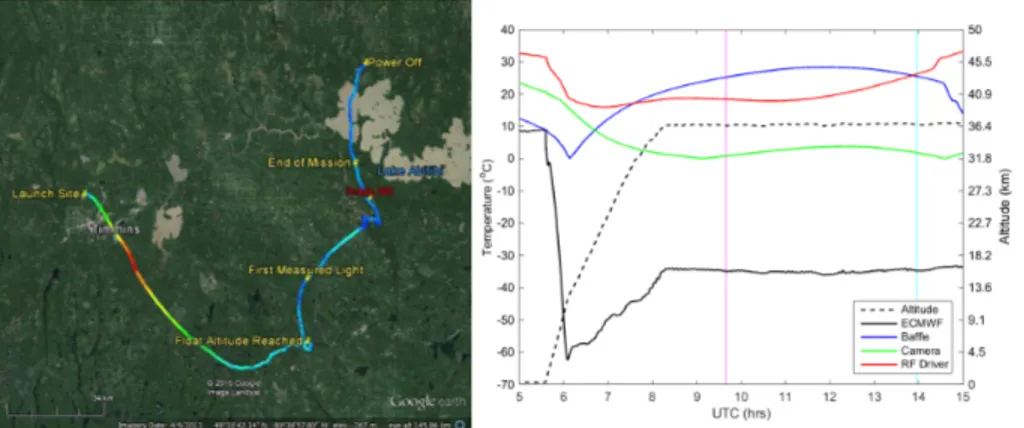
08:17 UTC. First light was observed by ALI at 09:39 UTC and spectral images were recorded until 14:42 UTC. A visualization of the flight path with major landmarks noted can be found in Fig. 8a. Temperature profiles for the ambient atmosphere and instru-ment are shown in Fig. 8b. The black curve is the ambient atmospheric temperature at the gondola altitude and location during the flight as obtained from ECMWF reanalysis 5
(Dee et al., 2011).
During the mission, ALI operated in two primary acquisition modes, a calibration mode and an aerosol imaging mode. The first mode, the calibration mode, was pri-marily used during ascent when the gondola was in the darkness and intermittently between the aerosol mode during sunlit conditions. During this mode the filtering of the 10
AOTF was not enabled and the system imaged essentially only dark current during the ascent in darkness and stray light during sunlit conditions. Eight exposures are taken in the calibration mode with 0.05, 0.1, 0.5, 1, 2, 3, 5, 10 s exposure times. The second operational mode, the aerosol mode, recorded measurements in a cycle that contained 13 pairs of images across the spectral range (650–950 nm every 25 nm), the pairs be-15
ing a calibration image with the “AOTF-off” and an image of the limb. Each cycle took approximately 12 min with each measurement set taking approximately 45 s to acquire with exposure times varying between 0.5 to 6 s.
4.2 Limb measurements
After the successful post-flight recovery of ALI, 216 raw images were obtained and cali-20
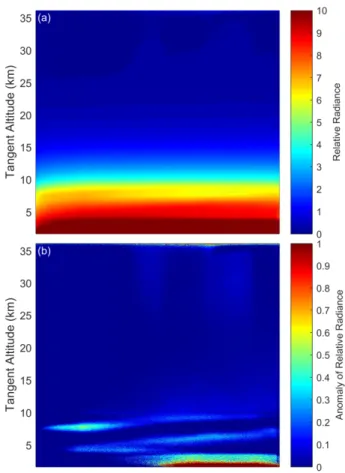
brated as detailed in Sect. 3. An example of a calibrated limb image is shown in Fig. 9a. This is image number 208 at 750 nm taken at 13:57 UTC with a solar zenith angle and solar scattering angle of 63 and 98◦ respectively. The horizontal structure across the images is nicely revealed by calculating the mean radiance profile across the image and then removing it from each profile. This is shown in Fig. 9b, where thin clouds 25
AMTD
8, 13285–13330, 2015The Aerosol Limb Imager
B. J. Elash et al.
Title Page
Abstract Introduction
Conclusions References
Tables Figures
◭ ◮
◭ ◮
Back Close
Full Screen / Esc
Printer-friendly Version Interactive Discussion
Discussion
P
a
per
|
Discussion
P
a
per
|
Discussion
P
a
per
|
Discussion
P
a
per
|
mission (B. Solheim, personal communication, 2014). A brief check on the CALIPSO quick-look plots also shows clouds at a maximum height of approximately 13 km from measurements taken at 08:40 UTC at 47.24◦N, 95.25◦W, the nearest measurement point to the ALI location and time. Although these images only have a 35 km extent in the horizontal direction, there is also some indication of horizontal variation in radiance 5
significantly above the cloud level, possibly due to real atmospheric variability in the aerosol layer. It should also be noted that some high altitude stray light is also visible in this mean residual image that was not observed in the laboratory tests. This may be due to contamination from scattering from a baffle vein or a nearby component of the gondola, although the true cause is unknown at this point.
10
For ease of further analysis, and to increase the precision of the measurements to a minimum of 0.6 MTF the images were averaged into cells of 25 pixels horizontally, and averaged vertically onto a 1 km tangent altitude grid. The radiance profiles from the center column of the images for all measurements obtained during the flight are shown in Fig. 10. The first sets of profiles, the dashed lines, which start near zero and move to-15
ward larger values, are the measurements that were recorded near and during sunrise so the gradual increase is therefore expected. Measurements obtained for solar zenith angles less than 90◦are represented by the solid lines. These radiance profiles follow a similar, and expected exponential shape, with some variability at tangent altitudes below 12 km corresponding largely to changing cloud conditions.
20
A full cycle of 13 spectral images (numbers 204–216) were used in Fig. 11 to show the spectrum of relative calibrated radiances at selected tangent altitudes. The esti-mated uncertainty in the radiance is represented by the shading. The uncertainty is approximately five percent from 5 to 20 km and increases up to eight percent from 20 to 35 km. The error term includes the CCD read, DC offset, dark current, stray light 25
AMTD
8, 13285–13330, 2015The Aerosol Limb Imager
B. J. Elash et al.
Title Page
Abstract Introduction
Conclusions References
Tables Figures
◭ ◮
◭ ◮
Back Close
Full Screen / Esc
Printer-friendly Version Interactive Discussion
Discussion
P
a
per
|
Discussion
P
a
per
|
Discussion
P
a
per
|
Discussion
P
a
per
|
spectra at 875 nm is not known and may be due to an inconsistency in the pre-flight calibration.
4.3 Retrieval methodology
As a first application of the ALI measurements, we have applied a slightly modified version of the standard OSIRIS stratospheric aerosol extinction retrieval (Bourassa 5
et al., 2012b) to the flight measurements. This inversion algorithm, which is applied from the tropopause to 30 km altitude, assumes log-normally distributed hydrated sul-phuric acid droplets in order to calculate the aerosol scattering cross sections from the Mie scattering solution (Wiscombe, 1980). The modeled radiances for the nonlinear in-version were computed with the SASKTRAN High Resolution radiative transfer engine 10
(SASKTRAN-HR) (Bourassa et al., 2008; Zawada et al., 2015) using the newly devel-oped vector module for polarization (Dueck et al., 2015). The output of SASKTRAN-HR gives the Stokes vectors for the radiance on the model reference frame, which are then rotated into the instrument’s coordinate system. Once rotated, the polarization signal required to match the ALI measurement is the vertical polarization given by
15
Iv=
1
2(I−Q) (6)
whereIandQare Stokes parameters defined byI =hEx2i+hEy2iandQ =hEx2i − hEy2i.
The variablesEx andEy are the horizontal and vertical component of the electric field in the instrument reference frame.
The relative radiance measurements from ALI are used to create measurement vec-20
tors,y, as specified in Bourassa et al. (2012b) in the form,
y=log
I
v(z,λ)
Iv(zref,λ)
−log Iv, rayleigh(z,λ) Iv, rayleigh(zref,λ)
!
(7)
whereIv(z,λ) is the measured relative radiance from ALI andIv(zref,λ) is the relative
AMTD
8, 13285–13330, 2015The Aerosol Limb Imager
B. J. Elash et al.
Title Page
Abstract Introduction
Conclusions References
Tables Figures
◭ ◮
◭ ◮
Back Close
Full Screen / Esc
Printer-friendly Version Interactive Discussion
Discussion
P
a
per
|
Discussion
P
a
per
|
Discussion
P
a
per
|
Discussion
P
a
per
|
For the ALI measurements, the highest possible tangent altitude where the signal is above the noise threshold is approximately 30 km tangent height. The second term in Eq. (7) uses modeled radiances from SASKTRAN-HR with only the molecular atmo-sphere to approximately remove the Rayleigh signal. This is done to improve the speed of the convergence of the retrieval (Bourassa et al., 2012b). An initial guess state,x, 5
for the aerosol extinction and an assumed particle size distribution profile are set in the SASKTRAN-HR model. The forward model vector is then constructed similarly to the measurement vector, and used in combination with the measurement vector to update the aerosol extinction coefficient profile using Multiplicative Algebraic Reconstruction Technique (MART) algorithm,
10
xin+1=xniX
j
yj
F zjWi j (8)
wherexi is the aerosol extinction at each model altitude, i and j denotes a tangent
altitude from the measurements.Wi j is an element of the weighting matrix that relates the importance of each element of the measurement vector to each shell altitude. This method described in detail by Bourassa et al. (2007).
15
Once a retrieval has been completed for a measured radiance profile, the result is then used to estimate the error in the retrieved extinction. For each altitude, a gain matrix,G, is calculated through successive numerical perturbation of the measurement vector and re-retrieval (Rodgers, 2000). A much faster method to use the Jacobian to determine the error has been performed (Bourassa et al., 2012a) but makes an 20
assumption that the gain matrix is equal to the inverse of the Jacobian, as typically the averaging kernel is close to the identity matrix. However, this method adds additional uncertainty to the error estimate and with a limited set of balloon data, it is possible to calculate the gain matrix directly. The error at each retrieved altitude is then given by
E=GSǫGT (9)
AMTD
8, 13285–13330, 2015The Aerosol Limb Imager
B. J. Elash et al.
Title Page
Abstract Introduction
Conclusions References
Tables Figures
◭ ◮
◭ ◮
Back Close
Full Screen / Esc
Printer-friendly Version Interactive Discussion
Discussion
P
a
per
|
Discussion
P
a
per
|
Discussion
P
a
per
|
Discussion
P
a
per
|
whereSǫis the covariance matrix of the measurement vector and Eis the covariance of the retrieved aerosol profile (Rodgers, 2000). The reported precision for ALI aerosol extinction retrievals is the square root of the diagonal ofE.
Using the retrieved extinction profiles for the complete spectral range, we have at-tempted a determination of the Angström exponent using a method similar to that 5
outlined by Rault and Loughman (2013) for the OMPS-LP analysis. In this method, the independently retrieved extinction profiles at each wavelength and altitude are fit with a straight line in log-wavelength, log-extinction space. The slope of this line cor-responds to the Angstrom exponent. This is then used to find the best match to the spectral dependence of the Mie scattering cross section in order to update the particle 10
size distribution. With only one piece of information, the mode-width of the log-normal distribution is fixed to 1.6 and the mode radius is updated. The extinction retrievals are then performed again at each wavelength and the process is iterated until the Angstrom exponent, corresponding to the determined mode radius, converges.
Ideally, the ALI measurements would be used independently to also retrieve ozone in 15
the Chappuis band. However, due to the spectral range of the prototype, only a small fraction of the long wavelength side of the absorption band was captured. For this analysis, we have not retrieved the ozone profile but have set the ozone profile in SASKTRAN-HR to an average of the five closest coincident ozone profiles measured by OSIRIS at the ALI location and time. The surface albedo used is also from the 20
OSIRIS scans since the two instruments share a similar measurement method and should determine a similar albedo for the cloudy conditions. Preferably albedo would be determined from the ALI following the method of Bourassa et al. (2012b), however due to the lack of an absolute calibration this was not possible.
4.4 Results
25
AMTD
8, 13285–13330, 2015The Aerosol Limb Imager
B. J. Elash et al.
Title Page
Abstract Introduction
Conclusions References
Tables Figures
◭ ◮
◭ ◮
Back Close
Full Screen / Esc
Printer-friendly Version Interactive Discussion
Discussion
P
a
per
|
Discussion
P
a
per
|
Discussion
P
a
per
|
Discussion
P
a
per
|
between the measurement and forward model vectors were less than 2 % for the ma-jority of the retrieval region, approximately 13 to 28 km, across all wavelengths. Note the behavior of decreasing extinction with increasing wavelength as expected due to the dependence of the cross section with respect to particle size.
The ALI 750 nm aerosol extinction profile is shown in the right panel of Fig. 12 in 5
blue with the shading representing the precision of the retrieval. The error is strictly based on measurement error and neglects any model and atmospheric state errors. The green curve is the average 750 nm aerosol extinction profiles of the same five co-incident OSIRIS scans used for the ozone profile. The retrieved extinction profiles from ALI and OSIRIS are within with the total retrieval uncertainty below 20 km. It is encour-10
aging, however, that the instruments follow the same overall profile shape including the stratospheric layer and the steep increase below 15 km. However, the OSIRIS and ALI extinctions do not agree within error between 20 to 25 km. Aerosol is notoriously dif-ficult to validate in remote sensing with various technique and instrument geometries, and yet the SAGE II, SAGE III and OSIRIS differences are generally below 20–30 % 15
up to 30 km (Bourassa et al., 2012b; Rieger et al., 2015) so the disagreement between OSIRIS and ALI from 20 to 25 km found here is somewhat puzzling. However, given the retrieved uncertainty, the OSIRIS profile is only outside the upper error bound of ALI by less than 10 %. There are also several possible systematic errors not accounted for in the inversion including the choice of retrieval altitude ranges, particle size composition 20
and distributions, stray light, and the high altitude aerosol load. This is also the first polarized limb scatter retrieval to our knowledge and so there may be further issues to explore with the polarized measurement and forward model. Regardless, the results are encouraging.
The particle size method outlined above was also applied to this measurement set. 25
AMTD
8, 13285–13330, 2015The Aerosol Limb Imager
B. J. Elash et al.
Title Page
Abstract Introduction
Conclusions References
Tables Figures
◭ ◮
◭ ◮
Back Close
Full Screen / Esc
Printer-friendly Version Interactive Discussion
Discussion
P
a
per
|
Discussion
P
a
per
|
Discussion
P
a
per
|
Discussion
P
a
per
|
The first panel of Fig. 13 shows the median Angström exponent that was determined after each iteration and convergence can be seen after a couple iterations. The results are shown in the second panel of Fig. 13, where the Angström exponent is between 2 and 3 throughout the altitude range from 13 to 22 km. Assuming a mode width of 1.6 yields a median mode radius of 0.077 µm. In comparison to typical levels of background 5
aerosol from the Laramie, Wyoming OPC data (Deshler et al., 2003) the retrieved parti-cle size parameters are certainly within an expected range, although there is a relatively large error bar on the retrieved value, limiting the usefulness of the retrieved particle size information for background aerosol. However, with these error bars, even this lim-ited spectral range would have the sensitivity to detected particle size changes as 10
seen by OSIRIS and SAGE II over recent decades due to small volcanic perturbations (Rieger et al., 2014).
5 Conclusions
The ALI prototype, which is telescopic acousto-optic imager, has been used to success-fully measure two dimensional spectral images of the atmospheric limb from strato-15
spheric balloon. The observed radiances appear to be of high quality and show both vertical and horizontal features of the cloud and aerosol layers. Aerosol extinction co-efficient profiles were retrieved from the ALI data that show reasonable agreement with OSIRIS satellite measurements.
No large scale issues were found with the instrument performance; however, some 20
future changes would be recommended. First, an absolute calibration of the instrument would allow ALI to determine the effect albedo directly, as is done with OSIRIS. This would remove some of the uncertainty in the model inputs and likely yield higher quality results. This is simply a matter of having access to the calibration equipment. Also, even with the baffle and the robust method of removing stray light with the cycling 25
AMTD
8, 13285–13330, 2015The Aerosol Limb Imager
B. J. Elash et al.
Title Page
Abstract Introduction
Conclusions References
Tables Figures
◭ ◮
◭ ◮
Back Close
Full Screen / Esc
Printer-friendly Version Interactive Discussion
Discussion
P
a
per
|
Discussion
P
a
per
|
Discussion
P
a
per
|
Discussion
P
a
per
|
Acknowledgements. This work would have not been possible without funding from the CSA to design and build ALI through the FAST program as well as the CSA building and managing the launch facility in Timmins, Ontario. Also, thanks to CNES for funding and overseeing the launches at Timmins in 2014. The optical design analysis was performed in thanks to Synopsys for the use of a Code V software license. The CALIPSO data were obtained from the NASA
5
Langley Research Center Atmospheric Science Data Center. As well, thanks to Nick Lloyd for help in development of the flight code, without his efforts this work would have not been accomplished.
References
Andersson, S. M., Martinsson, B. G., Vernier, J.-P., Friberg, J., Brenninkmeijer, C. A.,
Her-10
mann, M., van Velthoven, P. F., and Zahn, A.: Significant radiative impact of volcanic aerosol in the lowermost stratosphere, Nature, 6, 7692, doi:10.1038/ncomms8692, 2015.
Beuttell, R. G. and Brewer, A. W.: Instruments for the measurement of the visual range, J. Sci. Instrum., 26, 357–359, doi:10.1088/0950-7671/26/11/302, 1949.
Bourassa, A. E., Degenstein, D. A., Gattinger, R. L., and Llewellyn, E. J.: Stratospheric
15
aerosol retrieval with optical spectrograph and infrared imaging system limb scatter mea-surements, J. Geophys. Res., 112, D10217, doi:10.1029/2006JD008079, 2007.
Bourassa, A. E., Degenstein, D. A., and Llewellyn, E. J.: SASKTRAN: a spherical geometry radiative transfer code for efficient estimation of limb scattered sunlight, J. Quant. Spectrosc. Ra., 109, 52–73, doi:10.1016/j.jqsrt.2007.07.007, 2008.
20
Bourassa, A. E., McLinden, C. A., Bathgate, A. F., Elash, B. J., and Degenstein, D. A.: Pre-cision estimate for Odin-OSIRIS limb scatter retrievals, J. Geophys. Res., 117, D04303, doi:10.1029/2011JD016976, 2012a.
Bourassa, A. E., Rieger, L. A., Lloyd, N. D., and Degenstein, D. A.: Odin-OSIRIS stratospheric aerosol data product and SAGE III intercomparison, Atmos. Chem. Phys., 12, 605–614,
25
doi:10.5194/acp-12-605-2012, 2012b.
AMTD
8, 13285–13330, 2015The Aerosol Limb Imager
B. J. Elash et al.
Title Page
Abstract Introduction
Conclusions References
Tables Figures
◭ ◮
◭ ◮
Back Close
Full Screen / Esc
Printer-friendly Version Interactive Discussion
Discussion
P
a
per
|
Discussion
P
a
per
|
Discussion
P
a
per
|
Discussion
P
a
per
|
Bourassa, A. E., Robock, A., Randel, W. J., Deshler, T., Rieger, L. A., Lloyd, N. D., Llewellyn, E., and Degenstein, D. A.: Response to comments on “Large volcanic aerosol load in the strato-sphere linked to Asian monsoon transport”, Science, 339, 647–647, 2013.
Bovensmann, H., Burrows, J., Buchwitz, M., Frerick, J., Noël, S., Rozanov, V., Chance, K., and Goede, A.: SCIAMACHY: mission objectives and measurement modes, J. Atmos. Sci., 56,
5
127–150, 1999.
Charlson, R. J., Ahlquist, N., Selvidge, H., and MacCready Jr., P.: Monitoring of atmospheric aerosol parameters with the integrating nephelometer, JAPCA J. Air Waste Ma., 19, 937– 942, 1969.
Chazette, P., David, C., Lefrere, J., Godin, S., Pelon, J., and Mégie, G.: Comparative lidar study
10
of the optical, geometrical, and dynamical properties of stratospheric postvolcanic aerosols, following the eruptions of el chichon and mount pinatubo, J. Geophys. Res., 100, 23–195, 1995.
Cisewski, M., Zawodny, J., Gasbarre, J., Eckman, R., Topiwala, N., Rodriguez-Alvarez, O., Cheek, D., and Hall, S.: The stratospheric aerosol and gas experiment (SAGE III)
15
on the international space station (ISS) mission, Proc. SPIE, 9241, 924107–924107-7, doi:10.1117/12.2073131, 2014.
Clarisse, L., Coheur, P.-F., Theys, N., Hurtmans, D., and Clerbaux, C.: The 2011 Nabro eruption, a SO2 plume height analysis using IASI measurements, Atmos. Chem. Phys., 14, 3095– 3111, doi:10.5194/acp-14-3095-2014, 2014.
20
Damadeo, R. P., Zawodny, J. M., Thomason, L. W., and Iyer, N.: SAGE version 7.0 algorithm: application to SAGE II, Atmos. Meas. Tech., 6, 3539–3561, doi:10.5194/amt-6-3539-2013, 2013.
Dee, D. P., Uppala, S. M., Simmons, A. J., Berrisford, P., Poli, P., Kobayashi, S., Andrae, U., Balmaseda, M. A., Balsamo, G., Bauer, P., Bechtold, P., Beljaars, A. C. M., van de Berg, L.,
25
Bidlot, J., Bormann, N., Delsol, C., Dragani, R., Fuentes, M., Geer, A. J., Haimberger, L., Healy, S. B., Hersbach, H., Hlm, E. V., Isaksen, L., Kllberg, P., Khler, M., Matricardi, M., McNally, A. P., Monge-Sanz, B. M., Morcrette, J.-J., Park, B.-K., Peubey, C., de Ros-nay, P., Tavolato, C., Thpaut, J.-N., and Vitart, F.: The ERA-interim reanalysis: configuration and performance of the data assimilation system, Q. J. Roy. Meteor. Soc., 137, 553–597,
30
doi:10.1002/qj.828, 2011.
AMTD
8, 13285–13330, 2015The Aerosol Limb Imager
B. J. Elash et al.
Title Page
Abstract Introduction
Conclusions References
Tables Figures
◭ ◮
◭ ◮
Back Close
Full Screen / Esc
Printer-friendly Version Interactive Discussion
Discussion
P
a
per
|
Discussion
P
a
per
|
Discussion
P
a
per
|
Discussion
P
a
per
|
Tunable acousto-optic spectral imager for atmospheric composition measurements in the visible spectral domain, Appl. Optics, 51, 6259–6267, doi:10.1364/AO.51.006259, 2012. Deshler, T., Hervig, M., Hofmann, D., Rosen, J., and Liley, J.: Thirty years of in situ stratospheric
aerosol size distribution measurements from Laramie, Wyoming (41 N), using balloon-borne instruments, J. Geophys. Res., 108, 4167, doi:10.1029/2002JD002514, 2003.
5
Deshler, T., Anderson-Sprecher, R., Jger, H., Barnes, J., Hofmann, D. J., Clemesha, B., Si-monich, D., Osborn, M., Grainger, R. G., and Godin-Beekmann, S.: Trends in the nonvol-canic component of stratospheric aerosol over the period 1971–2004, J. Geophys. Res., 111, D01201, doi:10.1029/2005JD006089, 2006.
Dueck, S. R., Bourassa, A. E., and Degenstein, D. A.: Polarization in the SASKTRAN radiative
10
transfer framework, in preparation, 2015.
Ernst, F., von Savigny, C., Rozanov, A., Rozanov, V., Eichmann, K.-U., Brinkhoff, L. A., Bovensmann, H., and Burrows, J. P.: Global stratospheric aerosol extinction profile retrievals from SCIAMACHY limb-scatter observations, Atmos. Meas. Tech. Discuss., 5, 5993–6035, doi:10.5194/amtd-5-5993-2012, 2012.
15
Fairlie, T. D., Vernier, J.-P., Natarajan, M., and Bedka, K. M.: Dispersion of the Nabro volcanic plume and its relation to the Asian summer monsoon, Atmos. Chem. Phys., 14, 7045–7057, doi:10.5194/acp-14-7045-2014, 2014.
Fischer, R. E., Tadic-Galeb, B., and Yoder, P. R.: Optical System Design, 2nd Edn., McGraw-Hill, New York, USA, 2008.
20
Fromm, M., Nedoluha, G., and Charvt, Z.: Comment on “Large volcanic aerosol load in the stratosphere linked to Asian monsoon transport”, Science, 339, p. 647, doi:10.1126/science.1228605, 2013.
Fromm, M., Kablick, G., Nedoluha, G., Carboni, E., Grainger, R., Campbell, J., and Lewis, J.: Correcting the record of volcanic stratospheric aerosol impact: nabro and sarychev peak, J.
25
Geophys. Res., 119, 10343–10364, doi:10.1002/2014JD021507, 2014.
Fyfe, J. C., Gillett, N. P., and Zwiers, F. W.: Overestimated global warming over the past 20 years, Nature Climate Change, 3, 767–769, 2013.
Georgiev, G., Glenar, D. A., and Hillman, J. J.: Spectral characterization of acousto-optic filters used in imaging spectroscopy, Appl. Optics, 41, 209–217, doi:10.1364/AO.41.000209, 2002.
30