ACPD
13, 21345–21382, 2013A novel tropopause-related climatology of ozone
profiles
V. F. Sofieva et al.
Title Page
Abstract Introduction
Conclusions References
Tables Figures
◭ ◮
◭ ◮
Back Close
Full Screen / Esc
Printer-friendly Version Interactive Discussion
Discussion
P
a
per
|
D
iscussion
P
a
per
|
Discussion
P
a
per
|
Discuss
ion
P
a
per
|
Atmos. Chem. Phys. Discuss., 13, 21345–21382, 2013 www.atmos-chem-phys-discuss.net/13/21345/2013/ doi:10.5194/acpd-13-21345-2013
© Author(s) 2013. CC Attribution 3.0 License.
Atmospheric Chemistry and Physics
Open Access
Discussions
Geoscientiic Geoscientiic
Geoscientiic Geoscientiic
This discussion paper is/has been under review for the journal Atmospheric Chemistry and Physics (ACP). Please refer to the corresponding final paper in ACP if available.
A novel tropopause-related climatology of
ozone profiles
V. F. Sofieva1, J. Tamminen1, E. Kyrölä1, T. Mielonen2, P. Veefkind2,3, B. Hassler4,5, and G. E. Bodeker6
1
Finnish Meteorological Institute, Helsinki, Finland
2
Royal Netherlands Meteorological Institute (KNMI), De Bilt, the Netherlands
3
Delft University of Technology, Faculty of Civil Engineering and Geosciences Department of Geoscience and Remote Sensing, Delft, the Netherlands
4
CIRES, University of Colorado, Boulder, USA
5
NOAA, ESRL, Chemical Sciences Division, Boulder, USA
6
Bodeker Scientific, Central Otago, New Zealand
Received: 10 July 2013 – Accepted: 2 August 2013 – Published: 16 August 2013
Correspondence to: V. F. Sofieva (viktoria.sofieva@fmi.fi)
ACPD
13, 21345–21382, 2013A novel tropopause-related climatology of ozone
profiles
V. F. Sofieva et al.
Title Page
Abstract Introduction
Conclusions References
Tables Figures
◭ ◮
◭ ◮
Back Close
Full Screen / Esc
Printer-friendly Version Interactive Discussion
Discussion
P
a
per
|
D
iscussion
P
a
per
|
Discussion
P
a
per
|
Discuss
ion
P
a
per
|
Abstract
A new ozone climatology, based on ozonesonde and satellite measurements, spanning
the altitude region between the Earth’s surface and∼60 km is presented (TpO3
clima-tology). This climatology is novel in that the ozone profiles are categorized according to calendar month, latitude and local tropopause heights. Compared to the standard 5
latitude-month categorization, this presentation improves the representativeness of the ozone climatology in the upper troposphere and the lower stratosphere (UTLS). The probability distribution of tropopause heights in each latitude-month bin provides
addi-tional climatological information and allows transforming/comparing the TpO3
climatol-ogy to a standard climatolclimatol-ogy of zonally mean ozone profiles. The TpO3 climatology
10
is based on high-vertical-resolution measurements of ozone from the satellite-based Stratospheric Aerosol and Gas Experiment II (in 1984 to 2005) and from balloon-borne ozonesondes in 1980 to 2006.
The main benefits of the TpO3climatology are reduced standard deviations on
clima-tological ozone profiles in the UTLS, partial characterization of longitudinal variability, 15
and characterization of ozone profiles in the presence of double tropopauses.
The first successful application of the TpO3 climatology as a priori in ozone profiles
retrievals from Ozone Monitoring Instrument on board the EOS-Aura satellite shows an improvement of ozone precision in UTLS of up to 10 % compared with the use of conventional climatologies.
20
In addition to being advantageous for use as a priori in satellite retrieval algorithms,
the TpO3climatology might be also useful for validating the representation of ozone in
climate model simulations.
1 Introduction
The tropopause is the boundary between the troposphere and the stratosphere, two 25
atmospheric layers that have dramatically different thermal stratification, static stability,
ACPD
13, 21345–21382, 2013A novel tropopause-related climatology of ozone
profiles
V. F. Sofieva et al.
Title Page
Abstract Introduction
Conclusions References
Tables Figures
◭ ◮
◭ ◮
Back Close
Full Screen / Esc
Printer-friendly Version Interactive Discussion
Discussion
P
a
per
|
D
iscussion
P
a
per
|
Discussion
P
a
per
|
Discuss
ion
P
a
per
|
and the chemical composition. The tropopause is often considered as a transition re-gion (or so-called mixing layer) between the upper troposphere and lower stratosphere rather than a barrier at a single altitude (Hoor et al., 2002; Kunz et al., 2009; Pan et al., 2004), whose thickness is not uniform over the globe (Feng et al., 2012). The location
of the tropopause can be defined in different ways (see reviews (Gettelman et al., 2011;
5
Hoerling et al., 1991) and references therein). The most used definitions are a thermal tropopause based on temperature lapse-rate criteria and a dynamic tropopause based on potential vorticity criteria. While the definition of the lapse-rate/thermal tropopause (WMO, 1957) has remained unchanged for more than a half of century, the thresh-olds on potential vorticity gradients used in the dynamical tropopause definition are 10
still a matter of debates (Gettelman et al., 2011, and references therein). The thermal tropopause determined by the WMO definition is often multivalued, even in the clima-tology. The morphology of double and multiple tropopauses is the subject of active recent research (Añel et al., 2008; Peevey et al., 2012; Randel et al., 2007).
Ozone abundances in the stratosphere are more than an order of magnitude greater 15
than in the troposphere, thus variations in the tropopause height are mostly responsible for large variability in climatological ozone values in the upper troposphere and lower stratosphere (UTLS) in pressure-level/sea-level-referenced climatologies (e.g., Fortuin and Kelder, 1998; McPeters et al., 2007). The tropopause-referenced ozone climatolo-gies of e.g Logan (1999), Wang et al. (2006), Thouret et al. (2006), Wei et al. (2010), 20
Tilmes et al. (2010, 2012) are characterized by a reduced variability in the UTLS com-pared to sea-level referenced climatologies.
The tropopause-referenced climatologies better reflect the steep vertical gradient in ozone across the tropopause and a smaller ozone variance resulting from day-to-day meteorological variability in the UTLS region. However, there are two main problems 25
associated with the tropopause-referenced representation of an ozone climatology. First, ozone profiles cannot be considered as simply statically vertically shifted with
re-spect to each other as a result of differences in their respective tropopause heights. For
Antarc-ACPD
13, 21345–21382, 2013A novel tropopause-related climatology of ozone
profiles
V. F. Sofieva et al.
Title Page
Abstract Introduction
Conclusions References
Tables Figures
◭ ◮
◭ ◮
Back Close
Full Screen / Esc
Printer-friendly Version Interactive Discussion
Discussion
P
a
per
|
D
iscussion
P
a
per
|
Discussion
P
a
per
|
Discuss
ion
P
a
per
|
tica, which is induced by quasi-stationary planetary wave number 1, is a climatological feature (Evtushevsky et al., 2008; Grytsai et al., 2005, 2007; Ialongo et al., 2011). Be-cause of chemically-induced ozone destruction, profiles measured inside and outside
the Antarctic polar vortex are very different. Since the location of the tropopause over
Antarctica is influenced by the temperature of the lower stratosphere, low ozone abun-5
dances in some region are associated with a high tropopause and vice versa (exam-ples of ozone and temperature profiles are given in Evtushevsky et al., 2008). Second, double tropopauses are a rather common feature in the extratropics (Pan et al., 2009; Peevey et al., 2012), where UTLS ozone displays a characteristic vertical structure (Pan et al., 2004; Randel et al., 2007).
10
A tropopause-sensitive ozone climatology is better suited for use as a priori in ozone profile retrievals from satellite nadir-looking instruments. For example, Wei et al. (2010) have demonstrated a significant improvement in the retrievals from the Atmospheric In-frared Sounder (AIRS) when using a tropopause-referenced ozone profile climatology as a priori. Currently, most retrieval algorithms use the sea-level referenced ozone cli-15
matology of McPeters et al. (2007) (hereafter referred to as the LLM climatology as in the original paper), which is based on ozonesonde data and satellite-based mea-surements from the Stratospheric Aerosol and Gas Experiment II (SAGE-II) and the Microwave Limb Sounder (MLS) on board the UARS satellite.
In this study, a new way of generating ozone climatology is introduced: more than 20
a single mean ozone profile is derived for each latitude zone/month. Rather, each mean ozone profile is derived from all the profiles in that latitude-month bin, which have a certain tropopause height (i.e., the profiles are further disaggregated by tropopause height). The ozone climatology created in such a way is sensitive to the variability in-duced by changes in tropopause height. It has therefore a better characterization of 25
the vertical distribution of ozone across the UTLS and of the ozone structure in cases of double tropopauses.
The paper is organized as follows. Section 2 briefly describes the data used for the analysis. Section 3 presents the data processing and the tropopause statistics derived
ACPD
13, 21345–21382, 2013A novel tropopause-related climatology of ozone
profiles
V. F. Sofieva et al.
Title Page
Abstract Introduction
Conclusions References
Tables Figures
◭ ◮
◭ ◮
Back Close
Full Screen / Esc
Printer-friendly Version Interactive Discussion
Discussion
P
a
per
|
D
iscussion
P
a
per
|
Discussion
P
a
per
|
Discuss
ion
P
a
per
|
from the ozonesonde and SAGE-II/NCEP data. Section 4 describes the method for combining/merging climatologies from the ozonesonde and satellite measurements. Section 5 describes the ozone morphology in the new tropopause-related climatology and presents comparisons with the LLM climatology. The advantages of using the new climatology in satellite retrievals are demonstrated in Sect. 6. A discussion and sum-5
mary conclude the paper.
2 Data
For reliable characterization of the vertical distribution of ozone in the UTLS, accurate and high-vertical-resolution data are required. To create a linked ozone-tropopause
climatology (hereafter referred to as the TpO3 climatology), ozone profiles from
10
ozonesondes and the SAGE-II satellite instrument were used.
2.1 Ozonesondes
Ozonesonde measurements for the period 1980 to 2006 were extracted from the Bi-nary Data Base of Profiles (BDBP) (Hassler et al., 2008). The list of ozone stations can be found in Table A1 in (Hassler et al., 2008). The BDBP includes more ozonesonde 15
data than were used in the creation of the LLM climatology (35 928 ozone profiles from 136 stations used in our study compared to 23 400 ozone profiles from 36 stations used for the LLM climatology). However, the longitudinal coverage by ozonesonde measure-ments remains highly non-uniform. Both the ozone and temperature profiles in BDBP are interpolated onto a 1 km grid. Despite the degraded vertical resolution compared to 20
the original ozonesonde data (∼80–100 m for ozone and 10–50 m for temperature),
this resolution is sufficient for accurate determining the position of the tropopause
ACPD
13, 21345–21382, 2013A novel tropopause-related climatology of ozone
profiles
V. F. Sofieva et al.
Title Page
Abstract Introduction
Conclusions References
Tables Figures
◭ ◮
◭ ◮
Back Close
Full Screen / Esc
Printer-friendly Version Interactive Discussion
Discussion
P
a
per
|
D
iscussion
P
a
per
|
Discussion
P
a
per
|
Discuss
ion
P
a
per
|
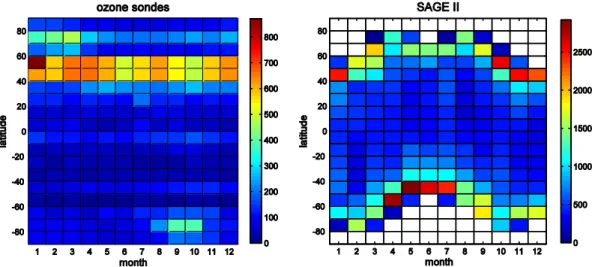
measurement noise, as pointed by (Homeyer et al., 2010). In this study, the ozone profile statistics are presented for each tropopause height in 1 km bins consistent with the vertical resolution of the data extracted from the BDBP. The number of available ozonesonde data is highly location and season dependent (Fig. 1, left). Data availabil-ity is largest over Northern Hemisphere (NH) mid-latitudes. In polar regions, more data 5
are available in winter and spring.
2.2 SAGE-II
SAGE-II is a solar occultation instrument on board Earth Radiation Budget Satellite (ERBS), which operated between 1984 and 2005. Version 6.2 SAGE-II data (Wang et al., 2006), http://www-sage2.larc.nasa.gov/Version6-2Data.html, are used in our 10
study. These data are provided on 0.5 km altitude grid. SAGE-II data have good vertical resolution, a very good precision in the stratosphere (estimated precision is 0.5–2 %), and they have a very small bias with respect to ozonesonde data (Wang et al., 2002). The temperature profiles, which are included in the SAGE-II dataset for each occul-tation, are taken from National Centers for Environmental Prediction (NCEP) reanal-15
ysis data. The temperature profiles are presented on the same 0.5 km grid as ozone
profiles; they have the vertical resolution∼1.5–2 km in UTLS. The data screening as
described in (Hassler et al., 2008) was applied to the data. In addition, all data affected
by the Mt. Pinatubo volcanic eruption were excluded. The SAGE-II data coverage is
displayed in the right-hand panel of Fig. 1. The latitudes poleward of 80◦, as well as the
20
polar night regions, are not sampled by SAGE-II.
3 Data processing and the statistics of tropopauses
In this analysis, the World Meteorological Organization (WMO) definition of the lapse-rate tropopause has been used (WMO, 1957), viz. the (first) tropopause is defined as
the lowest level above the 500 hPa level where the lapse rate decreases to 2 K km−1
25
ACPD
13, 21345–21382, 2013A novel tropopause-related climatology of ozone
profiles
V. F. Sofieva et al.
Title Page
Abstract Introduction
Conclusions References
Tables Figures
◭ ◮
◭ ◮
Back Close
Full Screen / Esc
Printer-friendly Version Interactive Discussion
Discussion
P
a
per
|
D
iscussion
P
a
per
|
Discussion
P
a
per
|
Discuss
ion
P
a
per
|
or less, provided also the average lapse rate between this level and all higher levels
within 2 km does not exceed 2 K km−1. If above the first tropopause the average lapse
rate between any level and all higher levels within 1 km exceeds 3 K km−1
, then a sec-ond tropopause is identified in the same way as the first tropopause. This definition is clear and simple in implementation and, as a result, has been used in many studies 5
(Gettelman et al. (2011) and references therein). To account for the lower vertical res-olution of the NCEP temperature profiles provided with SAGE-II data, a lapse rate of
2 K km−1is used instead of 3 K km−1in the original WMO definition, as recommended
by Randel et al. (2007).
The tropopause was detected for each ozonesonde and SAGE-II profile. Then for 10
each 10◦ latitudinal bin, and for each month, the ozone profiles were grouped
accord-ing to tropopause height in 1 km intervals, and the mean ozone profile and variability (characterized by the standard deviation of the distribution) were computed. This anal-ysis was performed separately for the ozonesonde data and for the SAGE-II data. As a result, for each latitude-month bin, several climatological ozone profiles are created, 15
each corresponding to a certain tropopause height. As part of the analysis, the distri-bution of tropopause height in each latitude-month bin (which can be considered as a tropopause height climatology) is also derived. This experimental probability distri-bution of tropopause heights (i.e., the percentage of observations having tropopause heights in each 1 km bin) are stored thereby giving additional information that allows 20
downgrading/comparing of the ozone-tropopause climatology to the standard clima-tology of zonally mean ozone profiles. Below we discuss the derived statistics of tropopauses.
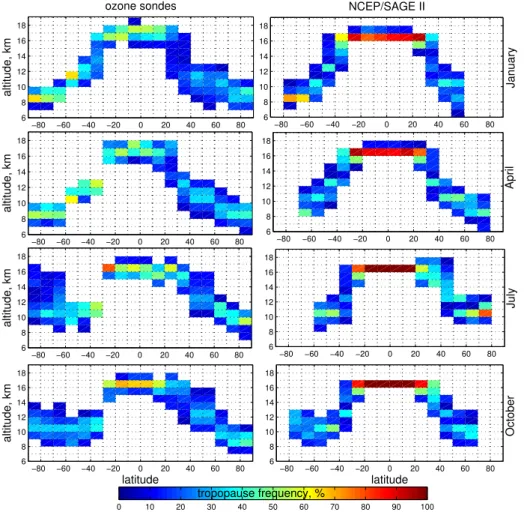
The histograms of tropopause heights (single tropopauses) for different latitudes and
seasons are shown in Fig. 2, for ozonesondes (left column) and NCEP temperature 25
ACPD
13, 21345–21382, 2013A novel tropopause-related climatology of ozone
profiles
V. F. Sofieva et al.
Title Page
Abstract Introduction
Conclusions References
Tables Figures
◭ ◮
◭ ◮
Back Close
Full Screen / Esc
Printer-friendly Version Interactive Discussion
Discussion
P
a
per
|
D
iscussion
P
a
per
|
Discussion
P
a
per
|
Discuss
ion
P
a
per
|
of different temporal and spatial sampling of SAGE-II and ozonesonde data (as
dis-cussed, e.g., by Tilmes et al., 2012), or different vertical resolution of ozonesonde and
NCEP temperature profiles.
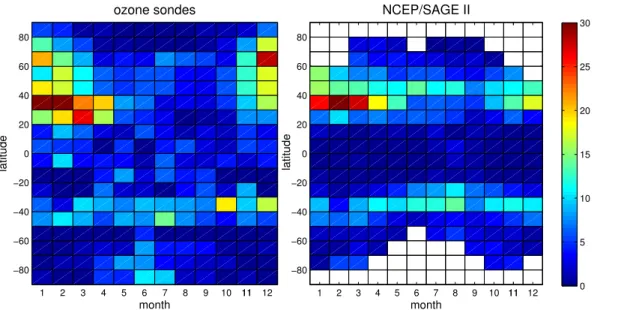
The percentages of double tropopause occurrence for each latitudinal bin and month are shown in Fig. 3, for ozonesondes and NCEP temperature profiles at SAGE-II occul-5
tation locations. Overall, a good agreement between these two datasets is observed. Double tropopauses are frequent in the extratropics in winter and spring, especially in the Northern Hemisphere, as reported in (Añel et al., 2008; Peevey et al., 2012; Randel et al., 2007). This double tropopause structure may be associated with stratosphere-troposphere exchange (Pan et al., 2009). In the ozonesonde data, a large percentage 10
of double tropopause is observed in winter at NH high latitudes (which is again in agreement with Randel et al., 2007). The percentage of double tropopause occurrence is slightly smaller in NCEP-SAGE-II data than in ozonesonde data, which might be
attributed to different vertical resolution and/or different spatio-temporal sampling.
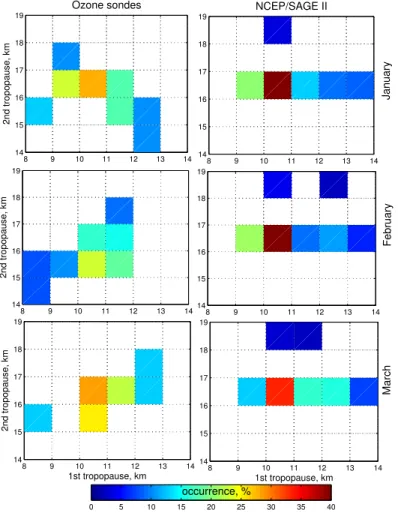
The ozone profile characterization in double tropopause conditions is performed 15
only for locations and months where and when double tropopause occurrence ex-ceeds 20 %. First, the histogram of the first tropopause height was computed using 1 km altitude bins, and the representative cases (with more than 5 measurements) were selected. Then, for each bin of the first tropopause, the histogram for the second tropopause height was computed first using 1 km altitude bins and then, if no bins with 20
more then 5 measurements are found, 2 km bins are used. Finally, the representative cases of the first and second tropopause altitudes are selected and ozone profiles are averaged for these cases. The examples of double tropopause statistics are shown in Fig. 4. Some discrepancy between the statistics of double tropopauses calculated using the ozonesonde and the NCEP data is observed. In addition to the reasons men-25
tioned above (different sampling and vertical resolutions), smaller data subsamples
corresponding to double tropopauses might contribute to the observed discrepancy.
ACPD
13, 21345–21382, 2013A novel tropopause-related climatology of ozone
profiles
V. F. Sofieva et al.
Title Page
Abstract Introduction
Conclusions References
Tables Figures
◭ ◮
◭ ◮
Back Close
Full Screen / Esc
Printer-friendly Version Interactive Discussion
Discussion
P
a
per
|
D
iscussion
P
a
per
|
Discussion
P
a
per
|
Discuss
ion
P
a
per
|
4 Creating the TpO3climatology
Ozone climatologies incorporating information about tropopause height, which were created separately using ozonesonde and SAGE-II data, are merged into one, inter-related ozone and tropopause height climatology covering the altitude range from the Earth’s surface up to 60 km. In this section, we describe the method used for merging 5
the ozonesonde and satellite climatologies. Depending on availability of SAGE-II data,
different approaches are used.
4.1 Cases when SAGE-II data are not available
For the locations and months when SAGE-II data are not available, a linear transition of climatological ozonesonde profiles to the LLM climatology using the 20–28 km alti-10
tude interval is applied. Since the LLM climatology represents ozone mixing ratios on a pressure altitude grid (McPeters et al., 2007), the ozonesonde profiles are also pre-sented on such a grid using the pressure data from the corresponding radiosonde. The
transformation to pressure altitudez is straightforward using the hydrostatic equation
in the standard atmosphere:z=16 log10(P0/P), whereP0=1013 hPa is the standard
15
pressure and P is pressure in hPa. However, the analysis of tropopauses was
per-formed using geometric altitudes. Since the pressure altitude and geometric altitude
do not differ much in the UTLS (the difference is less than 1 km), and because the
tropopause heights are binned in 1 km intervals, this transformation does not result in any considerable inaccuracy.
20
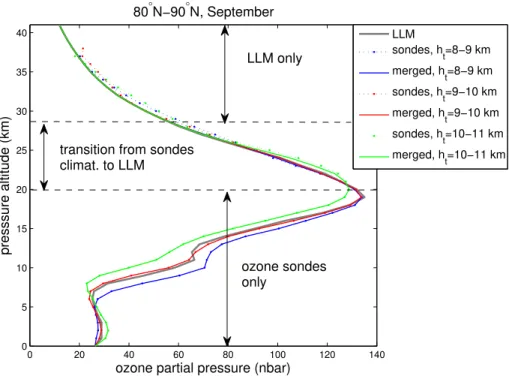
The smooth transition from ozonesondes to LLM is performed in the same way as it is done in creating the LLM climatology (McPeters et al., 2007): the weighting of the ozonesonde profile decreases linearly from 100 % at 20 km to 0 % at 28 km. The tran-sition of the standard deviations is transformed in the same way as the ozone mixing ratios. Figure 5 illustrates the data merging when SAGE-II data are not available, using 25
the data between 80◦N and 90◦N in September as an example. For better
ACPD
13, 21345–21382, 2013A novel tropopause-related climatology of ozone
profiles
V. F. Sofieva et al.
Title Page
Abstract Introduction
Conclusions References
Tables Figures
◭ ◮
◭ ◮
Back Close
Full Screen / Esc
Printer-friendly Version Interactive Discussion
Discussion
P
a
per
|
D
iscussion
P
a
per
|
Discussion
P
a
per
|
Discuss
ion
P
a
per
|
in subsequent figures). The altitude range 20–28 km, where the linear transition from ozonesonde climatological profiles to LLM profiles is performed, is indicated in this figure.
4.2 Cases when SAGE-II data are available
Since satellite data have good spatial coverage, it is advantageous to use them over 5
the widest possible altitude range. As mentioned above, SAGE-II data have a very good precision in the stratosphere and a very small bias with respect to ozonesonde data (Wang et al., 2002). However, in the troposphere SAGE-II data are systematically biased low and exhibit lower precision than in the stratosphere data (Wang et al., 2002, 2006). Therefore SAGE-II data have only been used at and above the tropopause. 10
4.2.1 Single tropopause
For each 10◦latitude zone used in the analyses, there are tropopause heights that are
present in both ozonesonde and SAGE-II/NCEP climatologies, but there might also be some tropopause heights that are presented only in one of the datasets (ozonesonde or SAGE-II). Where data from one source is missing, a transition to a climatological 15
profile, either at lower or upper altitudes, is needed. Since such a transition to LLM (or, more generally, to any monthly mean) may induce erroneous profiles (this is especially relevant for polar Southern Hemisphere in winter and spring), only those tropopause heights are used that are available in both SAGE-II and ozonesonde climatologies.
Ozonesonde data are used below the altitude h0=max(ht, 10 km), where ht is the
20
tropopause height. A merging of ozonesonde and SAGE-II profiles is performed at
altitudes fromh0to 28 km as described below, with a smooth transition to SAGE-II data
over the altitude range 20–28 km. At altitudes from h0 to 28 km, the merged
sonde-SAGE-II ozone profile is calculated as
¯
ρ=Nsoρ¯so+NSAρ¯SA Nso+NSA
, (1)
25
ACPD
13, 21345–21382, 2013A novel tropopause-related climatology of ozone
profiles
V. F. Sofieva et al.
Title Page
Abstract Introduction
Conclusions References
Tables Figures
◭ ◮
◭ ◮
Back Close
Full Screen / Esc
Printer-friendly Version Interactive Discussion
Discussion
P
a
per
|
D
iscussion
P
a
per
|
Discussion
P
a
per
|
Discuss
ion
P
a
per
|
where ¯ρsoand ¯ρSAare mean ozone profiles calculated using ozonesonde and
SAGE-II data, respectively, andNso,NSA are the corresponding number of ozonesonde and
SAGE-II measurements (corresponding to a particular tropopause heightht). The
es-timate ¯ρ presents the mean over all measurements. The usual sample mean is
in-tentionally calculated without consideration of any predicted measurement uncertainty 5
for weighting purposes, since measurement uncertainties can depend on geolocation or/and the atmospheric state and thus could bias the mean.
Denoting vso, vSA the variability (rms) in ozonesonde and SAGE-II data sets, the
resulting (merged) variability can be written as:
v2=Nsov 2
so+NSAv 2 SA Nso+NSA
+NsoNSA( ¯ρso−ρ¯SA) 2
(Nso+NSA)2 (2)
10
IfNso=0 orNSa=0, the variability coincides with the variability of the present dataset.
In case ¯ρso=ρ¯Sa, the resulting variability is averaged in the same way as the mean
profiles.
The transition ¯ρto ¯ρsoat lower altitudes is performed using a fast 3-point transition:
the value 1/2( ¯ρso+ρ¯) is taken at the altitudeh0; ¯ρabove this altitude, and ¯ρsobelow.
15
The probability distribution of tropopause heights is recalculated using the tropopause height bins that are present in both satellite and ozonesonde measure-ments.
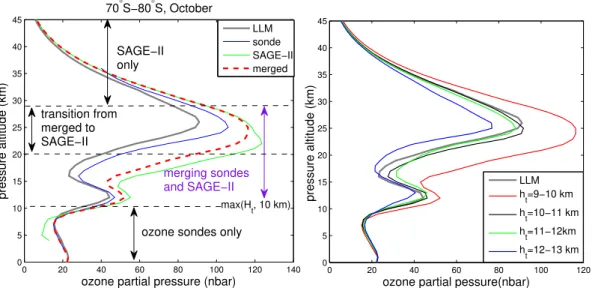
The merging procedure is illustrated in Fig. 6 (left), which shows the original sonde and SAGE-II profiles and the merged profile for one selected tropopause height in 20
October between 70◦
S and 80◦
S. In this example, the SAGE-II and ozonesonde
pro-files, corresponding to the tropopause height 9–10 km, differ significantly. This
situa-tion is rather excepsitua-tional, and it is purposely selected for visualizasitua-tion clarity. Usually, ozonesonde and SAGE-II profiles are much closer to each other. Final merged ozone profiles for all tropopause height categories at this location, for October, are shown in 25
ACPD
13, 21345–21382, 2013A novel tropopause-related climatology of ozone
profiles
V. F. Sofieva et al.
Title Page
Abstract Introduction
Conclusions References
Tables Figures
◭ ◮
◭ ◮
Back Close
Full Screen / Esc
Printer-friendly Version Interactive Discussion
Discussion
P
a
per
|
D
iscussion
P
a
per
|
Discussion
P
a
per
|
Discuss
ion
P
a
per
|
profile would result in an erroneous profile associated with a certain tropopause height. Figure 6 (left) indicates the altitude ranges over which the merging of sonde and
SAGE-II data occurs (fromh0to 28 km) and where the linear transition from the merged profile
to SAGE-II climatological profile is performed (20–28 km).
4.2.2 Double tropopause 5
Analogous to the processing of single-tropopause profiles, the statistics of ozone pro-files in the case of a double tropopause is computed only for tropopause heights that are available both in ozonesonde and satellite data. This requirement results in
charac-terization of ozone profiles for double tropopauses only for latitudes between 30◦
and
40◦N and only from January to March.
10
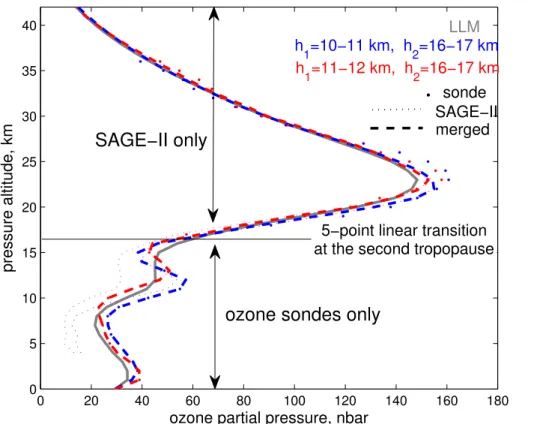
Due to reduced accuracy of SAGE-II measurements in the troposphere and relatively short vertical spacing between the tropopauses, any weighting of ozonesonde and SAGE-II data in this altitude range can induce non-realistic ozone profiles between the tropopauses. Since the second tropopause is high, at altitudes 16–18 km, we have decided to use a simple merging: sounding data are used up to the second tropopause 15
with a 5-point linear transition to SAGE-II data above this altitude. Data merging in the case of double tropopauses is illustrated in Fig. 7.
5 Ozone morphology and comparisons
The tropopause-height related ozone climatology provides an additional dimension (further categorization by tropopause height) not available in traditional vertical ozone 20
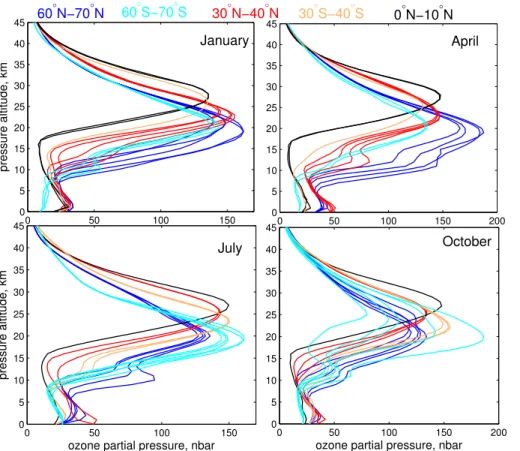
profile climatologies. Figure 8 shows examples of ozone profiles from the TpO3 for
selected months and latitude zones. As expected, the main differences in profiles,
which depend on tropopause height, are observed in the UTLS region. In the
strato-sphere, the profiles corresponding to different tropopause heights are close to each
other, as shown earlier by Steinbrecht et al. (1998). The clear exception is in Antarc-25
ACPD
13, 21345–21382, 2013A novel tropopause-related climatology of ozone
profiles
V. F. Sofieva et al.
Title Page
Abstract Introduction
Conclusions References
Tables Figures
◭ ◮
◭ ◮
Back Close
Full Screen / Esc
Printer-friendly Version Interactive Discussion
Discussion
P
a
per
|
D
iscussion
P
a
per
|
Discussion
P
a
per
|
Discuss
ion
P
a
per
|
tic spring (60–70◦S in October), where ozone profiles through the entire stratosphere
and UTLS are dramatically different for different tropopause heights. As explained in
Sect. 1, ozone abundances and the tropopause height are inter-related under such conditions, because the location of the tropopause is influenced by the temperature in the lower stratosphere. Since the longitudinal structure of the ozone distribution is 5
quasi-stationary over Antarctica in spring and strongly correlated with the tropopause
height, the TpO3climatology allows a partial characterization of longitudinal variability.
Substantial differences in ozone distributions in the Northern and Southern
Hemi-spheres are clearly apparent in Fig. 8.
As noted above, the stored information on the distribution of tropopause heights al-10
lows downgrading the TpO3climatology to a standard sea-level-referenced climatology,
e.g., for comparison with previously created climatologies. For such presentation, the
monthly mean profilesρm can be computed as the mathematical expectation, i.e., the
weighted mean of the ozone profiles corresponding to different tropopause heights,ρi,
with their respective probabilitiesfi:
15
ρm=
X
ρi·fi (3)
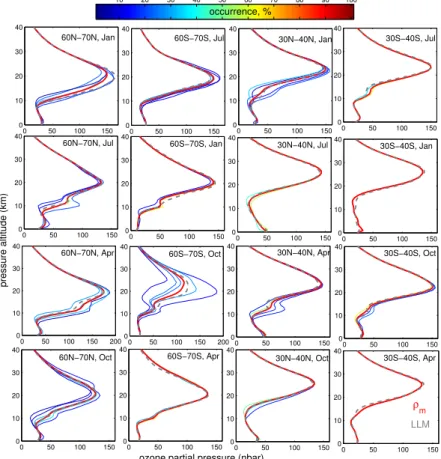
Fig. 9 shows profiles from the TpO3climatology for several latitude zones and months,
which are colored according to their probabilities (from dark blue for seldom occurred tropopause heights to reddish for frequently occurred ones), and the monthly mean
profilesρm corresponding to a tropopause-insensitive climatology, which are indicated
20
by thick red lines. These monthly mean profiles,ρm, are very close to the LLM
clima-tological profiles (grey dashed lines). Latitude zones and months were selected and
arranged to highlight similarities, differences and the seasonal dependence of
clima-tological ozone distributions in both hemispheres. In addition to features that are seen
also in sea-level-referenced climatologies (strong north-south differences in
spring-25
time ozone at high latitudes, latitude dependence of the ozone peak altitude, seasonal
ozone variations), the TpO3climatology supports a richer view of the ozone distribution
ACPD
13, 21345–21382, 2013A novel tropopause-related climatology of ozone
profiles
V. F. Sofieva et al.
Title Page
Abstract Introduction
Conclusions References
Tables Figures
◭ ◮
◭ ◮
Back Close
Full Screen / Esc
Printer-friendly Version Interactive Discussion
Discussion
P
a
per
|
D
iscussion
P
a
per
|
Discussion
P
a
per
|
Discuss
ion
P
a
per
|
and thus the ozone variability in the UTLS, is generally larger in the Northern
Hemi-sphere. This is a combined effect of a larger dynamical variability and better coverage
by ozonesonde data as can be seen when Figs. 2 and 9 are compared. It is interesting that the inter-relation between the tropopause heights and ozone profiles in the whole stratosphere is observed not only at SH high latitudes in spring, but also over the NH, 5
thus suggesting the same mechanism for this inter-relation. As observed in Fig. 9, cli-matological profiles corresponding to a certain tropopause height can be significantly
different from the monthly meanρm(and from the sea-level-referenced climatology).
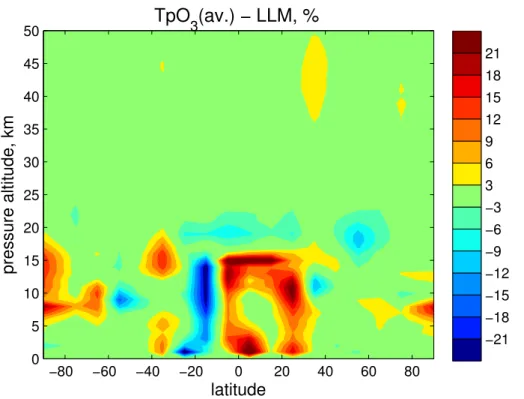
Figure 10 shows the percent difference in annual average ozone between theρmand
LLM climatologies as a function of altitude and latitude. In the middle stratosphere, the 10
changes are very small, i.e., within 3 %. The main changes are in the tropical region. This is probably due to a significant increase in the number of ozonesonde profiles
used in the TpO3climatology compared to the LLM climatology, because a very similar
pattern is observed in comparisons of the new climatology by McPeters and Labow (2012) (ML hereafter) and LLM (Fig. 8 in McPeters and Labow, 2012). A relatively 15
large difference is observed also over Antarctica and results from a combined effect of
a larger number of soundings and the tropopause-included representation.
In general, standard deviations in the TpO3climatology are as expected, being larger
in winter at high and mid-latitudes and smaller in summer (Fig. 11). The most
impor-tant feature of TpO3 is reduced variability in the UTLS region compared to the LLM
20
climatology in the majority of cases. As shown in Fig. 11, cases of larger/comparable variability correspond to tropopause heights with small probability of occurrence, and might therefore be indicative of a too small statistical sample. For frequently occurred tropopause heights, the reduction in standard deviation is 20–40 % in the UTLS, com-pared to the LLM climatology.
25
As described in detail above, the characterization of double tropopauses is
per-formed only between 30◦
N and 40◦
N and for the months of January to March. For these months, ozone profiles corresponding to double-tropopause temperature pro-files were compared with those corresponding to single tropopauses (Fig. 12).
ACPD
13, 21345–21382, 2013A novel tropopause-related climatology of ozone
profiles
V. F. Sofieva et al.
Title Page
Abstract Introduction
Conclusions References
Tables Figures
◭ ◮
◭ ◮
Back Close
Full Screen / Esc
Printer-friendly Version Interactive Discussion
Discussion
P
a
per
|
D
iscussion
P
a
per
|
Discussion
P
a
per
|
Discuss
ion
P
a
per
|
tropopause profiles systematically exhibit reduced ozone concentrations in the lower
stratosphere (altitudes ∼10–15 km) compared to single-tropopause profiles having
similar tropopause heights, in agreement with the findings of Randel et al. (2007). The profiles corresponding to single tropopauses in Fig. 12 show clearly the presence of two populations: one with high tropopauses at 15–16 km and lower stratospheric 5
ozone (tropical air) and another with low tropopauses at 8–10 km and higher strato-spheric ozone (mid-latitude air). The double-tropopause profiles appear to be a mix-ture of these two populations, with a transition from low-tropopause to high-tropopause profiles. This is a clear indication that occurrence of double tropopauses is associated with the transport of tropical air, in line with current understanding of the stratosphere-10
troposphere exchange (Gettelman et al., 2011).
6 On using the joint ozone and tropopause height climatology in satellite retrievals
To assess how the new ozone climatology affects vertical ozone profile retrievals from
satellite-based instruments, the new climatology was used in the operational ozone 15
profile algorithm for the Ozone Monitoring Instrument (OMI) on board the NASA Earth Observing System (EOS) Aura satellite (Schoeberl et al., 2006). OMI, which has been making measurements since 2004, is a nadir viewing, ultraviolet-visible (270–500 nm) imaging spectrometer, which provides daily global coverage with high spatial and spec-tral resolution (Levelt et al., 2006a, b).
20
A detailed description of the OMI ozone profile algorithm (OMO3PR) is given in Kroon et al. (2011). Briefly, the retrieval is based on the strong decrease in the ozone absorption cross-section between wavelengths of 270 nm and 330 nm. The radiation at the longer wavelengths passes through the whole atmosphere while the shortest wavelengths are absorbed in higher layers of the atmosphere. Measuring the spectral 25
ACPD
13, 21345–21382, 2013A novel tropopause-related climatology of ozone
profiles
V. F. Sofieva et al.
Title Page
Abstract Introduction
Conclusions References
Tables Figures
◭ ◮
◭ ◮
Back Close
Full Screen / Esc
Printer-friendly Version Interactive Discussion
Discussion
P
a
per
|
D
iscussion
P
a
per
|
Discussion
P
a
per
|
Discuss
ion
P
a
per
|
2000), where the difference between the measured and modeled sun-normalized
ra-diance is minimized by adjusting the amount of ozone in each atmospheric layer. This method requires a priori information on ozone profiles. The operational OMI ozone profile retrieval uses the LLM climatology.
The effects of the use of two alternative ozone climatologies on the OMI retrievals
5
are examined. The first is the climatology of McPeters and Labow (2012) (ML
clima-tology), and the second is the linked ozone and tropopause height (TpO3) climatology
detailed in earlier sections. The ML climatology is an updated version of the LLM cli-matology with the number of atmospheric layers increased from 61 to 66, an increased
number of ozonesondes, and use of the MLS/Aura ozone data. To implement the TpO3
10
climatology, which includes information on the tropopause height, in the OMI retrievals, the OMO3PR algorithm has been modified. Tropopause height was calculated in the algorithm in a similar way to that presented in Sect. 3 above, using temperature profiles from ECMWF. Then a new dimension was added to the a priori ozone look-up-table in the form of tropopause height. If an observed tropopause height is outside the range 15
of climatological tropopause heights, the nearest climatological value is taken.
For the assessment, two orbits (6702 and 6704, 18 October 2005) were processed
using the operational LLM climatology, ML climatology and TpO3climatology. For
sav-ing processsav-ing time, only every 10th measurement and only 10 pixels from the center of the swath were considered. As in the operational version, a priori variability of 20 % 20
was assumed for all latitudes and altitudes, except for ozone hole conditions (between
August and December south of 50◦S) where the variability was 60 % for altitudes
be-tween 21 and 50 km and 30 % for all other altitudes.
Since the results are very similar for both orbits, only the results for orbit 6704 are presented. Figure 13 (left) shows the average precision of ozone profiles (i.e., ran-25
dom error) for the whole orbit. The use of the ML climatology slightly improves ozone
precision, with the improvement maximizing at higher altitudes. The TpO3
climatol-ogy improves the precision even more compared to operational and ML climatologies.
As expected, the effect of using the TpO3 climatology maximizes between 60◦S and
ACPD
13, 21345–21382, 2013A novel tropopause-related climatology of ozone
profiles
V. F. Sofieva et al.
Title Page
Abstract Introduction
Conclusions References
Tables Figures
◭ ◮
◭ ◮
Back Close
Full Screen / Esc
Printer-friendly Version Interactive Discussion
Discussion
P
a
per
|
D
iscussion
P
a
per
|
Discussion
P
a
per
|
Discuss
ion
P
a
per
|
70◦S, where a nearly stationary spring-time ozone zonal anomaly is observed. The
abundance of stratospheric ozone and the tropopause height are inter-related in this
region. As Fig. 13 (right) shows, the TpO3 climatology improves the accuracy of the
retrieval by several percent in the troposphere and up to 10 hPa. At altitudes above
6 hPa, using the ML climatology provides the smallest precision values. The effect of
5
using not only the profiles but also the variabilities of the new TpO3climatology will be
the subject of future work.
7 Data availability
The TpO3 climatology is provided in ASCII format (with README file) and can be
found at http://igaco-o3.fmi.fi/VDO/linked_climatology.html. It consists of folders cor-10
responding to the latitude zones 10◦ (self-explained names, e.g., “10N_20N”). Each
folder includes 12 files corresponding to 12 months. For example, for January the file name is “01.dat” for single tropopauses and “01_double.dat” for double tropopauses (if present). The structure of each ASCII file for single tropopauses is presented in Fig. 14. The reported tropopause heights correspond to the lower limit of the 1 km interval. For 15
example, the tropopause height of 16 km is for a tropopause between 16 and 17 km. The files contain the mean ozone profiles and their variability (standard deviation) in %. The structure of the ASCII files for double tropopauses is illustrated by Fig. 15. It is very similar to that for single tropopauses.
8 Discussion and summary
20
ACPD
13, 21345–21382, 2013A novel tropopause-related climatology of ozone
profiles
V. F. Sofieva et al.
Title Page
Abstract Introduction
Conclusions References
Tables Figures
◭ ◮
◭ ◮
Back Close
Full Screen / Esc
Printer-friendly Version Interactive Discussion
Discussion
P
a
per
|
D
iscussion
P
a
per
|
Discussion
P
a
per
|
Discuss
ion
P
a
per
|
– The dependence of the ozone abundance and its variability on tropopause height
is preserved. This allows a more accurate characterization of ozone profiles and a partial characterization of longitudinal variability.
– Variability in UTLS is reduced when compared to sea-level-referenced
climatolo-gies. 5
– Ozone profiles in the presence of double tropopauses are somewhat better
char-acterized.
– The probability distribution of tropopause heights provides additional
climato-logical information and allows transforming/comparing the TpO3 climatology to
a more traditional sea-level-referenced or tropopause-referenced climatology. 10
It is expected that the TpO3climatology might be useful for ozone retrievals from
satel-lite instruments that use a priori information about the vertical distribution of ozone. First tests on applying this climatology in ozone retrievals from OMI have shown pro-nounced reduction in uncertainty of retrieved ozone profiles in the UTLS region, up to 10 % for some locations. In particular, the main advantages are observed where there 15
is a significant correlation between stratospheric ozone and tropopause height (e.g., in spring over Antarctica), as expected.
For creating a tropopause-related ozone climatology, reliable profiles with sufficient
vertical resolution from the ground to the mesosphere are needed. However, such data are not available from a single instrument. In the study described here measurements 20
from ozonesondes and SAGE-II were used for the analysis. These datasets are charac-terized by a high vertical resolution, good data precision, and they are nearly unbiased with respect to each other. However, both datasets have limitations related to spatial
and temporal coverage. The TpO3climatology is therefore best suitable for satellite
in-struments measuring in daytime (OMI, its successor TROPOMI (Veefkind et al., 2012), 25
SBUV, GOME-2, OMPS). Another limitation of the TpO3climatology is that is does not
represent the present-day conditions due to ozone trends. However, this seems to be
ACPD
13, 21345–21382, 2013A novel tropopause-related climatology of ozone
profiles
V. F. Sofieva et al.
Title Page
Abstract Introduction
Conclusions References
Tables Figures
◭ ◮
◭ ◮
Back Close
Full Screen / Esc
Printer-friendly Version Interactive Discussion
Discussion
P
a
per
|
D
iscussion
P
a
per
|
Discussion
P
a
per
|
Discuss
ion
P
a
per
|
not important for satellite retrieval algorithms, because the ozone trends (a few percent per decade, according to Kyrölä et al., 2013; Logan et al., 2012; Staehelin et al., 2001)
are much smaller than a priori ozone variability (∼20 %) used in retrievals.
Potential further (and future) extension/improvement of the TpO3 climatology
would be the use of other high-vertical-resolution instruments (e.g., GOMOS/Envisat, 5
HIRLDS/Aura, potentially future SAGE-III measurements on ISS). This extension can potentially adapt the ozone-tropopause climatology to present-day conditions.
How-ever, this would require a special care above∼40 km due to diurnal variations of ozone,
as well as analyzing possible biases between the datasets.
Acknowledgements. The work of VS, JT and EK has been supported by Tekes and Ministry of
10
Transport and Communications, Finland (project PP-TROPOMI) and the Academy of Finland (projects ASTREX and MIDAT). This study contributes also to ESA/DRAGON-3 cooperation project.
References
Añel, J. A., Antuña, J. C., de la Torre, L., Castanheira, J. M., and Gimeno, L.: Climatologi-15
cal features of global multiple tropopause events, J. Geophys. Res.-Atmos., 113, D00B08, doi:10.1029/2007JD009697, 2008.
Evtushevsky, O. M., Grytsai, A. V, Klekociuk, A. R., and Milinevsky, G. P.: Total ozone and tropopause zonal asymmetry during the Antarctic spring, J. Geophys. Res., 113, D00B06, doi:10.1029/2008JD009881, 2008.
20
Feng, S., Fu, Y., and Xiao, Q.: Trends in the global tropopause thickness revealed by radioson-des, Geophys. Res. Lett., 39, L20706, doi:10.1029/2012GL053460, 2012.
Fortuin, J. P. F. and Kelder, H.: An ozone climatology based on ozonesonde and satellite mea-surements, J. Geophys. Res., 103, 31709–31734, 1998.
Gettelman, A., Hoor, P., Pan, L. L., Randel, W. J., Hegglin, M. I., and Birner, T.: The 25
ACPD
13, 21345–21382, 2013A novel tropopause-related climatology of ozone
profiles
V. F. Sofieva et al.
Title Page
Abstract Introduction
Conclusions References
Tables Figures
◭ ◮
◭ ◮
Back Close
Full Screen / Esc
Printer-friendly Version Interactive Discussion
Discussion
P
a
per
|
D
iscussion
P
a
per
|
Discussion
P
a
per
|
Discuss
ion
P
a
per
|
Grytsai, A., Grytsai, Z., Evtushevsky, A., Milinevsky, G., and Leonov, N.: Zonal wave numbers 1–5 in planetary waves from the TOMS total ozone at 65◦S, Ann. Geophys., 23, 1565–1573, doi:10.5194/angeo-23-1565-2005, 2005.
Grytsai, A. V., Evtushevsky, O. M., Agapitov, O. V., Klekociuk, A. R., and Milinevsky, G. P.: Struc-ture and long-term change in the zonal asymmetry in Antarctic total ozone during spring, 5
Ann. Geophys., 25, 361–374, doi:10.5194/angeo-25-361-2007, 2007.
Hassler, B., Bodeker, G. E., and Dameris, M.: Technical Note: A new global database of trace gases and aerosols from multiple sources of high vertical resolution measurements, Atmos. Chem. Phys., 8, 5403–5421, doi:10.5194/acp-8-5403-2008, 2008.
Hoerling, M. P., Schaack, T. K., and Lenzen, A. J.: Global objective tropopause analysis, Mon. 10
Weather Rev., 119, 1816–1831, doi:10.1175/1520-0493(1991)119<1816:GOTA>2.0.CO;2, 1991.
Homeyer, C. R., Bowman, K. P., and Pan, L. L.: Extratropical tropopause transition layer characteristics from high-resolution sounding data, J. Geophys. Res., 115, D13108, doi:10.1029/2009JD013664, 2010.
15
Hoor, P., Fischer, H., Lange, L., Lelieveld, J., and Brunner, D.: Seasonal variations of a mixing layer in the lowermost stratosphere as identified by the CO-O3 correlation from in situ mea-surements, J. Geophys. Res.-Atmos., 107, ACL 1-1–ACL 1-11, doi:10.1029/2000JD000289, 2002.
Ialongo, I., Sofieva, V., Kalakoski, N., Tamminen, J., and Kyrölä, E.: Ozone zonal asymmetry 20
and planetary wave characterization during Antarctic spring, Atmos. Chem. Phys., 12, 2603– 2614, doi:10.5194/acp-12-2603-2012, 2012.
Kroon, M., de Haan, J. F., Veefkind, J. P., Froidevaux, L., Wang, R., Kivi, R., and Hakkarainen, J. J.: Validation of operational ozone profiles from the Ozone Monitoring In-strument, J. Geophys. Res., 116, D18305, doi:10.1029/2010JD015100, 2011.
25
Kunz, A., Konopka, P., Müller, R., Pan, L. L., Schiller, C., and Rohrer, F.: High static stability in the mixing layer above the extratropical tropopause, J. Geophys. Res.-Atmos., 114, D16305, doi:10.1029/2009JD011840, 2009.
Kyrölä, E., Laine, M., Sofieva, V., Tamminen, J., Päivärinta, S.-M., Tukiainen, S., Zawodny, J., and Thomason, L.: Combined SAGE II-GOMOS ozone profile data set 1984–2011 and trend 30
analysis of the vertical distribution of ozone, Atmos. Chem. Phys. Discuss., 13, 10661– 10700, doi:10.5194/acpd-13-10661-2013, 2013.
ACPD
13, 21345–21382, 2013A novel tropopause-related climatology of ozone
profiles
V. F. Sofieva et al.
Title Page
Abstract Introduction
Conclusions References
Tables Figures
◭ ◮
◭ ◮
Back Close
Full Screen / Esc
Printer-friendly Version Interactive Discussion
Discussion
P
a
per
|
D
iscussion
P
a
per
|
Discussion
P
a
per
|
Discuss
ion
P
a
per
|
Levelt, P. F., Hilsenrath, E., Leppelmeier, G. W., Van Den Oord, G. H. J., Bhartia, P. K., Tammi-nen, J., De Haan, J. F., and Veefkind, P.: Science objectives of the ozone monitoring instru-ment, IEEE T. Geosci. Remote, 44, 1199–1208, doi:10.1109/TGRS.2006.872336, 2006a. Levelt, P. F., van den Oord, G. H. J., Dobver, M. R., Mälkki, A., Visser, H., de Vries, J.,
Stammes, P., Lundell, J. O. V., and Saari, H.: The ozone monitoring instrument, IEEE T. 5
Geosci. Remote, 44, 1093–1101, doi:10.1109/TGRS.2006.872333, 2006b.
Logan, J. A.: An analysis of ozonesonde data for the troposphere: Recommendations for testing 3-D models and development of a gridded climatology for tropospheric ozone, J. Geophys. Res.-Atmos., 104, 16115–16149, doi:10.1029/1998JD100096, 1999.
Logan, J. A., Staehelin, J., Megretskaia, I. A., Cammas, J.-P., Thouret, V., Claude, H., 10
De Backer, H., Steinbacher, M., Scheel, H.-E., Stübi, R., Fröhlich, M., and Derwent, R.: Changes in ozone over Europe: Analysis of ozone measurements from sondes, regu-lar aircraft (MOZAIC) and alpine surface sites, J. Geophys. Res.-Atmos., 117, D09301, doi:10.1029/2011JD016952, 2012.
McPeters, R. D. and Labow, G. J.: Climatology 2011: an MLS and sonde derived 15
ozone climatology for satellite retrieval algorithms, J. Geophys. Res., 117, D10303, doi:10.1029/2011JD017006, 2012.
McPeters, R. D., Labow, G. J., and Logan, J. A.: Ozone climatological profiles for satellite re-trieval algorithms, J. Geophys. Res., 112, D05308, doi:10.1029/2005JD006823, 2007. Pan, L. L., Randel, W. J., Gary, B. L., Mahoney, M. J., and Hintsa, E. J.: Definitions and sharp-20
ness of the extratropical tropopause: a trace gas perspective, J. Geophys. Res.-Atmos., 109, D23103, doi:10.1029/2004JD004982, 2004.
Pan, L. L., Randel, W. J., Gille, J. C., Hall, W. D., Nardi, B., Massie, S., Yudin, V., Khos-ravi, R., Konopka, P., and Tarasick, D.: Tropospheric intrusions associated with the secondary tropopause, J. Geophys. Res.-Atmos., 114, D10302, doi:10.1029/2008JD011374, 2009. 25
Peevey, T. R., Gille, J. C., Randall, C. E., and Kunz, A.: Investigation of double tropopause spatial and temporal global variability utilizing High Resolution Dynamics Limb Sounder tem-perature observations, J. Geophys. Res.-Atmos., 117, D01105, doi:10.1029/2011JD016443, 2012.
Randel, W. J., Seidel, D. J., and Pan, L. L.: Observational characteristics of double tropopauses, 30
J. Geophys. Res., 112, D07309, doi:10.1029/2006JD007904, 2007.
ACPD
13, 21345–21382, 2013A novel tropopause-related climatology of ozone
profiles
V. F. Sofieva et al.
Title Page
Abstract Introduction
Conclusions References
Tables Figures
◭ ◮
◭ ◮
Back Close
Full Screen / Esc
Printer-friendly Version Interactive Discussion
Discussion
P
a
per
|
D
iscussion
P
a
per
|
Discussion
P
a
per
|
Discuss
ion
P
a
per
|
Rodgers, C. D.: Inverse Methods for Atmospheric sounding: Theory and Practice, World Scien-tific, Singapore, 2000.
Schoeberl, M. R., Douglass, A. R., Hilsenrath, E., Bhartia, P. K., Beer, R., Wa-ters, J. W., Gunson, M. R., Froidevaux, L., Gille, J. C., Barnett, J. J., Levelt, P. F., and DeCola, P.: Overview of the EOS aura mission, IEEE T: Geosci. Remote, 44, 1066–1074, 5
doi:10.1109/TGRS.2005.861950, 2006.
Staehelin, J., Harris, N. R. P., Appenzeller, C., and Eberhard, J.: Ozone trends: a review, Rev. Geophys, 39, 231–290, doi:10.1029/1999RG000059, 2001.
Steinbrecht, W., Claude, H., Köhler, U., and Hoinka, K. P.: Correlations between tropopause height and total ozone: implications for long-term changes, J. Geophys. Res., 103, 19183– 10
19192, doi:10.1029/98JD01929, 1998.
Thouret, V., Cammas, J.-P., Sauvage, B., Athier, G., Zbinden, R., Nédélec, P., Simon, P., and Karcher, F.: Tropopause referenced ozone climatology and inter-annual variability (1994– 2003) from the MOZAIC programme, Atmos. Chem. Phys., 6, 1033–1051, doi:10.5194/acp-6-1033-2006, 2006.
15
Tilmes, S., Lamarque, J.-F., Emmons, L. K., Conley, A., Schultz, M. G., Saunois, M., Thouret, V., Thompson, A. M., Oltmans, S. J., Johnson, B., and Tarasick, D.: Technical Note: Ozonesonde climatology between 1995 and 2011: description, evaluation and applications, Atmos. Chem. Phys., 12, 7475–7497, doi:10.5194/acp-12-7475-2012, 2012.
Tilmes, S., Pan, L. L., Hoor, P., Atlas, E., Avery, M. A., Campos, T., Christensen, L. E., 20
Diskin, G. S., Gao, R.-S., Herman, R. L., Hintsa, E. J., Loewenstein, M., Lopez, J., Paige, M. E., Pittman, J. V, Podolske, J. R., Proffitt, M. R., Sachse, G. W., Schiller, C., Schlager, H., Smith, J., Spelten, N., Webster, C., Weinheimer, A., and Zondlo, M. A.: An aircraft-based upper troposphere lower stratosphere O3, CO, and H2O climatology for the Northern Hemisphere, J. Geophys. Res.-Atmos., 115, D14303, doi:10.1029/2009JD012731, 25
2010.
Wang, H. J., Cunnold, D. M., Thomason, L. W., Zawodny, J. M., and Bodeker, G. E.: Assessment of SAGE version 6.1 ozone data quality, J. Geophys. Res.-Atmos., 107, ACH 8-1-ACH 8–18, doi:10.1029/2002JD002418, 2002.
Wang, P.-H., Cunnold, D. M., Trepte, C. R., Wang, H. J., Jing, P., Fishman, J., Brackett, V. G., 30
Zawodney, J. M., and Bodeker, G. E.: Ozone variability in the midlatitude upper tropo-sphere and lower stratotropo-sphere diagnosed from a monthly SAGE II climatology relative to the tropopause, J. Geophys. Res., 111, D21304, doi:10.1029/2005JD006108, 2006.
ACPD
13, 21345–21382, 2013A novel tropopause-related climatology of ozone
profiles
V. F. Sofieva et al.
Title Page
Abstract Introduction
Conclusions References
Tables Figures
◭ ◮
◭ ◮
Back Close
Full Screen / Esc
Printer-friendly Version Interactive Discussion
Discussion
P
a
per
|
D
iscussion
P
a
per
|
Discussion
P
a
per
|
Discuss
ion
P
a
per
|
Veefkind, J. P., Aben, I., McMullan, K., Förster, H., de Vries, J., Otter, G., Claas, J., Eskes, H. J., de Haan, J. F., Kleipool, Q., van Weele, M., Hasekamp, O., Hoogeveen, R., Landgraf, J., Snel, R., Tol, P., Ingmann, P., Voors, R., Kruizinga, B., Vink, R., Visser, H., and Levelt, P. F.: TROPOMI on the ESA Sentinel-5 Precursor: a GMES mission for global observations of the atmospheric composition for climate, air quality and ozone layer applications, Remote Sens. 5
Environ., 120, 70–83, doi:10.1016/j.rse.2011.09.027, 2012.
Wei, J. C., Pan, L. L., Maddy, E., Pittman, J. V, Divarkarla, M., Xiong, X., and Barnet, C.: Ozone profile retrieval from an advanced infrared sounder: experiments with tropopause-based climatology and optimal estimation approach, J. Atmos. Ocean. Tech., 27, 1123–1139, doi:10.1175/2010JTECHA1384.1, 2010.
10
ACPD
13, 21345–21382, 2013A novel tropopause-related climatology of ozone
profiles
V. F. Sofieva et al.
Title Page
Abstract Introduction
Conclusions References
Tables Figures
◭ ◮
◭ ◮
Back Close
Full Screen / Esc
Printer-friendly Version Interactive Discussion
Discussion
P
a
per
|
D
iscussion
P
a
per
|
Discussion
P
a
per
|
Discuss
ion
P
a
per
|
Fig. 1.Number of measurements in 10◦latitude zones and in each month. Left: ozonesondes from the BDBP; right: SAGE II.
ACPD
13, 21345–21382, 2013A novel tropopause-related climatology of ozone
profiles
V. F. Sofieva et al.
Title Page Abstract Introduction Conclusions References Tables Figures ◭ ◮ ◭ ◮ Back Close
Full Screen / Esc
Printer-friendly Version Interactive Discussion Discussion P a per | D iscussion P a per | Discussion P a per | Discuss ion P a per |
−80 −60 −40 −20 0 20 40 60 80 6 8 10 12 14 16 18 altitude, km ozone sondes
−80 −60 −40 −20 0 20 40 60 80 6 8 10 12 14 16 18 altitude, km
−80 −60 −40 −20 0 20 40 60 80 6 8 10 12 14 16 18 altitude, km
−80 −60 −40 −20 0 20 40 60 80 6 8 10 12 14 16 18 altitude, km latitude
−80 −60 −40 −20 0 20 40 60 80 6 8 10 12 14 16 18 January NCEP/SAGE II
−80 −60 −40 −20 0 20 40 60 80 6 8 10 12 14 16 18 April
−80 −60 −40 −20 0 20 40 60 80 6 8 10 12 14 16 18 July
−80 −60 −40 −20 0 20 40 60 80 6 8 10 12 14 16 18 latitude October
0 10 20 30 40 50 60 70 80 90 100 tropopause frequency, %
ACPD
13, 21345–21382, 2013A novel tropopause-related climatology of ozone
profiles
V. F. Sofieva et al.
Title Page
Abstract Introduction
Conclusions References
Tables Figures
◭ ◮
◭ ◮
Back Close
Full Screen / Esc
Printer-friendly Version Interactive Discussion
Discussion
P
a
per
|
D
iscussion
P
a
per
|
Discussion
P
a
per
|
Discuss
ion
P
a
per
|
2 4 6 8 10 12
1 3 5 7 9 1111
−80 −60 −40 −20 0 20 40 60 80
month
latitude
ozone sondes
2 4 6 8 10 12
1 3 5 7 9 1111
−80 −60 −40 −20 0 20 40 60 80
month
latitude
NCEP/SAGE II
0 5 10 15 20 25 30
Fig. 3. Percentage of double tropopause occurrence in ozonesonde profiles and in the NCEP/SAGE II data.
ACPD
13, 21345–21382, 2013A novel tropopause-related climatology of ozone
profiles
V. F. Sofieva et al.
Title Page
Abstract Introduction
Conclusions References
Tables Figures
◭ ◮
◭ ◮
Back Close
Full Screen / Esc
Printer-friendly Version Interactive Discussion
Discussion
P
a
per
|
D
iscussion
P
a
per
|
Discussion
P
a
per
|
Discuss
ion
P
a
per
|
8 9 10 11 12 13 14 14
15 16 17 18 19
2nd tropopause, km
Ozone sondes
8 9 10 11 12 13 14 14
15 16 17 18 19
2nd tropopause, km
8 9 10 11 12 13 14 14
15 16 17 18 19
1st tropopause, km
2nd tropopause, km
8 9 10 11 12 13 14 14
15 16 17 18 19
January
NCEP/SAGE II
8 9 10 11 12 13 14 14
15 16 17 18 19
February
8 9 10 11 12 13 14 14
15 16 17 18 19
1st tropopause, km
March
0 5 10 15 20 25 30 35 40 occurrence, %
ACPD
13, 21345–21382, 2013A novel tropopause-related climatology of ozone
profiles
V. F. Sofieva et al.
Title Page
Abstract Introduction
Conclusions References
Tables Figures
◭ ◮
◭ ◮
Back Close
Full Screen / Esc
Printer-friendly Version Interactive Discussion
Discussion
P
a
per
|
D
iscussion
P
a
per
|
Discussion
P
a
per
|
Discuss
ion
P
a
per
|
0 20 40 60 80 100 120 140
0 5 10 15 20 25 30 35 40
ozone partial pressure (nbar)
presssure altitude (km)
80°N−90°N, September
LLM sondes, h
t=8−9 km merged, h
t=8−9 km sondes, h
t=9−10 km merged, h
t=9−10 km sondes, h
t=10−11 km merged, h
t=10−11 km
LLM only
ozone sondes only
transition from sondes climat. to LLM
Fig. 5.Illustration of data merging when SAGE-II data are not available. A smooth transition from the ozonesonde climatology to the LLM climatology is performed using the altitude in-terval 20–28 km. In this and subsequent figures, ozone partial pressure is shown for a better visualization. Note that in TpO3climatology files, ozone mixing ratio is presented.
ACPD
13, 21345–21382, 2013A novel tropopause-related climatology of ozone
profiles
V. F. Sofieva et al.
Title Page
Abstract Introduction
Conclusions References
Tables Figures
◭ ◮
◭ ◮
Back Close
Full Screen / Esc
Printer-friendly Version Interactive Discussion
Discussion
P
a
per
|
D
iscussion
P
a
per
|
Discussion
P
a
per
|
Discuss
ion
P
a
per
|
0 20 40 60 80 100 120 140
0 5 10 15 20 25 30 35 40 45
ozone partial pressure (nbar)
pressure altitude (km)
70°S−80°S, October
LLM sonde SAGE−II merged
0 20 40 60 80 100 120
0 5 10 15 20 25 30 35 40 45
ozone partial pessure(nbar)
pressure altitude (km)
LLM
ht=9−10 km
ht=10−11 km
ht=11−12km
h
t=12−13 km
SAGE−II only
ozone sondes only merging sondes and SAGE−II transition from
merged to SAGE−II
max(Ht, 10 km)
Fig. 6.Illustration of merging sonde and SAGE-II data based on data in October at 70–80◦S. Left: illustration of merging for one of the tropopause heights, which is 9–10 km; altitude ranges for merging sonde and SAGE-II data and for linear transition to SAGE-II data are highlighted. In this example,Nso=90 andNSA=160. LLM profile is presented for comparison. Right: merged
ACPD
13, 21345–21382, 2013A novel tropopause-related climatology of ozone
profiles
V. F. Sofieva et al.
Title Page
Abstract Introduction
Conclusions References
Tables Figures
◭ ◮
◭ ◮
Back Close
Full Screen / Esc
Printer-friendly Version Interactive Discussion
Discussion
P
a
per
|
D
iscussion
P
a
per
|
Discussion
P
a
per
|
Discuss
ion
P
a
per
|
0 20 40 60 80 100 120 140 160 180
0 5 10 15 20 25 30 35 40
ozone partial pressure, nbar
pressure altitude, km
LLM h
1=10−11 km, h2=16−17 km
h
1=11−12 km, h2=16−17 km
sonde
⋅
SAGE−IImerged
ozone sondes only
SAGE−II only
5−point linear transition at the second tropopause
Fig. 7. Ozonesonde profiles, SAGE-II profiles and the merged ozone profiles for double tropopauses in February at latitudes 30–40◦N. Red and blue lines correspond to di
fferent dou-ble tropopause heights. Dotted lines: SAGE-II climatological profiles, dots: ozonesonde profiles, dashed lines: merged TpO3 climatological profiles. The LLM climatological profile (gray solid line) is presented for reference.
ACPD
13, 21345–21382, 2013A novel tropopause-related climatology of ozone
profiles
V. F. Sofieva et al.
Title Page
Abstract Introduction
Conclusions References
Tables Figures
◭ ◮
◭ ◮
Back Close
Full Screen / Esc
Printer-friendly Version Interactive Discussion
Discussion
P
a
per
|
D
iscussion
P
a
per
|
Discussion
P
a
per
|
Discuss
ion
P
a
per
|
0 50 100 150
0 5 10 15 20 25 30 35 40 45
pressure altitude, km
January
0 50 100 150 200
0 5 10 15 20 25 30 35 40 45
April
0 50 100 150
0 5 10 15 20 25 30 35 40 45
ozone partial pressure, nbar
pressure altitude, km
July
0 50 100 150 200
0 5 10 15 20 25 30 35 40 45
ozone partial pressure, nbar
October 60°N−70°N 60°S−70°S 30°N−40°N 30°S−40°S 0°N−10°N