I .
'-$
FUNDAÇÃO GETULIO VARGASセD@
FGV
EPGElhe effect of financiai repression &
enforcement on entrepreneurship and
economic development
TIAGO CAVALCANTI
(Universidade Federal de Pernambuco)
Data: 17/08/2006
(Quinta-feira)
Horário:
16h
Local:
Praia de Botafogo, 190 - 110 andar Auditório nO 1
Coordenação:
The Effect of FinanciaI Repression
&
Enforcernent
on Entrepreneurship and Econornic DeveIoprnent*
Antônio Antunes
tTiago Cava1canti+
Anne Villamil
§March 10, 2006
Abstract
This paper studies the effect of financiaI repression and contract enforcement on en-trepreneurship and economic development. We construct and solve a general equilibrium mo deI with heterogeneous agents, occupational choice and two financiaI frictions: intermedi-ation costs and financiaI contract enforcement. Occupintermedi-ational choice and firm size are deter-mined endogenously, and depend on agent type (wealth and ability) and the credit market frictions. The mo deI shows that differences across countries in intermediation costs and en-forcement generate differences in occupational choice, firm size, credit, output and inequality. Counterfactual experiments are performed for Latin American, European, transition and high growth Asian countries. We use empirical estimates of each country's financiaI frictions, and United States values for all other parameters. The results allow us to isolate the quantitative effect of these financiaI frictions in explaining the performance gap between each country and
the United States. The results depend critically on whether à general equilibrium factor price
effect is operative, which in turn depends on whether financiaI markets are open or closed.
This yields a positive policy prescription: If the goal is to maximize steady-state efficiency,
financial reforms should be accompanied by measures to increase financiaI capital mobility.
JEL Classification: E60; G38; 011
K eywords: FinanciaI frictions; FinanciaI reform; Occupational choice; Development
*We thank Gabriele Camera, Steve Gjerstad, Humberto Moreira, Stephen Parente, and Martin Schneider for helpful suggestions. We have also benefited from comments by audiences at the SED Meeting 2005, European Economic Association Congress 2005, SAET Meeting 2005, Minneapolis Fed, Banco de Portugal, University of Illinois, and Purdue University. This material is based upon work supported by the National Science Foundation under grant SES-031839. We are responsible for any remaining errors.
tBanco de Portugal, Departamento de Estudos Económicos, and Faculdade de Economia, Universidade Nova de Lisboa. Email: ara@fe.unLpt.
+Departamento de Economia, Universidade Federal de Pernambuco, INOVA, Faculdade de Economia, Universi-dade Nova de Lisboa. Email: cavalcan@fe.unLpt.
§ Corresponding author: Anne P. Villamil, Department of Economics, University of Illinois at Urbana-Champaign.
1 Introduction
FinanciaI intermediation costs and contract enforcement vary considerably across countries and with the leveI of economic development. For example, Demirgüç-Kunt, Leaven and Levine (2004) document that the net interest margin, which reflects explicit and implicit financiaI sector taxes ( e.g., taxes on financiaI transactions, intermediary profits or inflation) and bank regulation (e.g., • barriers to entry and non-interest-bearing reserve requirements), is over 10% in Belarus, Burundi and Ghana, but less than 2% in the Netherlands and Switzerland.1 Similarly, data from the The
World Bank (2005a) shows that collateral and bankruptcy laws vary considerably across countries,
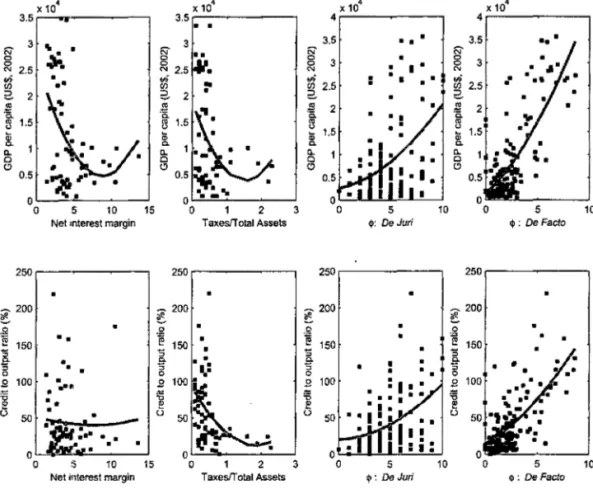
-as does the quality of the judicial system in which the laws are enforced. Seminal research by La Porta, Lopes-de-Slllanes, Shleifer and Vishny (1998) shows that institutions that affect contract enforcement are correlated with the leveI of economic development (see figure 2). We study the quantitative effects of these financiaI frictions on three measures of macroeconomic development: output per capita, total credit and income inequality.
We construct a general equilibrium model with heterogeneous agents and two financiaI fric-tions - limited enforcement and intermediation costs. Agents choose to be either workers or en-trepreneurs, as in Lucas' (1978) "span of control" modeI. We make a key modification byassuming that firms use capital in addition to labor; see Antunes and Cavalcanti (2005). Heterogeneous abil-ity is exogenous, in the sense that the abilabil-ity to manage a firm productively is drawn from a fixed distribution and is independent within and across generations. In contrast, agents choose
con-sumption and capital bequests to ュ。クゥセゥコ・@ preferences subject to lifetime wea1th. Bequests thus
connect generations across time periods and the bequest distribution evolves endogenously. We
study two capital market frictions: a deadweight cost to intermediate loans and an incentive con- セ@
straint to ensure loan repayment. The capital of each entrepreneur depends on the profitability of the project and the entrepreneur's net worth. Thus, the most able individuaIs will not necessarily become entreprenelirs or operate firms of the unconstrained optimal size. Rather, occupational choice and firm size are determined endogenously by an agent's type (ability and bequest) and the credit market frictions.2
We calibrate the model economy so that the long run equilibrium matches key statistics of the Vnited States economy. We then explore how the equilibrium properties of the model change with variations in the two policy variables, intermediation costs and the leveI of contract enforcement. First, we consider benchmark changes in the value of the policy parameters. Next, we use inde-pendent estimates of intermediation costs and contract enforcement for Brazil, France, Russia and Singapore, keeping the other parameters at the V.S. leveI. Through this counterfactual exercise, we evaluate how much V.S. output per capita and credit would be if financiaI contract enforcement and intermediation costs were the same as in, for instance, BraziI.
The effects of these financiaI market imperfections depend on two opposing forces: a demand
effect and a general equilibrium effect. When intermediation costs increase or enforcement weakens, the demand for loans by entrepreneurs decreases for a given interest rate. This is the demand effect. _ When the interest rate is exogenous (e.g., the economy is open to international capital flows), this is the only effect in the loan market. Consequently, less productive and smaller firms operate because a larger number of these firms is required to clear the labor market. When the interest rate is ..
lThe net interest margin is a measure of the wedge between borrowing and lending rates. See figure 2.
2 Antunes, Cavalcanti and Villamil (2006) prove the existence of a unique stationary equilibrium that is fully
&
...
endogenous (e.g., international capital mobility is restricted), a fall in the demand for borrowing' decreases the interest rate. A lower interest rate implies higher capital, productivity, and firm size. This is the general equilibrium effect. When the interest rate is endogenous, the overall effect of the change depends on these two opposing forces.
Our simulations show that the quantitative effect of financiaI reform depends critically on whether capital markets are open or c1osed. For instance, when financiaI contract enforcement and intermediation costs change from the Brazilian to the V.S. leveI, output per capita increases by roughly 90% when capital is mobile (this is about half of the difference in output per capita
between Brazil and the Vnited States),3 but by only 6% when international capital fiow is restricted.
Thus, the general equilibrium factor price effect is quantitatively significant and yields a positive
policy prescription: If the goal of a policy maker is to maximize steady-state macroeconomic
efficiency, financiaI market reforms should be accompanied by a fall in barriers to financiaI capital mobility. The effect of financiaI reform on entrepreneurs' income inequality is also striking. When capital mobility is high, financiaI reform decreases borrowing costs. Fewer but more able managers become entrepreneurs, and this is more efficient. Inequality increases because more able managers operate firms. When capital is not mobile, the interest rate increases after an identical financial market reformo This offsets the loan demand effect, especial1y for able but capital constrained entrepreneurs at the upper tail of the entrepreneurial in come distribution.
Finally, we show that the two credit market frictions are fundamentally different. Intermedia-tion costs are less disruptive than enforcement problems when the economy is open to internaIntermedia-tional financiaI fiows. For instance, when the interest rate is exogenous and intermediation costs increase by a factor of four, output per capita decreases by 15%. When enforcement decreases by a factor of four, output decreases by roughly 42%. Enforcement clearly has a stronger demand effect than intermediation costs. When capital markets are closed, increasing intermediation costs four-fold
decreases output by 6.3%; the same fall in the enforcement parameter decreases output by only
3.1
%.
Thus, the offsetting general equilibrium effect is also stronger for changes in the enforcementparameter. The two policies differ because intermediation costs are a form of financiaI repression
which drive a wedge between the effective interest rate on borrowing and lending.4 As is common
with tax wedges, some times this burden can be shifted. Enforcement operates through a different
mechanism. Because borrowers cannot commit ex-ante to repay, those that default incur a pena1ty
on output net of wages which refiects the strength of contract enforcement in the economy. Banks will grant loans only if it is in the firm's interest to repay fully, and this constraint binds for some parameter configurations. When enforcement is strong the credit market operates; when it is weak the market can cease to function and firms are funded (inefficiently) only by bequests.
The paper proceeds as follows. Section 2 describes the model. Section 3 considers the
oc-cupational choice problem. Section 4 describes the mo deI calibration. Section 5 contains policy experiments designed to evaluate the effects of benchmark changes in the two financial frictions. Section 6 performs counterfactual experiments for selected countries. Finally, section 7 concludes.
3Interestingly, intermediation costs and contract enforcement can explain all the difference in output per capita and total private credit as a share of output between France and the United States.
2 The model
Consider an economy with a continuum of measure one individuaIs. Each individual lives for one period and reproduces another such that population is constant. Time is discrete and infinite
(t = 0,1,2, ... ). There is one good that can be used for consumption or production, or left to the
next generation as a bequest.
2.1 Preferences, endowments and technology
2.1.1 Preferences
Agents care about their own consumption and leave a bequest to their offspring. Let c; and b;+l
denote consumption and bequests, respectively, by agent i in period
t.
Preferences are given by(1)
The utility function implies that agents are risk-neutral with respect to income as the indirect utility function is linear in wealth. This implies that any additive punishment or reward in utility may be measured in terms of income. Notice that, for tractability, we assume that preferences are for the bequest and not the offspring's utility.5
2.1.2 Endowments
Each individual can be either a worker or an entrepreneur. Entrepreneurs create jobs and manage their labor force, n. As in Lucas (1978), each individual is endowed with a talent for managing, セL@
Xi, drawn from a continuous cumulative probability distribution function f(x) where x belongs to
the intervalO and 1. Thus, in each period agents are distinguished by their initial bequest and I
ability as entrepreneurs, H「セL@
xD.
We assume that an agent's talent for managing is not hereditaryand (b;'
xD
is public information. For notational convenience, in the remainder of the paper wedrop q,gent superscript i.
2.1.3 Production sector
Managers operate a technology that uses labor, n, and capital, k, to produce a single consumption
good, y, that is represented by
y = xkQ
n(3, a, f3
>
0, and a+
f3<
1. (2) Capital fully depreciates between periods. Managers can operate only one project.2.2 The capital market
Agents have two options in which to invest their initial wealth:
• FinanciaI Intermediaries: Agents can competitively rent capital to financial intermediaries
and earn an endogenously determined interest rate, r.
•
• Private Equity: Agents can use their own capital as part of the amount required to start a business. They borrow the remaining capital they require from a financiaI intermediary at interest rate r B.
Competition among lenders implies that the effective interest rate on borrowing is rB = r
+
7,where 7 reflects transaction costs such as explicit and implicit financiaI sector taxes (e.g., taxes
on financiaI transactions, intermediary profits or inflation), or bank regulations (e.g., reserve and liquidity requirements). For expositional and computational purposes, we use the equivalent setting where all agents deposit their initial wealth in a financiaI intermediary and earn return r. The intermediaries lend these resources to entrepreneurs, who use their initial wealth as collateral for the loan. The interest rate on the part of the loan that is fully collateralized is r, while the rate on the remainder is r B.
We assume that borrowers cannot commit ex-ante to repay. Those that default on their debt
incur a cost equal to percentage cP of output net of wages. This is equivalent to an additive utility
punishment. This penalty reflects the strength of contract enforcement in the economy.6
3 Optimal behavior and equilibrium
3.1· Entrepreneurs
Agents who have sufficient resources and managerial ability to become entrepreneurs choose the leveI of capital and the number of employees to maximize profit subject to a technological con-straint and (possibly) a credit market incentive concon-straint. Let us first consider the problem of an entrepreneur for a given leveI of capital k and wages w:
7r(k x' w)
, ,
= max xkCin/3 - wn,
n (3)
which yields the labor demand of each entrepreneur:
(
/3
XkCi )ャセゥS@
n(k, x; w) = -;;;- (4)
Substituting (4) into (3) yields the entrepreneur's profit function for a given leveI of capital,
1
(/3)
6
7r(k, x; w) = (1 - (3) (xkCi) 1-13 w (5)
Unconstrained Problem. In an environment where initial wealth is sufficient for the agent to start her own business without resorting to credit finance (i.e., b
>
a and l = O), entrepreneurs solvethe probIem
max7r(k, x; w) - (1
+
r)k.k2:0
This gives the optimal physical capital leveI:
( (/3)/3(
aIQMOSIセ@
k*(x'w r) , , = x -w - -l+r
(6)
(7)
There is no credit market incentive constraint because when the firm is entirely self-financed, no repayment problem exists.
Constrained Problem. We now consider the case where the entrepreneur's initial wealth may not be sufficient to finance the firm (i.e., b
2:
a and I2:
O). Let a be the amount of self-financed capital ( or, equivaIentIy, the part of the Ioan that is fully collateralized by the agent' s personal assets), and [ be the amount of funds borrowed from a financial intermediary (or, equivalently, the amount • of the Ioan that is not collateralized). In this case the entrepreneur may wish to obtain Ioans from the credit market. Since agents cannot commit to repay, Ioan contracts must be seIf-enforcing.The entrepreneur now maximizes the net in come from running the project
v
(b, x; w, r) = max 71"( a+ [,
x; w) - (1+
r)a - (1+
r+
7)1。セoL@ iセo@
subject to the credit market incentive constraint and feasibility
cP71"(a
+
I, x; w)2:
(1+
r+
7)[b
2:
a.(8)
(9)
(10) Restriction (9) is an incentive compatibility constraint which guarantees that ex-ante repayment promises will qe honored; see Kehoe and Levine (1993). The restriction states that the percentage of profits the financiaI intermediary seizes in case of default is at Ieast as high as the repayment obligation. We can rewrite this constraint as
cP
l(b, x; w, r) セ@ 71"(k(b, x; w, r), x; w).
l+r+7
Note that the two policy parameters affect this constraint. Penalty cP affects loan size directly; • when enforcement is stronger (cP - t 1) loan size is bigger. 7 In contrast, intermediation cost 7 affects Ioan size indirectIy through the interest rate wedge. Feasibility constraint (10) states that
the amount of seI f finance, a, cannot exceed the entrepreneur's bequest, b.
The constrained probIem yieIds optimal policy functions a(b, x; w, r) and l(b, x; w, r) that define the size of each firm,
k(b, x; w, r) = a(b, x; w, r)
+
l(b, x; w, r).3.1.1 Solutions to the Entrepreneur's Problem
There are four types of solutions to the entrepreneur's probIem:
Case 1. Neither constraint binds. The entrepreneur seIf-finances and does not borrow from the
in-termediary (b
>
a>
O and l = O).Case 2. (10) binds (i.e., a = b
>
O), (9) does not, but l = O. The entrepreneur uses all weaIth to-self-finance and does not borrow from the intermediary. ':
Case 3. (10) binds (i.e., a = b
>
O), (9) does not, and l>
O. The entrepreneur uses alI wealth to self-finance and borrows additional funds from the intermediary.Case 4. Both constraints bind. The entrepreneur uses all wealth to self-finance (a = b) and borrows
(l
>
O) from the intermediary, but is credit constrained, cP71"(a+
l, x; w) = (1+
r+
7)l.7See Quintin (2003) and Guner, Ventura and Yi (2005) for the effect of policies on firm size distributions.
Entrepreneurs invest their entire wealth in their firm as long as b ::; k*(x; w, r). This follows immediately from the fact that the cost of self-finance is lower than using a financiaI intermediary. This implies that firm size k of an entrepreneur (b, x) is such that
<jJ
k::; b+ 7r(b+l,x;w),
1+r+7 (11)
where we have omitted the arguments of k and l for readability. Thus, firm size is limited by an agent's inheritance, b, and the capital market frictions, 7 and <jJ.
3.1.2 Differential Policy Effects
We now establish that intermediation cost 7 and enforcement penalty <jJ have different qualitative
effects on an entrepreneur's optimal choices. In order to see this, notice that when agents are not constrained and fully self-finance their projects, then neither <jJ nor 7 has any effect on an
entrepreneur's firm size (see case 1). When agents are wealth constrained (a = b) but the incentive
compatibility constraint does not bind (cases 2 and 3), then only intermediation cost 7 has a
negative effect on the optimal firm size and profitability. When the incentive constraint binds (case 4), then both enforcement and intermediation costs affect entrepreneurs' optimal choices. Moreover, it can be shown that
!!i.10l.1-
1=
セ@
>
1+
r+
7>
10<jJ 07 l <jJ
where we have omitted arguments for readability. The first equality comes from simple differenti-ation of (9) at equality. The second inequality follows from (9) when it is slack. Finally, the result • is greater than unity because r
>
O,7>
O and the percentage default penalty is O<
<jJ ::; l.:
"
The result implies that enforcement has a stronger effect on the optimal firm size than inter-mediation costs. We will assess the quantitative implications of this theoretical result in section 5.
3.2 Occupational choice
The occupational choice of each agent defines his lifetime income. Define
n
= [0,00) x {セL@ x]. Forany w,r
>
O, an agent (b,x) will become an entrepreneur if (b,x) E E(w,r), whereE(w,r) = ((b,x) E
n:
V(b,x;w,r)2:
w}. (12)Let EC(w,r) denote the complement set of E(w,r) in
n.
Obviously, if (b,x) E EC(w,r), then agents are workers. The following lemma characterizes the occupational choice for a given bequest and entrepreneurial ability.Lemma 1 Define be(x; w, r) as the curve in set
n
such that V(b, x; w, r)=
w. Then there exists an x*(w, r) such that 。「・セセキLイI@<
O for x>
x*(w, r) and 。「・セセwLイI@ = -00 for x = x*(w, r).1. For all x, if b < be(x; w, r), then (b, x) E EC(w, r).
Proof. See lemma 2 of Antunes et aI. (2006). •
Figure 1 shows occupational choice in (b, x) space for the baseline economy in section 4. Lemma
1 and figure 1 indicate that agents are workers when the quality of their project is low, i.e.,
x
<
x*(w, r) (the lightest shaded area). For x セ@ x*(w, r) agents may become entrepreneurs, depending on whether or not they are credit constrained. If bequests are very low, agents areworkers even though their entrepreneurial ability is higher than x*(w, r). The negative association
between be(x; w, r) and x suggests that managers with better managerial ability need a lower leveI
of initiaI wealth to run a firmo This is intuitive since profits are increasing in managerial ability.
ê
êií
Q)
::>
CT
Q)
co
3.3 Consumers
Figure 1: Occupational choice.
Workers
Ability (x)
In period t, the lifetime wealth of an agent characterized by (bt , Xt) is given by
(13)
Lifetime wealth is thus a function of agent-specific bt and Xt, and economy-wide Wt and rt. Given •
lifetime wealth, (13), agents choose consumption and bequests to maximize preferences (1). This problem defines optimal consumption, Ct
=
c(yt), and bequest, bt+l=
b(yt), policies. Thefunc-tional form of (1) implies that agents leave a proportion 1- 'Y of their lifetime wealth as a bequest.
•
"
--- - - l
3.4 Competitive equilibrium
Let Tt be the bequest distribution at period
t,
which evolves endogenously across periods. Theinitial bequest distribution, To, is exogenously given. In a competitive equilibrium, agents op-timalIy solve their problems and alI markets clear. The agents' optimal behavior was previously
described in detaiI. It remains, therefore, to characterize the market equilibrium conditions.8 Since
the consumption good is the numeraire we need two market clearing conditions to determine the wage rate and the interest rate. The labor and capital market equilibrium equations are:
11
n(x; Wt, rt)Tt(dbt)r(dXt) =11
Tt(dbt)r(dXt) (14)zEE(wt,rt) zEEC(wt,rt)
11
k(bt , Xt; Wt, rt)Tt(dbt)r(dXt) =11
bt Yt(dbt)r(dXt). (15) zEE(wt,rt)Given that the only connection between periods is the bequest, it is essential to provide the law of motion for the distribution of bequests to fulIy characterize the competitive equilibrium. Define Pt(bt , A) = Pr{bt+1 E Albt } as a non-stationary transition probability function, which assigns a probability for a bequest in t
+
1 for the descendant of an agent that has bequest bt . The law ofmotion of the bequest distribution is
(16) In the quantitative exercises it is important to evaluate policy experiments in "stable" economies, where, for instance, the real wage, the interest rate and the in come distribution are not changing significantly over time. Antunes et aI. (2006) show that when policies and institutions are sta-tionary a uni que steady-state equilibrium exists (i.e., an equilibrium with a constant real wage and interest rate, W and r, and invariant distribution, H = Yr); from any initial condition the economy converges to this equilibrium.
Proposition 2 There exists a unique stationary equilibrium with W
>
O, r-I<
00 and invariant distribution Y. In addition, for any initial bequest distribution Yo, interest rate O<
r - I<
00, and stationary credit market frictions (7,cP),
the bequest distribution converges to Y.Proof. See Proposition 2 in Antunes et aI. (2006). •
In the calibration and quantitative experiments we study the economy in this particular equi-librium. Thus, we consider the long run impact of changes in policies and institutions.
4
Measurement
In order to study the quantitative effect of financiai repression and contract enforcement on en-trepreneurship and economic development, we must assign values to the model parameters and specify a functional form for the distribution of managerial ability. Our strategy is to calibrate the model economy such that the long run equilibrium matches some key statistics of the U .S. economy.
イMMMMMMMMMMMMMMMMMMMMMMMセセセセセセセセセセセセセMMMMMMMMMMMMMG@
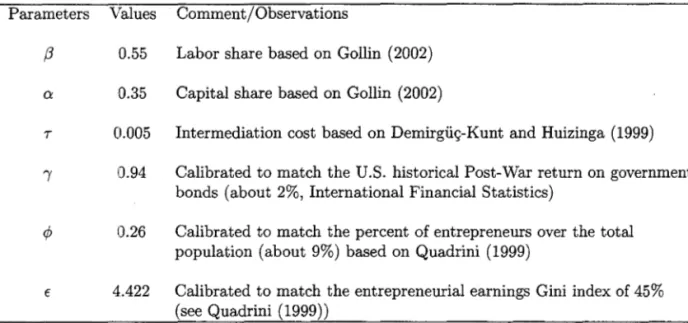
Table 1: Parameter values, baseline economy.
Parameters Values CommentjObservations
f3 0.55 Labor share based on Gollin (2002)
Q 0.35 Capital share based on Gollin (2002)
7 0.005 Intermediation cost based on Demirgüç-Kunt and Huizinga (1999)
, 0.94 Calibrated to match the U.S. historical Post-War return on government bonds (about 2%, International FinanciaI Statistics)
0.26 Calibrated to match the percent of entrepreneurs over the total population (about 9%) based on Quadrini (1999)
€ 4.422 Calibrated to match the entrepreneurial earnings Gini index of 45%
(see Quadrini (1999))
We assume that the cumulative distribution of managerial ability is given by r(x) = xセNY@ When E
is equal to one, entrepreneurial talent is uniformly distributed in the population. When E is greater
than one the talent distribution is concentrated among low talent agents. We define the model period to be 35 years. Model parameters whose values must be assigned are: (O:', (3, "I, E, cP, T). Table セ@
l1ists the value of each parameter and includes a comment on how each was selected.10 We set O:'
and (3 such that about 55% of in come is paid to labor, 35% is paid to the remuneration of capital,
•
and 10% are profits.l1 We use tax as a percentage of total bank assets to measure intermediation
costs, which in the United States is 0.5%.12
We must determine the value of three remaining parameters: The fraction of total in come that is left to the next generation, 1 - "I, the strength of financiaI contract enforcement, cP, and the curvature of the entrepreneurial ability distribution, E. We choose these three parameters such
that in the baseline model the real interest rate is 2%,13 the percent of entrepreneurs over the total population is about 9%, and the Gini index of entrepreneurial earnings is about 45%.14 The
9Chaterjee, Corbae, Nakajima and Ríos-Rull (2002) have shown that this functional form can generate an earnings distribution that is similar to the U.S. distribution.
10 Appendix A contains sensitivity analysis for each parameter. The results are robust to all parameters except
utility parameter " which determines bequests.
11 Gollin (2002) argues that it is important to adjust factor income shares by entrepreneurial income, which is often
treated incorrectly as the capital income share. If we include entrepreneurial profits as labor income as suggested by Gollin, the effective labor and capital income shares will be 0.65 and 0.35, respectively. These income shares are those that map our mo dei to those observed in the U.S. national accounts. If we use another adjustment suggested by Gollin, which assumes that entrepreneurial income is the same mix of labor and capital income as in the rest of the economy, the effective labor and capital income shares will be roughly 0.61 and 0.39, respectively. In any case, the effective labor income share will be in the range estimated by Gollin, 0.60 to 0.80.
12See Demirgüç-Kunt and Huizinga (1999). A mo dei period corresponds to 35 years, thus the target intermedia-tion cost in our model is 7model = (1
+
0.005)35 - 1 = 0.1907.13We define the real interest rate by the nominal U.S. T-Bill rate minus the realized infiation rate. The average yearly real rate from 1960 to 2000 in the International Financial Statistics (IFS) database is 2%. Since the model period is 35 years, the model interest rate is (1 + 0.02)35 - 1 = 1.
14See Quadrini (1999) for entrepreneurial data in the United States.
:.
•
OI
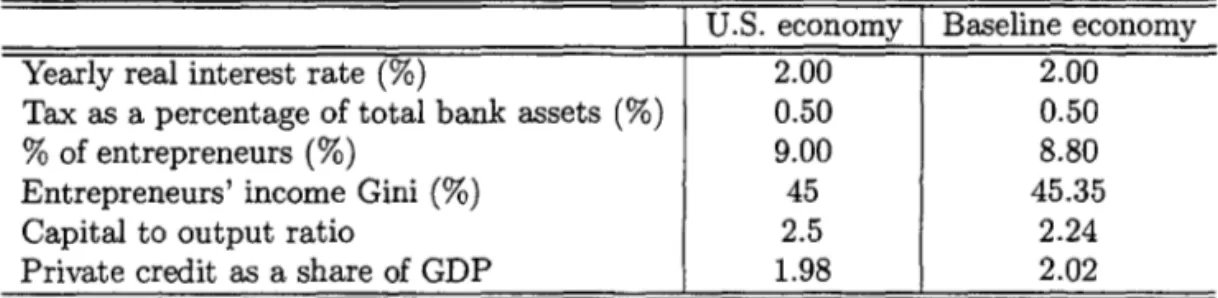
Table 2: Basic statistics, V.S. and baseline economy. Sources: International FinanciaI Statistics database,
Demirgüç-Kunt and Huizinga (1999), Quadrini (1999), Maddison (1995), and Wórld Development
Indi-cators database.
Yearly real interest rate (%)
Tax as a percentage of total bank assets (%)
% of entrepreneurs (%)
Entrepreneurs' income Gini (%)
Capital to output ratio
Private credit as a share of GDP
I
V.S. economyI
Baseline economy 2.000.50 9.00 45 2.5 1.98
2.00 0.50 8.80 45.35
2.24 2.02
calibrated value of 'Y that matches the historical risk-free rate of return on government bonds in the
Vnited States is 0.94. This value suggests that agents in generalleave about 6% of their lifetime
wealth as inheritance to the next generation. Gokhale and Kotlikoff (2000) estimate that bequests
account for 4 to 8% of labor compensation. In the steady state of our model the ratio of bequests to
labor earnings is ャMHャセセIィKイI@ = 0.065, which is in the interval estimated by Gokhale and Kotlikoff
(2000). The カ。セオ・@ of cp in the baselíne economy is 0.26. Cagetti and De Nardi (2002) calibrate an enforcement parameter 1 -
f
that is conceptually identical to cp using a different model and V.S. data. They find that 1 -f
= 0.25, which is similar to our calibrated measure.The model matches the V.S. economy fairly well along a number of dimensions that were
calibrated (the first four statistics in table 2), as well as some statistics that were not calibrated, such as the capital to output ratio and total private credit as a share of output. According to Maddison (1995) the capital to output ratio in the V.S. is roughly 2.5, while in the model it is 2.24. Data from the World Bank Development Indicators show that over the last 15 years the
average total private credit as a share of income in the V.S. was about 1.98, while in the mo dei it
is 2.02. The model does not match the in come Gini: the model income Gini is roughly 33%, while in the data it is 40-44%. However, since every worker receives the same equilibrium wage rate in
the model economy, it follows that it should underestimate its real world counterpart.15
5 Quantitative Experiments
We now explore how the equilibrium properties of the model change with benchmark variations in intermediation costs and contract enforcement. We vary the parameters separately, and then
run experíments in which we change both simultaneously. In all cases we examine the model's
predictions along six dimensions: output per capita as a fraction of V.S. output per capita, the wage
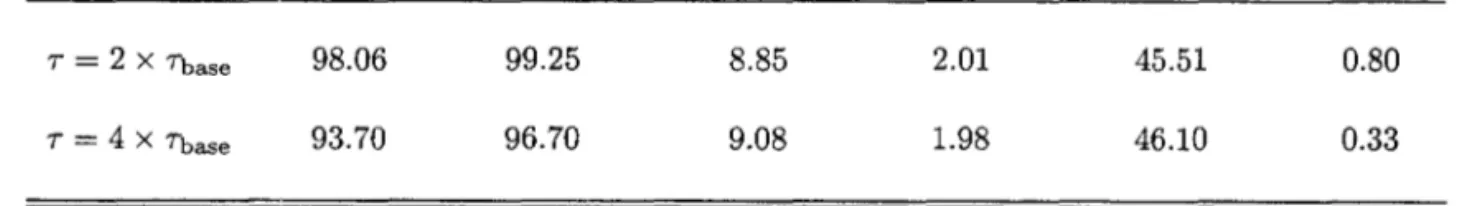
Table 3: Policy Experiments: Intermediation cost. cPbase and 7base denote the baseline parameter values.
Baseline
T = 2 x Tbase
T=4xTbase
T= 2xTbase
T= 4xTbase
Output per capita,
% baseline
VVage, % of
% baseline entrepreneurs
Credit to output
ratio
Entrepreneurs' income
Gini
Interest rate
Part (a): Exogenous interest rate, r. Enforcement parameter, cPbase = 0.26
100.00 100.00 8.80 2.02 45.35 1
95.14 95.35 8.94 1.82 45.20 1
85.24 85.90 9.34 1.46 44.83 1
Part (b): Endogenous interest rate, r. Enforcement parameter, cPbase = 0.26
98.06 99.25 8.85 2.01 45.51 0.80
93.70 96.70 9.08 1.98 46.10 0.33
'"
5.1 Intermediation Costs:
TTab1e 3 describes the mode1's predictions as the va1ue of the intermediation cost parameter is changed. A rise in T has two effects: First, entrepreneurs decrease the demand for loans for a
given interest rate, since the cost of borrowing has increased. This is the demand effect. When the interest rate is exogenous, this is the on1y effect on the loan market. The decrease in loan size lowers the capital input, and a greater number of small firms is required to clear the labor market. More people choose to become entrepreneurs and self-finance their projects, but these additional projects are generally 1ess productive and smaller because they are run by 1ess ab1e managers with smalIer bequests. Second, when the interest rate is endogenous, a falI in the demand for outside finance decreases the interest rate. A lower interest rate implies higher capital, higher productivity and larger firm size. This is the general equilibrium effect. When the interest rate is endogenous, the overalI effect on the economy of a rise in T depends on these two opposing forces.
Quantitative1y, when the interest rate is exogenous and T is quadrupled relative to the baseline, entrepreneurs rise to 9.34%, output per capita falIs to 85.24% of the baseline value, and the outside credit to output ratio falls from 2.02 to 1.46. When the interest rate is endogenous, there is a sharp decrease in r due to the general equilibrium effect. Output per capita falls to 93.70% of its baseline value and the change in the credit to output ratio is smalI, decreasing by only 2% while in the exogenous case it decreases by 28%. When r is fixed, all the adjustment is done by the loan quantity, as the credit to output ratio shows. When r is endogenous, the quantity adjustment in the loan market is much smaller due to factor price movement. There is also a striking difference in the behavior of entrepreneuria1 income inequality. When r is exogenous there are more but less productive entrepreneurs, leading to a decrease in entrepreneuria1 income inequality. When r is endogenous, a falling interest rate increases the size of projects that can be financed, increasing the income of entrepreneurs at the upper tail of the in come distribution. • . However, higher intermediation costs increase the cost of borrowing and therefore have a negative
:
•
impact on the in come of credit constrained entrepreneurs, who in general are in the lower tail of the income distribution.
5.2 Investor Protection:
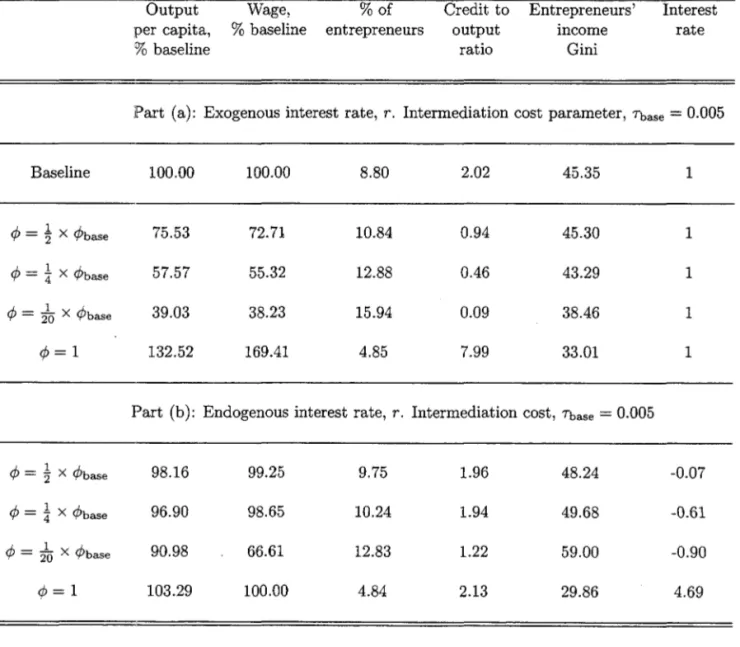
cPTable 4 shows that as the leveI of enforcement decreases (</> --+ O), output per capita and the
credit to output ratio decrease. There are more entrepreneurs in the economy, but they are less productive. The effects are again stronger when the interest rate is exogenous than when it is endogenous. Weaker contract enforcement means that the demand for loans will falI for a given interest rate; see equation (9). Therefore, entrepreneurs decrease working capital and firm size shrinks. For the labor market to clear, more but less productive entrepreneurs enter. This is the demand effect, and it is the only effect in the economy when the interest rate is exogenous. When the interest rate is endogenous, the general equilibrium effect is also operative: a decrease in the demand for borrowing decreases the interest rate, which in turn implies a higher demand for loans. Higher ability entrepreneurs can be funded at lower cost, increasing productivity and firm size.
Quantitatively, when enforcement decreases by a factor of four and the interest rate is exoge-nous, output per capita decreases by roughly 42%, the outside credit to output ratio decreases by roughly 80%, and entrepreneur income inequality decreases. Relative to table 3, observe that enforcement has a stronger demand effect on output per capita than does the intermediation cost.
Table 4: Policy Experiments: Enforcement. c!>base and 7base denote the baseline parameter values.
Baseline
<P = セ@ X <Pbase
<P = セ@ X <Pbase
<P = 210 X <Pbase
<p=1
<P = セ@ X <Pbase
<P =
:t
X <Pbase<P = 210 X <Pbase
<p=1
Output per capita,
% baseline
Wage, % of
% baseline entrepreneurs
Credit to output
ratio
Entrepreneurs' income
Gini
Interest rate
Part (a): Exogenous interest rate, r. Intermediation cost parameter, 7base = 0.005
100.00 100.00 8.80 2.02 45.35 1
75.53 72.71 10.84 0.94 45.30 1
57.57 55.32 12.88 0.46 43.29 1
39.03 38.23 15.94 0.09 38.46 1
132.52 169.41 4.85 7.99 33.01 1
Part (b): Endogenous interest rate, r. Intermediation cost, 7base = 0.005
98.16 99.25 9.75 1.96 48.24 -0.07
96.90 98.65 10.24 1.94 49.68 -0.61
90.98 66.61 12.83 1.22 59.00 -0.90
103.29 100.00 4.84 2.13 29.86 4.69
•
:
•
When the interest rate is endogenous, however, the same falI in the enforcement parameter gen-erates a decrease in output of only 3.1%. Intermediation costs have a stronger effect on output per capita than enforcement (recalI that output decreases by 6.3% when intermediation costs rise by a factor of 4) because the opposing general equilibrium effect is stronger for changes in the en-forcement parameter than for changes in intermediation costs (compare, for instance, the changes in the interest rate).16 This is consistent with the theoretical result in section 3.1.2
We also investigate two limiting cases, qy
=
210 X qybase (virtually no enforcement) and qy=
1 (perfect enforcement). When the interest rate is exogenous, output per capita is roughly 39% and 132% of the baseline economy value with virtually no enforcement and perfect enforcement, respectively. Therefore, a typical agent in an economy with fulI enforcement is about 4.5 times richer than a typical agent in an economy with virtualIy no enforcement of financiaI contracts. The difference in output per capita is much smaller (a factor of about 1.3) when the interest rateis endogenous. We can conclude that although financiaI contract enforcement, qy, can generate
important variations in output per capita, it alone cannot account for the fact that in comes in the richest countries are 30 times higher than in the poorest; see Parente and Prescott (2000).
5.3 Intermediation Costs and Investor Protection:
T,cp
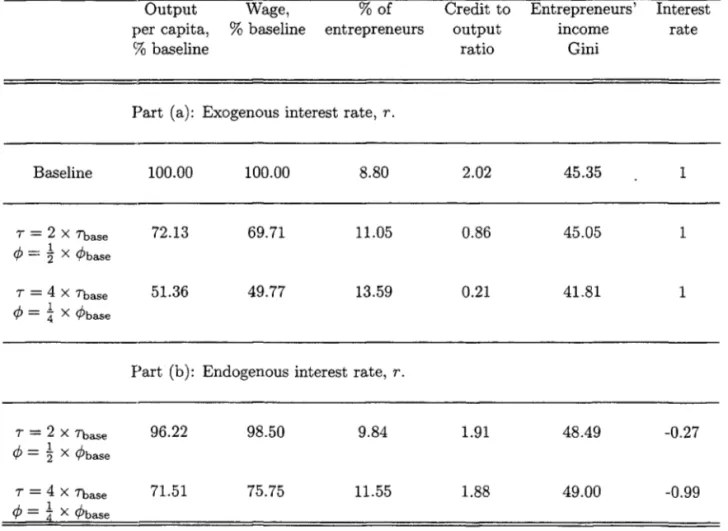
Table 5 reports results of experiments in which both enforcement and intermediation costs are changed. When qy and 7" both worsen by a factor of four, output per capita decreases by about
49% when the interest rate is exogenous and 29% when it is endogenous. This result is consistent with our previous finding that the demand effect is significant, but it is offset by factor price movements associated with the general equilibrium effect when the interest rate is endogenous.
5.4 FinanciaI Market Reforms and Capital Mobility
Our mo deI predicts that negative real interest rates can occur when the interest rate is endogenous, a result that at first glance may seem odd (see the last columns of tables 4 and 5). This result is consistent with the negative interest rates observed in repressed financiaI markets (Le., closed economies with low investor protection and high intermediation costs). Calomiris and Beim (2000) document that Latin America, North Africa and the Middle East had real interest rates ranging from -10% to 0% until the burst of financiaI liberalization in the 1990s, which increased capital mobility. Real interest rates in these regions then increased to the leveI observed in industrialized countries and East Asia. Similarly, the average real interest rate in transition countries reached -35% in 1993, and has increased to the leveI observed in industrialized countries.
Oui quantitative exercises show that the effect of financiaI reform (i.e., changes in contract
enforcement and intermediation costs) on output per capita and inequality depend on whether the economy is open or closed to international financiaI capital flow. When financiaI markets are open (r is fixed) , financiaI market reform has a stronger effect on output per capita due to the absence of the general equilibrium effect. Better enforcement and lower intermediation costs increase loan demand for a given interest rate, which increases the capital stock, labor productivity
and output. When financiaI markets are closed, r is determined endogenously and the increase
in loan demand increases the real interest rate, which in turn has a negative effect on the capital stock, and therefore on output. The offsetting general equilibrium effect occurs only when capital
Table 5: Policy Experiments: Intermediation cost and Enforcement. cPbase and 7base denote the baseline
parameter values.
Output Wage, % of Credit to Entrepreneurs' Interest
per capita, % baseline entrepreneurs output income rate
% baseline ratio Gini
Part (a): Exogenous interest rate, r.
Baseline 100.00 100.00 8.80 2.02 45.35 1
T= 2x7base 72.13 69.71 11.05 0.86 45.05 1
</;-1. </; - 2 X base
..
T= 4xTbase 51.36 49.77 13.59 0.21 41.81 1
</;-1. - 4 X </; base
Part (b): Endogenous interest rate, r.
T= 2xTbase 96.22 98.50 9.84 1.91 48.49 -0.27
</;-1. - 2 X cP base
T= 4xTbase 71.51 75.75 11.55 1.88 49.00 -0.99
</;-1. -!IX base cP
•
:
markets are closed; when they are open only the demand effect is present and financiaI reform may have a sizeable effect on output per capita and entrepreneur income inequality.17
Intuitively, when capital is mobile financiaI reform decreases the cost of outside finance. Tal-ented entrepreneurs are able to start firms and operate them at higher, more productive scaIes. There are fewer, but more productive, entrepreneurs. As a result, output and inequality increase. When capital is not mobile, the interest rate will increase after a financiaI market reformo This in part offsets the effects on productivity, especially for those entrepreneurs in the upper tail of
the entrepreneurial income distribution. These results suggest a positive policy prescription: If a
policy-maker wishes to maximize steady-state macroeconomic efficiency, financiaI market reform should be accompanied by a fall in barriers to financiaI mobility.
6
Counterfactual Analysis
The previous experiments describe quantitative properties of the model for systematic variations in financiaI contract enforcement and intermediation costs. We now use independent estimates of intermediation costs and contract enforcement for several representative countries, keeping the
other parameters at the V.S. leveI. The purpose of this counterfactual exerci se is to investigate what
the leveI of V.S. output per worker would be if financiaI contract enforcement and intermediation
costs were the same as in, for instance, Russia. 18 This gives an estimate of how much of the
difference in output per worker between Russia and the V.S. can be accounted for by differences
in financiaI market imperfections. We discuss Brazil, France, Russia and Singapore in detail, as representatives of Latin America, Europe, a transition country and a high growth Asian country. In the Appendix, we report detailed results for Argentina, Chile, Germany, Hong Kong, ltaIy,
South Korea, Poland and the V .K., and in figures 3 and 4 we summarize results for 25 countries.
For each country, we feed in independent estimates of intermediation costs and contract en-forcement and compare the model's predictions with the relevant country data. Intermediation
costs are measured as intermediary taxes over banks' total assets: 1.1% in Brazil, 0.2% in France,
1.9% in Russia and 0.5% in Singapore.19 Figure 2 shows that the relationship between per capita output and either the net interest margin or intermediary taxes is similar. The relationship be-tween the credit to output ratio and intermediary taxes is stronger than the net interest margin relationship. Because we model T as a deadweight loss, figure 2 verifies that intermediary taxes is
the appropriate measure in our model. Estimates of the contract enforcement parameter are based
on Djankov, McLiesh and Shleifer (2005) and The World Bank (2005a). We use two methods to
assess enforcement parameter cjJ: a de juris measure based on the written laws of a country and a
de facto measure to account for how laws are likely to be enforced. Figure 2 shows that these two measures are qualitatively similar, but we now consider their quantitative significance.
17This result is consistent with Castro, Clementi and MacDonald (2004) and Jeong and Townsend (2005). 18We do not assume that the other parameters in Russia are the same as those observed in the U.S. Our goal is to isolate the effects of intermediation costs and enforcement. As our sensitivity analysis shows, the results might be different if, for instance, the share of bequests over earnings, 1 - 'Y is very different in Russia than in the U.S.
19Intermediation costs can also be measured by the net interest margin, which Demirgüç-Kunt and Huizinga (1999) decompose into its constituent parts: non-interest income, overhead costs, taxes, loan loss provision, and after tax bank profits. Since 7 is a deadweight loss in our model, and some of these components need not be, we
Figure 2: FinanciaI repression, legal enforcement, GDP per capita, and private credit to output ratio. The net interest margin and intermediary taxes over total assets' are from Demirgüç-Kunt and Huizinga (1999). De juris
q;
is the Legal Rights lndex based on data from The World Bank (2005a). De factocp is the Legal Rights Index times the Rule of Law (see Kaufmann et aI. (2003)). GDP per capita and private credit over output are from The World Bank (2005b). GDP per capita is in 2002 US$ adjusted for Purchasing Power Parity. The countries were selected based on data availability. The solid line is the -best second order polynomial fito
X 104 X 104 X 104 X 104
3.5 3.5 4 4
3.5
.
.
3.5..
.
c;;- 3
..
.
c;;-c;;-o
$.
..
o • oセ@ 2.5 o '" 3
.
••
o '" 3<li
.
<li :••
. ·
<li.
(/)
..
セ@ 2.5 セ@ 2.5.
2- 2
S S S 2
·
セ@ 2'õ. 'õ. 'õ. c.
セ@ 1.5 セ@ 1.5 co co
" 1.5 " 1.5
Oi Oi
"
c.
1 c. c.
Il. Il. 1 Il. 1
o o o
(!) (!) (!)
0.5 0.5
o o o
o 5 10 15 2 3 o 5 10 o 5 10
Nel ,nleresl margin T axesIT atai AsseIs <1>: DeJuri <1>: De Facto
250 250 250 250
セ@ 200
ê セ@セ@ 200 セ@ê 200 セ@セ@ 200
セ@
..
Nセ@.
セ@o 150 セ@o 150150 150
"S セ@
.
"S "S.e-
.
..
.e- c.•
" o
·
.
.
" o..
: " o·
"S o. .
.E 100
.
.E 100k
.E 100 .E 100...
セ@
·
i
'õ 'õi!! • • i!! i!!
() • () 50 () ()
50 セ@
.
•
-
50J ,
...
.
.
. .
.
. .
. .
O O
O 5 10 15 O 2 3 5 10 5 10
Nel il1leresl margin TaxeslTolal AsseIs <1>: De Juri <1>: DeFacto
6.1
De juris
cp
For the de juris measure we use a legal rights index which indicates the degree to which collateral and bankruptcy laws facilitate lending. This index follows previous work by La Porta et aI. (1998), and includes seven aspects of collateral law and three aspects of bankruptcy law. 20 The index
ranges from O to 10, with higher scores indicating that collateral and bankruptcy laws are better designed to promote access to credito To determine the parameter estimate for
q;,
we multiply the ratio of the legal rights index of a country to the V.S. value by the baselineq;
= 0.26. For Brazil,the corresponding value is
q;
=
0.074. France and Russia have the same value ofq;
=
0.11, while in Singapore the estimated value isq;
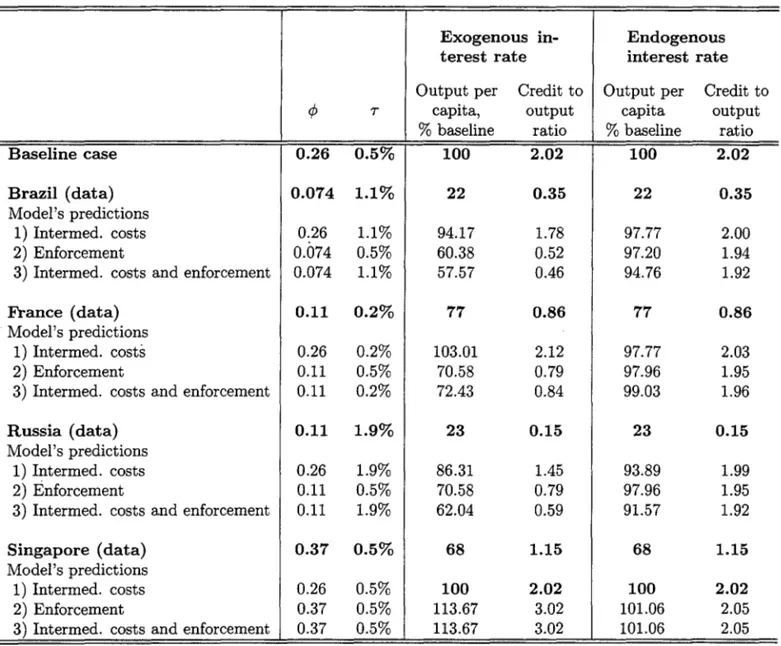
= 0.37.Table 6 shows that when the interest rate is exogenous, contract enforcement and intermediation costs alone explain roughly half of the difference in output per capita between Brazil and the V.S., and almost the whole difference in total private credit as a share of GDP. When the interest rate is endogenous, financiaI market imperfections explain only a small part of the difference in output per capita, but a large part of the difference in the credit to output ratio. Simulations using Russian
20The index contains data on the duration of time to enforce a contract and costs (court and attorney fees) across countries. The legal rights index is: Brazil 2, France and Russia 3, Singapore 10 and V.S. 7.
•
•
Table 6: De juris
cp.
Empirical Data and Model Predictions for Reference Economies.Exogenous in- Endogenous
terest rate interest rate
Output per Credit to Output per Credit to
cp T capita, output capita output
% baseline ratio % baseline ratio
Baseline case 0.26 0.5% 100 2.02 100 2.02
Brazil (data) 0.074 1.1% 22 0.35 22 0.35
Model's predictions
1) Interrned. costs 0.26 1.1% 94.17 1.78 97.77 2.00
2) Enforcernent 0.074 0.5% 60.38 0.52 97.20 1.94
3) Interrned. costs and enforcernent 0.074 1.1% 57.57 0.46 94.76 1.92
..
France (data) 0.11 0.2% 77 0.86 77 0.86Model's predictions
•
1) Interrned. costs 0.26 0.2% 103.01 2.12 97.77 2.032) Enforcement 0.11 0.5% 70.58 0.79 97.96 1.95
3) Interrned. costs and enforcernent 0.11 0.2% 72.43 0.84 99.03 1.96
Russia (data) 0.11 1.9% 23 0.15 23 0.15
Model's predictions
1) Intermed. costs 0.26 1.9% 86.31 1.45 93.89 1.99
2) Enforcement 0.11 0.5% 70.58 0.79 97.96 1.95
3) Intermed. costs and enforcement 0.11 1.9% 62.04 0.59 91.57 1.92
Singapore (data) 0.37 0.5% 68 1.15 68 1.15
Model's predictions
1) Intermed. costs 0.26 0.5% 100 2.02 100 2.02
2) Enforcement 0.37 0.5% 113.67 3.02 101.06 2.05
3) Interrned. costs and enforcernent 0.37 0.5% 113.67 3.02 101.06 2.05
data yield similar results. Interestingly, when the interest rate is exogenous, intermediation costs and financiaI contraC1G enforcement explain all the difference in output per capita and the credit to output ratio between France and the D.S.
Singapore is particularly interesting because measured enforcement of financiaI contracts is higher than in the D.S., but output per capita is 32% lower. When the interest rate is exogenous
our model indicates that output per worker would be 13% higher in the D .S. if contract enforcement •
were similar to Singapore. Two alternatives may account for the discrepancy between the mo deI predictions and data for Singapore: i) Other factors (e.g., total factor productivity or differences in •
bequests in Singapore and the D.S., as measured by parameter 1 - "y) may explain why Singapore
has higher contract enforcement, but a lower leveI of output per capita and credit over output than the D.S. ii) Creditor protection and total credit (productivity) may not have a monotonic relation as assumed in Kehoe and Levine (1993) type mo deIs , where borrowers have an incentive to default if the punishment is less than the debt repayment obligation. Lenders know this, and rationally limit the supply of credito Higher creditor protection leads to a higher credit supply; there is no default in equilibrium, thus increasing the punishment is welfare improving. In contrast, recent work by Dubey, Geanakoplos and Shubik (2005) shows that when some agents default in equilibrium there ma}" be an optimum leveI of creditor protection. Increasing the punishment for default beyond this leveI is not welfare enhancing because borrowers might decrease the demand
for outside financing, decreasing capital and output.21 This is clearly an important issue for future
research.
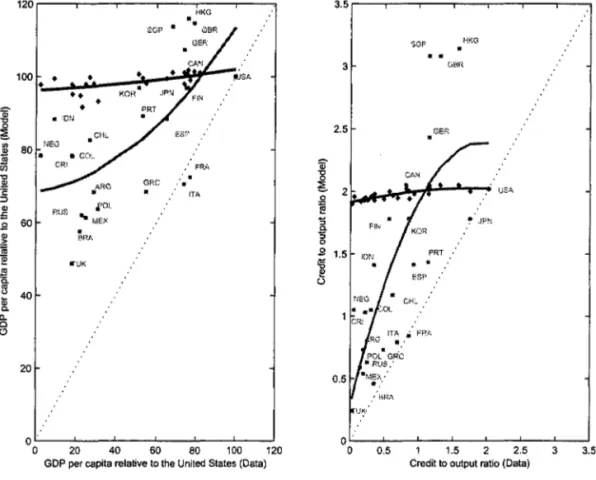
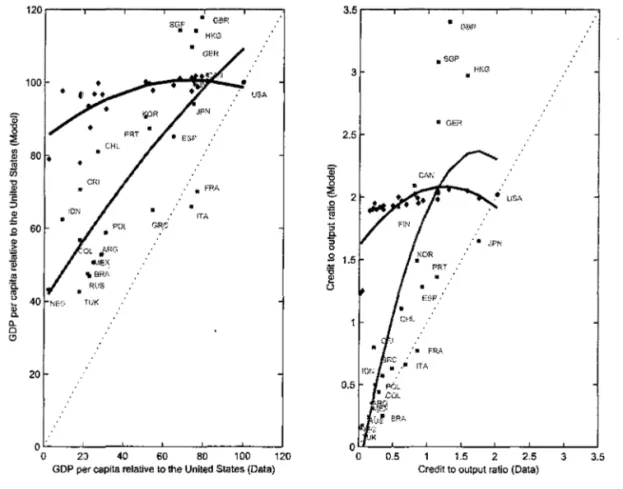
Figure 3 reports the performance of our mo deI for 25 countries. The figure shows the predicted
output per capita (and the credit to output ratio) relative to the V.S. leveI of relative output per
capita observed in the data. If imperfections in the financiaI sector explained all the difference in
-output per capita between a particular country and the V.S., then the point would lie on the 45° ...
line. We observe three important features from this figure: i) when the interest rate is exogenous • (capital markets are open), there is a strong positive correlation between model predictions and observed data; ii) the model tends to predict values that are higher than those observed in the data, but this is not surprisíng given that we focus on only two capital market frictions and abstract from all other differences among countries (i.e., TFP, labor market institutions, government policies, etc.); iii) when the interest rate is endogenous, there is a sharp difference between the predictions of the mo deI and the data for most countries. On (iii), we note that recent waves of financiaI market liberalization have opened many capital markets. Interestingly, for some European countries, such as France, Italy and Greece, our model indicates financiaI reform would have a quantitatively important effect on aggregate output.
6.2
De facto
q;
In the previous counterfactual exercises we used a legal rights index as a proxy for investor
pro-tection parameter
cp,
which measures the degree to which de juris collateral and bankruptcy laws _facilitate lending. However, the written law is only part of investors' legal protection. Another -part is the overall quality of the rule of law in the country, as this determines how the written law is enforced in practice. Following Araújo and Funchal (2005), we now define investor protection by the previous legal rights index times a rule of law indicator. The rule of law index, which is
21Por the V.S., recent work by Grant (2003) shows that increasing the punishment for default increases debt held as suggested by Kehoe and Levine (1993). However, consumption is smoother in high exemption states.
20
•
..
Figure 3: De juris
q;.
Empirical Data and Model Predictions for Selected Economies. Gray squares: Modelpredictions with an exogenous interest rate. The gray solid line is the best second order polynomial fit for the model with an exogenous interest rate. Blue diamonds: Model predictions with an endogenous interest rate. The blue solid line is the best second order polynomial fit for the model with an endogenous interest rate. The dashed line is the 45° line.
120,..---,---.,...--.,...--.,.---.,...---,
HKG
!3 80 .NE0
Cõ
Ci5
セ@
·c
:;j
Q)
:;
.Si 60
Nセ@Cõ "ê
:ê
セ@
Q) Co a. o c.!l 40 20
" FRA
...
GF{C .•
.
ITAiMQャjセ@ ,{'OI.
.. MEX
"UK
ッセᄋ⦅セMセMセMセMセMセ@
o 20 40 60 80 100 120
GDP per capila relative lo lhe Uniled Slales (Data)
セ@
l
.Q"§
I
3
2.5
SGP HKG
GBH
.GER
.Si 1.5 PRT "
セ@
t.> f$P .
CHL
ᄋオセNᄋᄋ@
ッセᄋ⦅セセセセMセMセセMセ@
O 0.5 1.5 2 2.5 3 3.5 Credil lo oulpul ralio (Data)
computed by Kaufmann et aI. (2003), measures the degree to which laws are enforced in society.22 According to this index, the V.S. has a score of 5.588 while Brazil has a score of 0.88.23 This mea-sure of de facto enforcement results in higher variation in investor protection than does the legal rights index alone. Investor protection between the V.S. and Brazil now varies by a factor of 6.35, almost twice the alternative measure. Interestingly, figure 4 shows that the correlation between the model and the data is even better for de facto measure. Most countries are doser to the 45° line. Notice that for an exogenous interest rate financiaI market imperfections explain almost the whole difference in output per capita for some European countries (France, ltaly and Greece), and a significant part of the gap for some Latin American countries (Brazil, Mexico and Argentina) and Transition Economies (Russia and Poland). The pattern for exogenous and endogenous interest rates is also similar to figure 3, for reasons explained previously.
Table 7 reports quantitative results for the de facto measure of enforcement for the four reference countries. See the Appendix for eight additional countries. The alternative enforcement measure does not change significantly for France and Singapore, therefore the quantitative counterfactual
22We use the 2002 ruIe of Iaw index, which varies from -2.5 to 2.5. Higher scores indicate that agents have higher confidence in the ruIes of society. We normalize it to a O to 10 interval.
Figure 4: De facto <jJ. Empirical Data and Model Predictions for Selected Economies. 'Gray squares:
Model predictions with an exogenous interest rate. The gray solid line is the best second order polynomial fit for the model with an exogenous interest rate. Blue diamonds: Model predictions with an endogenous interest rate. The blue solid line is the best second order polynomial fit for the model with an endogenous interest rate. The dashed line is the 45° line.
120 r---r---r---r---.,---.,----.
SGP • G8R
• • H;":O
USA
20
ッセMセMセMセMMセMセセ@
o 20 40 60 80 100 120
GDP per capila relalive lo lhe Uniled Slales (Dala)
3.5.----,---,---,----,--,--... ---.
'ijf
'8
3
2.5
セ@ 2
.2 "§
"
.s-"
o 9 1.5
セ@
ü
0.5
• SGP
• gefセ@
,'. ,lPt'>:
PRT "
,'. FR,ol..
1.5 2 2.5 3 3.5
Credil lo oulpul ralio (Dala)
・ク・イ」ゥセ・ウ@ for thesé countries are similar to those reported for the de juris measure. The results, however, are quite different for Brazil and Russia, since these countries have a much lower leveI of investor protection when the rule of law is introduced. When investor protection falls from the V.S. to the Brazilian leveI, output per capita falls by 50% and the credit to output ratio falls to 0.28. This implies that de facto enforcement alone accounts for roughly 64% of the difference in output per capita between the V.S. and Brazil. It also accounts for the whole difference in the credit to output ratio. Results for Russia are quantitatively similar to those observed in Brazil, except that in Russia Lntermediation costs play a larger role than in Brazil.
•
•
Table 7: De facto cP. Empirical Data and Model Predictions for Reference Economies.
Exogenous in- Endogenous
terest rate interest rate
Output per Credit to Output per Credit to
<P T capita, output capita output
% baseline ratio % baseline ratio
Baseline case 0.26 0.5% 100 2.02 100 2.02
Brazil (data) 0.039 1.1% 22 0.35 22 0.35
Model's predictions
1) Interrned. costs 0.26 1.1% 94.17 1.78 97.77 2.00
2) Enforcernent 0.039 0.5% 49.22 0.28 93.79 1.91
3) Interrned. costs and enforcernent 0.039 1.1% 47.57 0.25 93.50 1.90
..
France (data) 0.10 0.2% 77 0.86 77 0.86•
Model's predictions 1) Intermed. costs 0.26 0.2% 103.01 2.12 97.77 2.032) Enforcernent 0.101 0.5% 68.35 0.73 97.67 1.94
3) Intermed. costs and enforcement 0.101 0.2% 70.09 0.77 98.74 1.95
Russia (data) 0.05 1.9% 23 0.15 23 0.15
Model's predictions
1) Interrned. costs 0.26 1.9% 86.31 1.45 93.89 1.99
2) Enforcement 0.045 0.5% 51.16 0.32 96.51 1.90
3) Interrned. costs and enforcernent 0.045 1.9% 46.89 0.24 87.69 1.89
Singapore (data) 0.38 0.5% 68 1.15 68 1.15
Model's predictions
1) Intermed. costs 0.26 0.5% 100 2.02 100 2.02
2) Enforcernent 0.37 0.5% 114.27 3.08 101.06 2.05
7
Concluding remarks and policy implications
. \This paper developed a framework to study qualitatively and quantitatively the effects of two financiaI frictions, intermediation costs and financiaI contract enforcement, on three measures of development: output per capita, total credit and inequality. We used data on intermediation costs and enforcement to map observed cross country differences in financiaI frictions into our mo deI • economy. We found that:
• The two credit market frictions are fundamentally different. Intermediation costs are a form • of financial repression which drive a wedge between the effective interest rate on borrowing and lending, while strong enforcement improves entrepreneurs' access to externaI finance. Quantitatively, we show that when the interest rate is exogenous and intermediation costs increase by a factor of four, output per capita decreases by 15%. When enforcement decreases by a factor of four, output decreases by roughly 42%. Enforcement has a stronger effect on output per capita than intermediation costs.
• FinanciaI capital mobility matters. When the leveI of financiaI contract enforcement varies from the V.S. to the Brazilian leveI (a variation of less than 50% in the enforcement index), output decreases significantly and inequality increases, especially when the interest rate is exogenous. The general equilibrium factor price effect is quantitatively significant and is operative only when the interest rate is endogenous. This yields a positive policy prescription:
If the goal of a policy maker is to maximize steady-state macroeconomic effi.ciency, financiaI
market reforms should be accompanied by a falI in barriers to financial capital mobility.
• Vsing independent measures of intermediation costs and enforcement, we show that financiaI .. reforms can have a sizeable effect on output when the economy has few restrictions on • capital mobility. Our counterfactual exercises using rjJ de facto show that financiaI market
imperfections explain almost the whole difference in output per capita for some European countries (France, Italy and Greece), and a significant fraction for some Latin American countries (Brazil, Mexico and Argentina) and transition economies (Russia and Poland).
We conclude by discussing three reIated strands of Iiterature. As noted at the outset, our paper is reIated to the Iiterature on occupational choice and the dynamics of economic deveIopment and inequality (e.g., Aghion and Bolton (1997), Banerjee and Newman (1993), Lloyd-Ellis and Bernhardt (2000), and Lucas (1978)). We differ from this Iiterature because our goal is not to study analytically the path of economic development, occupational choice or inequality; we investigate quantitatively how financiaI frictions affect these variabIes in the long run. The second Iiterature seeks to explain why some countries are much richer than others. Part of this literature uses deveIopment accounting to investigate whether observed in come disparities across countries _ are explained by factar accumulation or total factor productivity (e.g., Hall and Jones (1999) and . Prescott (1998)). Another part uses a modified version of the neoclassical growth mo deI to study whether plausible differences in policy distortions and barriers to the use of better technologies • can account for differences in income per worker across countries (e.g., Acemoglu and Ventura