ACPD
9, 9457–9489, 2009SOA modeling
M. N. Chan et al.
Title Page
Abstract Introduction
Conclusions References
Tables Figures
◭ ◮
◭ ◮
Back Close
Full Screen / Esc
Printer-friendly Version
Interactive Discussion
Atmos. Chem. Phys. Discuss., 9, 9457–9489, 2009 www.atmos-chem-phys-discuss.net/9/9457/2009/ © Author(s) 2009. This work is distributed under the Creative Commons Attribution 3.0 License.
Atmospheric Chemistry and Physics Discussions
This discussion paper is/has been under review for the journalAtmospheric Chemistry
and Physics (ACP). Please refer to the corresponding final paper inACPif available.
Modeling of secondary organic aerosol
yields from laboratory chamber data
M. N. Chan1, A. W. H. Chan2, P. S. Chhabra2, J. D. Surratt2, and J. H. Seinfeld1,2
1
Division of Engineering and Applied Science, California Institute of Technology, Pasadena, CA, USA
2
Division of Chemistry and Chemical Engineering, California Institute of Technology, Pasadena, CA, USA
Received: 19 March 2009 – Accepted: 24 March 2009 – Published: 9 April 2009
Correspondence to: J. H. Seinfeld ([email protected])
ACPD
9, 9457–9489, 2009SOA modeling
M. N. Chan et al.
Title Page
Abstract Introduction
Conclusions References
Tables Figures
◭ ◮
◭ ◮
Back Close
Full Screen / Esc
Printer-friendly Version
Interactive Discussion Abstract
A product-specific model for secondary organic aerosol (SOA) formation and compo-sition based on equilibrium gas-particle partitioning is evaluated. The model is applied
to represent laboratory data on the ozonolysis ofα-pinene under dry, dark, and
low-NOx conditions in the presence of ammonium sulfate seed aerosol. Using five major
5
identified products, the model is fit to the chamber data. From the optimal fitting, SOA oxygen-to-carbon (O/C) and hydrogen-to-carbon (H/C) ratios are modeled. The dis-crepancy between measured H/C ratios and those based on the oxidation products used in the model fitting suggests the potential importance of particle-phase reactions. Data fitting is also carried out using the volatility basis set, wherein oxidation products 10
are parsed into volatility bins. The product-specific model is best used for an SOA precursor for which a substantial fraction of the aerosol-phase oxidation products has been identified.
1 Introduction
Laboratory chamber data are needed to determine secondary organic aerosol (SOA) 15
yields from volatile organic compounds (VOCs). The fundamental concept on which all descriptions of SOA formation lies is that SOA comprises a mixture of semivolatile organic compounds that partition between the gas and particle phases (Pankow, 1994a,b; Odum et al., 1996). Gas-particle partitioning of each compound is described
by an equilibrium partitioning coefficient,Kp,
20
Kp= P
GM ∼
1
c∗ , (1)
whereG is the mass concentration per unit volume of air (µg m−3) of the semivolatile
species in the gas phase,P is the mass concentration per unit volume of air (µg m−3) of
ACPD
9, 9457–9489, 2009SOA modeling
M. N. Chan et al.
Title Page
Abstract Introduction
Conclusions References
Tables Figures
◭ ◮
◭ ◮
Back Close
Full Screen / Esc
Printer-friendly Version
Interactive Discussion
volume of air (µg m−3) of the total absorbing particle phase. The equilibrium partitioning
coefficient,Kp(m3µg−1), is inversely proportional to the saturation vapor concentration,
c∗
(µg m−3), of the pure semivolatile compound (see Appendix A).M refers only to the
portion of the particulate matter participating in absorptive partitioning (organic aerosol into which semivolatile organics can partition and the aqueous portion of the particles 5
in the case of water-soluble organics). Note that as long as some absorbing mass is present, some fraction of a given semivolatile compound partitions into the particle phase, even if its gas-phase concentration is below its saturation vapor concentration,
c∗
.
Oxidation of a parent VOC leads to a variety of semivolatile products, each with 10
its own saturation vapor concentration. Moreover, the semivolatile oxidation products may be formed from first- or higher generation gas-phase reactions, and the products themselves may react further in the gas phase to yield compounds of either lower (in the case of addition of more functional groups) or greater (in the case in which the carbon backbone of the molecule is cleaved) volatility.
15
The fractionF of a semivolatile compound in the particle phase can be expressed in
term ofKporc∗
as
F = P
G+P =
MKp
1+MKp =
1
1+c∗/M . (2)
As the amount of absorbing material (M) increases, compounds of greater volatility
(largerc∗
, smallerKp) will partition increasingly into the particle phase. Whenc∗
=M,
20
half of the semivolatile mass resides in the particle phase. IfM≫c∗, essentially all of
the semivolatile species is in the particle phase.
In the first basic model of SOA formation, Odum et al. (1996) represented the
pro-cess of SOA formation byn semivolatile products and showed that the SOA yield Y,
ACPD
9, 9457–9489, 2009SOA modeling
M. N. Chan et al.
Title Page
Abstract Introduction
Conclusions References
Tables Figures
◭ ◮
◭ ◮
Back Close
Full Screen / Esc
Printer-friendly Version
Interactive Discussion
pressed as
Y =MX
i
αiKp,i
1+MKp,i , (3)
whereαi is the mass-based stoichiometric coefficient for producti (mass ofi produced
per mass of parent VOC reacted). Note that Y can exceed 1.0 as a result of the
increase of molecular mass of oxidation products. (The designation “aerosol mass 5
fraction” is also used forY.) Equation (3) is an equilibrium model in that it relates the
amount of each product formed to the amount of VOC reacted regardless of whether the processes occurs in a single or multiple chemical steps in the gas phase. While, in
principle,ncan be as large as desired, in the application of the Odum model is usually
n=2. The two products are not necessarily associated with actual products, and the
10
4 parameters,α1, α2, Kp,1, andKp,2, are estimated by optimal fitting of Eq. (3) to the
data.
SOA forms when gas-phase oxidation products of a hydrocarbon precursor partition between the gas and particle phases. Products with lower vapor pressures partition preferentially to the particle phase; compounds that are more highly oxygenated tend 15
to have lower vapor pressures. The degree of partitioning to the particle phase de-pends also on the quantity of absorbing organic material in that phase into which the compounds can condense; as the mass of absorbing material increases, compounds of higher vapor pressure that tend not to partition to the particle phase under low mass loadings do so at the higher mass loadings. The result is that SOA at low mass load-20
ing tends to be enriched in the least volatile (and most oxygenated) products (Bahreini et al., 2005; Shilling et al., 2008). In typical chamber experiments, a range of initial hydrocarbon precursor concentrations is employed in order to determine SOA yields as a function of the mass concentration of organic particles generated. When chamber experiments are conducted over a range of initial VOC concentrations, such experi-25
ments afford a view of the full spectrum of oxidation products, thereby facilitating the
ACPD
9, 9457–9489, 2009SOA modeling
M. N. Chan et al.
Title Page
Abstract Introduction
Conclusions References
Tables Figures
◭ ◮
◭ ◮
Back Close
Full Screen / Esc
Printer-friendly Version
Interactive Discussion
Laboratory chamber studies are limited in duration to about 12 h or so, as constrained by particle deposition on the chamber walls, whereas the typical atmospheric lifetime of a particle is the order of a week. Chamber studies capture the initial multi-hour VOC oxidation but not that which takes place on a multi-day time scale. The sequence of reactions and associated SOA formation that occur over the duration of a chamber 5
experiment can be termed as thechamber phase. (Stanier et al., 2008, have referred
to this as the “prompt” phase.) The chamber or prompt phase chemistry begins with
oxidant (OH, O3, NO3) attack on the VOC, initiating a series of reactions, which can
de-pend critically on NOx level, leading to semivolatile products. Experimentally-derived
SOA yields reflect the extent of SOA formation over the chamber phase. Reactions 10
that occur on a time scale longer than a chamber experiment can be termed theaging
phase, during which the following processes may occur: (1) particle-phase accretion reactions that convert semivolatile condensed products to essentially non-volatile com-pounds; (2) gas-phase oxidation reactions of chamber phase semivolatile products that are too slow to be important during the chamber phase but are capable of producing 15
compounds of even lower volatility over the aging phase; and (3) gas-particle reactions that convert some particulate material to volatile products. Over the typical time scale and spatial grid scale of atmospheric models, SOA formation occurring on the cham-ber phase time scale can be considered as taking place essentially instantaneously, suggesting that an equilibrium partitioning model for this phase is appropriate. Over 20
the longer aging time scale, the equilibrium partitioning can be considered to be slowly perturbed as chemical aging takes place.
2 Form of SOA model
If a number of products accounting for a significant fraction of the total mass of SOA have been identified, these major products can serve as SOA surrogates in a product-25
specific model. In the product-specific model (Pankow et al., 2001; Seinfeld et al.,
ACPD
9, 9457–9489, 2009SOA modeling
M. N. Chan et al.
Title Page
Abstract Introduction
Conclusions References
Tables Figures
◭ ◮
◭ ◮
Back Close
Full Screen / Esc
Printer-friendly Version
Interactive Discussion
can be determined. One must keep in mind the fact that vapor pressure estimation methods for highly oxygenated SOA compounds may involve considerable uncertainty.
An alternative approach is the volatility basis set, in which a range of products is
specified in terms of volatility bins (Donahue et al., 2006; Stanier et al., 2008). The product volatilities can be segmented into order-of-magnitude volatility bins (expressed 5
as values ofc∗
). Since SOA products are grouped into volatility bins, information about the chemical composition of SOA is not required.
For the volatility basis set, Stanier et al. (2008) present a methodology for selecting
the maximum and minimum values ofc∗
, and logarithmic spacing betweenc∗
values then determines the number of volatility bins. For the product-specific model, major 10
identified particle-phase products are chosen as SOA surrogates to represent other chemically similar compounds, and to give a reasonable approximation of gas/particle partitioning of all other products (Pankow et al., 2001). The product-specific model allows the composition of SOA to be predicted. The simulated SOA composition may allow a first approximation of the properties of SOA (e.g., water uptake and cloud con-15
densation nuclei activity).
Here, we revise the product-specific model proposed by Pankow et al. (2001) in which the SOA yield and composition can be modeled by using absorptive gas/particle partitioning of major SOA products. The SOA composition changes with organic mass loading and the amount of hydrocarbon precursors reacted can be tracked. Using the 20
simulated SOA composition, we also calculate the aerosol oxygen-to-carbon (O/C) and
hydrogen-to-carbon (H/C) ratios at different loadings. Simulated ratios for O/C and H/C
can be compared with those measured. As an illustration of this approach, we examine
the ozonolysis ofα-pinene under dry, dark, and low-NOxconditions in the presence of
dry (NH4)2SO4particles.
ACPD
9, 9457–9489, 2009SOA modeling
M. N. Chan et al.
Title Page
Abstract Introduction
Conclusions References
Tables Figures
◭ ◮
◭ ◮
Back Close
Full Screen / Esc
Printer-friendly Version
Interactive Discussion 3 Ozonolysis ofα-pinene
Ozonolysis ofα-pinene is, in many respects, an excellent test case for an SOA model.
A number of experimental studies exist in the literature, and relatively complete prod-uct identification has been carried out. Oxocarboxylic acids, hydroxy oxocarboxylic acids, dicarboxylic acids, oxoaldehydes, and organic peroxides are the major classes 5
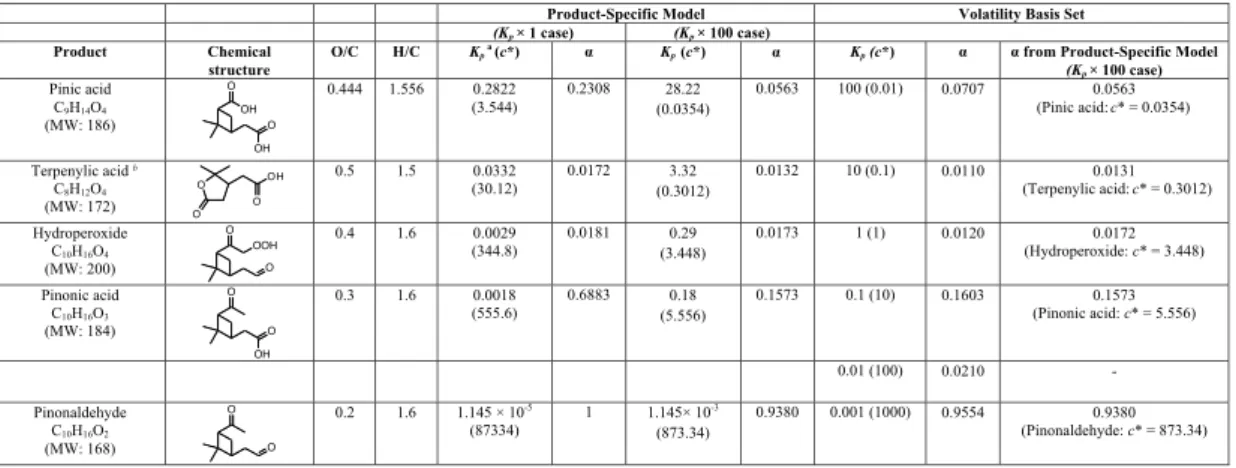
of SOA products identified (Yu et al., 1999; Docherty et al., 2005). We assume for the product-specific model that there are five major products: pinonic acid, pinic acid, pinonaldehyde, a hydroperoxide, and terpenylic acid (Table 1). These compounds are chosen to reflect the latest understanding of the gas-phase products formed in the
ozonolysis ofα-pinene.
10
Gas-particle partitioning of compounds are determined by their vapor pressures.
Here, the vapor pressure of a product i is estimated by using a group contribution
method developed by Pankow and Asher (2008). At a given temperature, theKp,i of
the producti is determined by assuming that its activity coefficient,ζi, is unity and the
molecular weight of producti is taken as the mean molecular weight of the surrogate
15
mixture, MW, as a first approximation. These assumptions may be reasonable as the
range of molecular weights of products is small (168–200 g mol−1, see Table 1) and the
amount of water present in the particle phase is not significant under dry conditions
(<5%–40% RH). Bilde and Pandis (2001) measured the vapor pressure of semivolatile
products formed from oxidation of biogenic monoterpenes using a laminar flow reactor 20
with uncertainty of±50%. They reported a vapor pressure of 1.989×10⁻¹⁰atm for pinic
acid of at 293 K, which is comparable to our estimated value (4.605×10⁻¹⁰atm) using
the Pankow and Asher (2008) model. At a given temperature, our estimated vapor pressures of major products are lower than those estimated by Jenkin (2004). Hence,
our estimatedKp values of major products are larger than those reported by Jenkin
25
(2004). It is noted that Jenkin (2004) estimated a higher vapor pressure of pinic acid
of 4.7×10⁻⁴torr (or 6.18×10⁻⁷atm) at 298 K compared to that reported by Bilde and
ACPD
9, 9457–9489, 2009SOA modeling
M. N. Chan et al.
Title Page
Abstract Introduction
Conclusions References
Tables Figures
◭ ◮
◭ ◮
Back Close
Full Screen / Esc
Printer-friendly Version
Interactive Discussion
Some of the products are estimated to have very similarKp values at a given
tem-perature. For example, at 293 K, the estimated value of Kp of hydroxy pinonic acid
(Kp=0.2802) is very close to that of pinic acid (Kp=0.2822). The estimated Kp of
pinonic acid (Kp=0.0017) is close to that of hydroxy pinonaldehyde (Kp=0.0018). As
a result, any optimization will not be able to differentiate between these products. In
5
these cases, a single product is chosen to represent the two classes of products. By
considering the similarity of theKpvalues and the relative abundance of these species,
pinonic acid is chosen to represent the pinonic acid, norpinonic acid, hydroxy pinon-aldehyde, and isomers. Pinic acid is chosen to represent pinic acid, norpinonic acid, hydroxy pinonic acid, and isomers.
10
In practical terms, the constraints imposed by chamber data are reflected in the op-timal fitting of parameters in any model to chamber data. The basic chamber data are considered to be in the form of particle mass concentration as a function of VOC reacted. The actual chamber data are in the form of aerosol volume concentration. Aerosol density needed to convert volume to mass concentration is estimated by com-15
paring the aerosol number distribution measured by a differential mobility analyzer with
that obtained from the Aerodyne Aerosol Mass Spectrometer (AMS), through the theo-retical relationship between mobility diameter and vacuum aerodynamic diameter. Ng et al. (2006) have shown that for the oxidation of a number of hydrocarbons with a sin-gle double bond, the growth curve for one experiment over the course of the experiment 20
(“time dependent growth curve”) follows that of final SOA growth over different
experi-ments. This suggests that in this case the time-dependent SOA growth data can also be used for model data fitting.
Data from ozonolysis of α-pinene are obtained from experiments conducted under
dry, dark, and low-NOxconditions in the presence of dry (NH4)2SO4particles (Ng et al.,
25
2006; Pathak et al., 2007; Shilling et al., 2008). The SOA yield data cover a range of
organic mass loading (0.5–411 µg m−3) and are used for the parameterization to model
the SOA yield relevant to atmospheric conditions (Presto and Donahue, 2006). An
con-ACPD
9, 9457–9489, 2009SOA modeling
M. N. Chan et al.
Title Page
Abstract Introduction
Conclusions References
Tables Figures
◭ ◮
◭ ◮
Back Close
Full Screen / Esc
Printer-friendly Version
Interactive Discussion
centration in determination of SOA yield. It is noted that Shilling et al. (2009) reported
a higher effective SOA density (1.73–1.4 g cm−3) at low organic mass loading (0.5–
7 µg m−3). The SOA yield data from Shilling et al. (2008) are adjusted to 293 K, using
a temperature correction factor suggested by Pathak et al. (2007). Generally, the time-dependent SOA yield data reported by Ng et al. (2006) are in good agreement with the 5
final SOA yield data reported by Pathak et al. (2007) and Shilling et al. (2008) but are lower than those reported by Shilling et al. (2008) for organic mass loadings less than
2 µg m−3. Measurement uncertainties may explain part of the variability in SOA yield
data reported by Ng et al. (2006) at low organic mass loading.
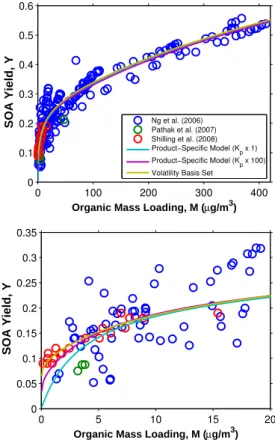
Data, plotted as SOA yield,Y versus organic mass loading,M, are shown in Fig. 1.
10
The SOA yield increases rapidly at low organic mass loading and more slowly at high organic mass loading. Since any vapor pressure estimation method for SOA
com-pounds may have considerable uncertainty, the estimated value ofKp,i of a producti
may have a correspondingly large uncertainty. The value ofKp,i of all products is
mul-tiplied by a factor of 100 to examine the effect of uncertainty in determination ofKp,i
15
(termed theKp×100 case). Previous modeling studies have shown that an overall
in-crease of Kp of all products of a factor on the order of 102 is needed to explain the
partitioning (Jenkin, 2004; Chen and Griffin, 2005). Theαi of the product i is then
ob-tained by optimal fitting to the experimental SOA yield data in bothKp×1 andK
p×100
cases. The predicted SOA yields agree well with the experimental SOA yield data in 20
bothKp×1 andK
p×100 cases. TheKp×100 case gives a better estimate of SOA yields
at low organic mass loading than theKp×1 case. However, the optimized curves
under-predict the SOA yield data reported by Shilling et al. (2008) when organic mass loading
is less than∼2 µg m−3. One possible explanation is the uncertainty in the estimation
of theKpof major products (vapor pressure and activity coefficient). Another possible
25
explanation is that products (gas-phase and/or particle-phase) of higherKp(and lower
ACPD
9, 9457–9489, 2009SOA modeling
M. N. Chan et al.
Title Page
Abstract Introduction
Conclusions References
Tables Figures
◭ ◮
◭ ◮
Back Close
Full Screen / Esc
Printer-friendly Version
Interactive Discussion
lower volatilities (Gao et al., 2004; Iinuma et al., 2004; M ¨uller et al., 2008), therefore
enhancing theKp of gas-phase reaction products (Kroll and Seinfeld, 2005). Table 1
lists the parameters used to describe the experimental SOA yields. It is acknowledged
that the mass yield of pinonaldehyde is close to unity in bothKp×1 andKp×100 cases.
For theKp×1 case, the sum of fitted molar yields exceeds 1.
5
The volatility basis set is also applied to fit the experimental SOA yields. The
esti-mated volatility (orc∗
) of products spans from 0.035 to 873 µg m−3. A volatility basis
set of six volatility bins is chosen and the volatility bins are separated by an
order-of-magnitude (c∗
: 0.01, 0.1, 1, 10, 100, and 1000 µg m−3). The mass of aerosol in bini
is obtained by optimal fitting to the experimental SOA yield data. Figure 1 shows that 10
for the volatility basis set, the predicted SOA yields agree well with the experimental
SOA yield data, even at low organic mass loading (<0.5 µg m−3). This suggests that
products with volatility as low asc∗
=0.01 µg m−3(orKp=100 µg−1m3) are present. The
quantity of aerosol in the volatility bini is in good agreement with that of the producti
with similarKporc∗
(Table 1) in theKp×100 case.
15
We also investigate temperature dependence of SOA yield using the product-specific
model (only theKp×100 case which gives a better description of SOA yields is shown).
The temperature-dependent vapor pressure of the products can be estimated using the group contribution method developed by Pankow and Asher (2008). At a given
temperature,Kp,i of the producti is also estimated by assuming that itsζi is unity and
20
the molecular weight of producti is taken as the mean molecular weight of the
absorb-ing phase. Theαi of the producti determined at 293 K is assumed to be temperature
independent over the temperature range studied (273–313 K). As shown in Fig. 2, the predicted SOA yield increases as the temperature decreases. Lower temperature tends to favor the partitioning of gas-phase reaction products into the particle phase, 25
ACPD
9, 9457–9489, 2009SOA modeling
M. N. Chan et al.
Title Page
Abstract Introduction
Conclusions References
Tables Figures
◭ ◮
◭ ◮
Back Close
Full Screen / Esc
Printer-friendly Version
Interactive Discussion
at 293 and 303 K. On the other hand, the predicted SOA yields are higher than those measured at 288 and 273 K but slightly lower than those measured at 313 K.
4 SOA composition
At a given temperature and organic mass loading,M the mass yield of the product i,
Yi can be determined as:
5
Yi =
Mi
∆HC =
MKp,i
1+MKp,iαi, (4)
where the mass-based stoichiometric coefficient of the product i,Yi, is obtained from
the parameterization of SOA yield data using the product-specific model (Table 1). Mi
is the concentration of producti in the particle phase (µg m−3). The SOA yield, Y, is
the sum of the mass yields of all products (SOA yield, Y=P
iYi, at a given organic
10
mass loading. The ratio of mass yield of producti to total yield (Yi/ Y) is the relative
contribution of the producti to the total SOA yield (or total SOA mass).)
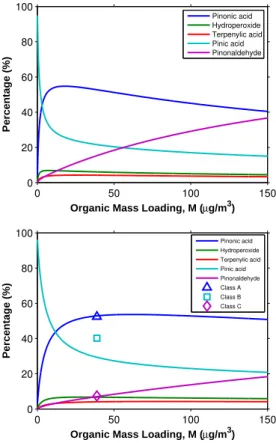
Figures 3 and 4 show the predicted relative contributions of the products to the SOA
yield at different organic mass loading for the Kp×1 and K
p×100 cases, respectively.
The predicted SOA composition is compared to the measured concentration of the 15
corresponding classes of compounds in chamber experiments. Yu et al. (1999)
re-ported the product distribution of ozonolysis ofα-pinene at 306 K and organic mass
loading of 38.8 µg m−3: hydroxy pinonic acid (17.7%), pinic acid and norpinic acid
(22.5%), pinonic acid and norpinonic acid, and isomers (36.5%), hydroxy pinonalde-hyde (15.9%), and pinonaldepinonalde-hyde and norpinonaldepinonalde-hyde (7.4%). It is noted that or-20
ganic peroxides, particle-phase reaction products (e.g., oligomers and esters), and ter-penylic acid were not reported in Yu et al. (1999). Docherty et al. (2005) estimated that
organic peroxides contribute∼47% of the SOA mass at high organic mass loading.
The concentration of terpenylic acid in chamber SOA has not been reported
previ-ously by Claeys et al. (2009). A smaller effective density of 1 g cm−3
ACPD
9, 9457–9489, 2009SOA modeling
M. N. Chan et al.
Title Page
Abstract Introduction
Conclusions References
Tables Figures
◭ ◮
◭ ◮
Back Close
Full Screen / Esc
Printer-friendly Version
Interactive Discussion
the SOA mass in Yu et al. (1999). This will increase the reported percentage of prod-ucts. In addition, the relative abundance of products reported by Yu et al. (1999) may be overestimated if the organic peroxides, terpenylic acid, or other unidentified products contribute significantly to the SOA mass at the given organic mass loading.
As shown in the bottom panel of Fig. 3, for theKp×1 case, only pinic acid and pinonic
5
acid are predicted to contribute significantly to the SOA mass. Other major products are estimated to be too volatile to partition into the particle phase and thus contribute only a very small fraction of SOA mass. This also explains why high mass yields of these products are needed in order to fit the observed SOA yields. Generally, the simulated SOA composition does not match those measured. As shown in the bottom 10
panel of Fig. 4, for theKp×100 case, the predicted percentage of pinonic acid is about
51%, which is close to the sum of the percentages of pinonic acid and norpinonic acid and isomers and hydroxy pinonaldehyde (52.4%). The predicted percentage of pinonaldehyde is also close to that of pinonaldehyde and norpinonaldehyde (7.4%). On the other hand, the predicted percentage of pinic acid is about 28%, which is smaller 15
than the sum of the percentages of pinic acid and norpinic acid and hydroxy pinonic
acid (40.2%). For organic peroxides, using a hydroperoxide as surrogate gives∼7% of
SOA yield, which is lower than that reported by Docherty et al. (2005) at high organic mass loading. The percentage of terpenylic acid contributes about 5% of the SOA
yield. Overall, the Kp×100 case may give a good first estimate of the gas/particle
20
partitioning and composition of the SOA products at the given organic mass loading and temperature.
5 O/C and H/C ratios
The chemical composition of SOA formed from ozonolysis ofα-pinene has been
re-cently characterized by an Aerodyne high-resolution time-of-flight aerosol mass spec-25
trometer (HR-ToF-AMS) at 298 K (Shilling et al., 2009). This characterization provides
ACPD
9, 9457–9489, 2009SOA modeling
M. N. Chan et al.
Title Page
Abstract Introduction
Conclusions References
Tables Figures
◭ ◮
◭ ◮
Back Close
Full Screen / Esc
Printer-friendly Version
Interactive Discussion
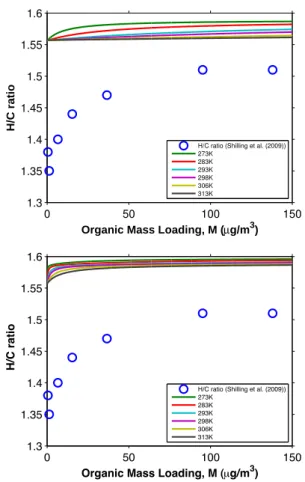
provide additional information about the SOA composition and impose important con-straints on the SOA parameterization. As shown in Figs. 5 and 6, the data show that the O/C ratio decreases as the organic mass loading increases, while the H/C ratio increases (Shilling et al., 2009). This observation indicates, as expected, that the SOA is more oxygenated at low organic mass loading than at high organic mass loading. 5
O/C and H/C ratios of the SOA can also be determined from the predicted SOA
composition. At a given organic mass loading, the number of moles of producti,mi
can be calculated from its particle-phase mass concentration and molecular weight.
The number of carbon atoms,nC,i, (O/C)i and (H/C)i ratios of the producti are known
(Table 1). The O/C and H/C ratios of the SOA can be determined as follows: 10
O/C=
P
imi · nc,i ·(O/C)i
P
imi·nc,i
, (5)
H/C=
P
imi · nc,i ·(H/C)i
P
imi ·nc,i
. (6)
At 298 K, for theKp×1 case (Fig. 5, top panel), the modeled O/C ratios decrease from
∼0.44 to∼0.36 as the organic mass loading increases from 0.5 µg m−3to 150 µg m−3.
The predicted O/C ratios are higher than those in Shilling et al. (2009), except at low 15
organic mass loading (<1 µg m−3). The predicted ratios decrease less rapidly as the
organic mass loading increases. For theKp×100 case (Fig. 5, bottom panel), the
pre-dicted O/C ratios agree quite well with those measured; prepre-dicted O/C ratios decrease from 0.43 to 0.30 as the organic mass loading increases. On the other hand, in both
Kp×1 and Kp×100 cases, the predicted H/C ratios exceed those measured at these
20
loadings (Fig. 6).
The O/C ratios of selected major products range from 0.2 to 0.5, which cover the range of the experimental O/C ratios. On the other hand, the H/C ratios of the selected major products range from 1.5 to 1.6, which exceed the reported H/C ratios (1.38– 1.51). Using the experimentally identified gas-phase reaction products, the predicted 25
ACPD
9, 9457–9489, 2009SOA modeling
M. N. Chan et al.
Title Page
Abstract Introduction
Conclusions References
Tables Figures
◭ ◮
◭ ◮
Back Close
Full Screen / Esc
Printer-friendly Version
Interactive Discussion
ratios of the major SOA products identified in the literature range from 1.5 to 1.6. In addition to uncertainties in determination of the O/C and H/C ratios, the formation of
oligomers or organic peroxides will shift the H/C ratio without greatly affecting the O/C
ratio (Shilling et al., 2009). Formation of esters can alter the H/C and O/C ratios (M ¨uller et al., 2008). The discrepancy in the H/C ratios based on known gas-phase products 5
and those measured stresses the potential importance of particle-phase reactions on
the determination of SOA yield and composition in the ozonolysis ofα-pinene under
dry, dark, and low-NOxconditions.
Figures 5 and 6 also show the temperature dependence of the H/C and O/C ratios
in the temperature range (273–313 K). For the bothKp×1 andK
p×100 cases (Fig. 5),
10
the modeled O/C ratio increases when the temperature increases. On the other hand, the modeled H/C ratio decreases when the temperature increases (Fig. 6). At a higher temperature, the less volatile gas-phase products which are usually more oxygenated (i.e., usually a higher O/C ratio and a lower H/C ratio) partition preferentially into the
particle phase. As shown in Fig. 4 (Kp×100 case), the contribution of pinic acid, which
15
is the least volatile product and is more oxygenated, increases when the temperature increases from 293 to 306 K. On the other hand, the relative abundance of pinon-aldehyde, which is the most volatile product and is the least oxygenated, decreases
with increasing temperature. The effect of particle-phase reactions on O/C and H/C
ratios at different temperatures is not considered. For the volatility basis set, since
20
information about the chemical composition of volatility bins is not required, O/C and H/C ratios cannot be directly determined from the quantity of aerosol in the bins. With a priori knowledge of the SOA composition, the O/C and H/C ratios of the bins can be obtained from the optimal fitting to the measured O/C and H/C ratios (Shilling et al., 2009).
25
We conducted an α-pinene ozonolysis experiment under dry, dark, and low-NOx
conditions in the presence of dry (NH4)2SO4 particles to generate a data set
ACPD
9, 9457–9489, 2009SOA modeling
M. N. Chan et al.
Title Page
Abstract Introduction
Conclusions References
Tables Figures
◭ ◮
◭ ◮
Back Close
Full Screen / Esc
Printer-friendly Version
Interactive Discussion
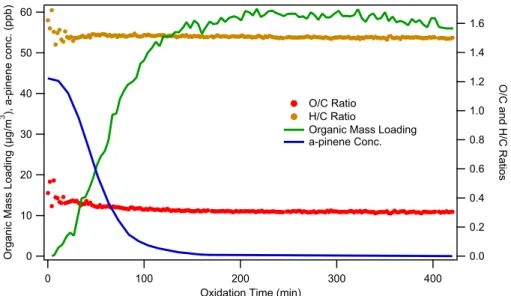
are given in Appendix B. Figure 7 shows the time evolution ofα-pinene concentration,
organic mass loading, and aerosol O/C and H/C ratios. Once the ozone is injected,
α-pinene oxidation commences, and the organic mass loading increases almost
imme-diately. Whenα-pinene is completely reacted, organic aerosol mass loading remains
unchanged. These observations are consistent with those reported by Ng et al. (2006). 5
Measured O/C and H/C ratios as a function of organic mass loading are shown in Fig. 8. The data scatter reflects the inherent uncertainty in measurement of O/C and H/C ratios at low organic mass loading. Generally, the H/C ratio increases as time increases, while the O/C ratio decreases. The trends in O/C and H/C ratios are in good agreement with those reported by Shilling et al. (2009). The absolute values of the O/C 10
ratios are slightly lower than those reported by Shilling et al. (2009), but well within the
experimental uncertainty. When all α-pinene is consumed and the SOA growth has
leveled out (∼58 µg m−3), O/C and H/C ratios and fragment mass spectrum (not shown
here) remain unchanged. As discussed by Ng et al. (2006), the first oxidation step in
the ozonolysis of α-pinene (a hydrocarbon with a single double bond) is most likely
15
the rate-determining step in SOA formation. Either the condensable products are the initial reaction products of the parent hydrocarbon oxidation (first-or higher generation products), or subsequent reactions (in either the gas or particle phase) proceed at relatively fast rates. Thus, the instantaneous product spectrum can be considered as that at equilibrium during the chamber phase.
20
Recently, Dzepina et al. (2009) suggest that the O/C ratio and volatility can be used to compare modeled and measured SOA. The authors calculate O/C ratios using various models and compare these to the measured O/C ratios of ambient Mexico City aerosol.
They find that O/C ratios predicted by different models do not agree and are generally
lower than the measured ratios. 25
ACPD
9, 9457–9489, 2009SOA modeling
M. N. Chan et al.
Title Page
Abstract Introduction
Conclusions References
Tables Figures
◭ ◮
◭ ◮
Back Close
Full Screen / Esc
Printer-friendly Version
Interactive Discussion
determinations can be made using the AMS. These element-to-carbon ratios can also be calculated using detailed gas-chemistry models coupled with gas/particle partition-ing theory and can be used as additional constraints on the SOA parameterization in chamber experiments and modeling studies.
6 Discussion
5
Clear evidence exists that organic compounds may undergo chemical reactions in the particle phase, changing the concentration and/or volatility of the compounds (Kroll and Seinfeld, 2008, and references therein). Particle-phase reaction products can con-tribute a significant fraction of the total SOA mass, suggesting that processes governing the amount of SOA formed may be more complex than the direct formation and conden-10
sation of semivolatile organic compounds. Kroll and Seinfeld (2005) have introduced
effective partitioning coefficients, which account for both absorption and particle-phase
reaction to represent the enhancement in the partitioning of semivolatile products into the particle-phase. Heterogeneous and particle-phase reactions have been considered in some SOA models (Hallquist et al., 2009, and references therein). Major challenges 15
exist in the development of explicit SOA models coupling both detailed gas-phase and particle-phase reactions.
The equilibrium partitioning model can be used to describe the gas-particle parti-tioning of the SOA products, including particle-phase reaction products. The traditional
absorptive partitioning model treats the αi as the total product yield of each product
20
formed from single or multiple generations of reaction in the gas-phase. In the
pres-ence of particle-phase reactions, the definition of α can be expanded to refer to the
overall product yield from the entire reaction mechanism. In this case, major particle-phase reaction products can also be chosen as SOA surrogates in the product-specific
model. The vapor pressures and gas-particle partition coefficients of particle-phase
25
reaction products can likewise be estimated. The αi values for the SOA surrogates
ACPD
9, 9457–9489, 2009SOA modeling
M. N. Chan et al.
Title Page
Abstract Introduction
Conclusions References
Tables Figures
◭ ◮
◭ ◮
Back Close
Full Screen / Esc
Printer-friendly Version
Interactive Discussion
This simple treatment has the potential to reproduce the measured concentrations of major reaction products (both gas-phase and particle-phase) even in the absence of details of major particle-phase reactions. On the other hand, if an equilibrium state is not attained during the chamber phase, the kinetics of gas-phase and particle-phase reactions determine the SOA composition. In such cases, development of kinetic mod-5
els in which reaction products undergo reactions in both gas-phase and particle-phase is needed to describe the SOA formation (Chan et al., 2007).
To determine the extent to which an equilibrium state is achieved, the chemical com-position of SOA can be measured by the Aerodyne HR-ToF-AMS over the course of the chamber experiments. The change in element-to-carbon ratios (e.g. O/C, H/C ratios) 10
can provide insight about the change in SOA composition. If the ratios or the mass spectra do not vary with time, this may suggest that an equilibrium state is achieved within the timescale of the chamber experiment. In that case, major experimentally identified products (both particle-phase and gas-phase reaction products) can be cho-sen as SOA surrogates in the product-specific model. In addition, the O/C, H/C, N/C, 15
or S/C ratios can be calculated from the detailed gas-chemistry model coupled with gas/particle partitioning theory.
Appendix A
The gas-particle partitioning coefficient
20
The gas-particle partitioning coefficient for compoundi to a condensed phase ofi only
is given by (Pankow, 1994a,b)
Kp,i =
RT
106MW
ipoL,i
, (A1)
whereR=8.2×10⁻⁵m3atm mol−1K−1, MW
i=molecular weight ofi (g mol
−1
) and poL,i
is the vapor pressure of pure i as a liquid (atm). When multiple condensed-phase
ACPD
9, 9457–9489, 2009SOA modeling
M. N. Chan et al.
Title Page Abstract Introduction Conclusions References Tables Figures ◭ ◮ ◭ ◮ Back Close
Full Screen / Esc
Printer-friendly Version
Interactive Discussion
compounds exists
Kp,i =
RT f
106MWζ
ipoL,i
, (A2)
wheref=weight fraction of the total particulate matter that is the absorbing phase, MW
is the mean molecular weight of the absorbing organic phase (g mol−1), andζi=
mole-fraction based activity coefficient.Kp,i varies as a function ofT, through both its explicit
5
dependence on T as well as the strong dependence poL,i of on T. The value of Kp,i
is also influenced byζi and MW owing to the types and amounts of condensed-phase
compounds.
The vapor pressure of each component obeys the Clausius-Clapeyron equation,
poL,i(T)=poL,iexp
−∆Hv, i R 1 T − 1 To . (A3) 10
For a set of compounds at a givenT,poL,i tends to decrease with increasing∆Hv,i.
The variation of gas-partitioning coefficient with temperature results from variation of
poL,i as well as the explicit dependence onT,
Kp,i(T)
Kp,i(To)
=
T
To
po
L,i(To)
poL,i(T) =
T To exp −∆ Hv,i R 1 T − 1 To . (A4)
Following Pankow and Chang (2008), one may choose∆Hv=100 kJ mol
−1
as a “ref-15
erence”∆Hv,i value of, so that any∆Hv,i can be written as a multiple of the reference
value,∆Hv,i=ai×100 kJ mol
−1
. ForTo=293 K, for,a=1, a 10 K decrease inT leads to
Kp,i(283)
Kp,i(293)
= 283 293 exp −100 R 1 283 − 1 293
ACPD
9, 9457–9489, 2009SOA modeling
M. N. Chan et al.
Title Page
Abstract Introduction
Conclusions References
Tables Figures
◭ ◮
◭ ◮
Back Close
Full Screen / Esc
Printer-friendly Version
Interactive Discussion
Thus, for a compound with∆Hv=100 kJ mol−1, a 10 K decrease in temperature leads
to a factor of 4 increase inKp,i. For a compound withai=0.5, the increase ofKp,i for
a 10 K decrease inT is∼a factor of 2. Note that the factor (T/T
o) exerts only a minor
effect compared to that from the temperature dependence ofpoL,i.
Appendix B
5
Measurement of O/C and H/C ratios of SOA fromα-pinene ozonolysis
To provide an additional set of data on the O/C ratio of SOA generated fromα-pinene
ozonolysis, an experiment was performed in one of the dual Caltech 28-m3 Teflon
10
chambers. Details of the facility have been described elsewhere (Cocker et al., 2001; Keywood et al., 2004). Before the experiment, the chamber was flushed continuously with dry, purified air for at least 24 h. Aerosol number concentration, size distribution,
and volume concentrations were measured by a differential mobility analyzer (DMA,
TSI model 3081) coupled with a condensation nucleus counter (TSI model 3760). Am-15
monium sulfate seed particles were generated by atomizing an aqueous solution of
0.015 M (NH4)2SO4 with a constant-rate atomizer. The volume concentration of the
seed particles was 12 µm3cm−3.
The parent hydrocarbon, α-pinene, and an OH scavenger, cyclohexane, were then
introduced separately by injecting known volumes of the liquid hydrocarbon into a glass 20
bulb, subsequently carried into the chamber by an air stream at 5 L min−1. The mixing
ratio ofα-pinene was monitored with a gas chromatograph coupled with a flame
ioniza-tion detector (GC-FID, Agilent model 6890N). The initial mixing ratio ofα-pinene was
44 ppb. The estimated mixing ratio of cyclohexane was 37 ppm, which corresponds to
a rate of cyclohexane+OH 100 times faster than that ofα-pinene+OH.
25
ACPD
9, 9457–9489, 2009SOA modeling
M. N. Chan et al.
Title Page
Abstract Introduction
Conclusions References
Tables Figures
◭ ◮
◭ ◮
Back Close
Full Screen / Esc
Printer-friendly Version
Interactive Discussion
and monitored with a commercial ozone analyzer (Horiba Instruments, CA). Ozone injection was stopped after the ozone concentration reached 180 ppb. The aerosol growth data were corrected for wall deposition of particles. First-order size dependent
wall loss coefficents were determined from a separate seed-only experiment. The final
SOA volume was 46 µm3cm−3, as measured by the DMA.
5
Real-time particle mass spectra were collected continuously by an Aerodyne High Resolution Time-of-Flight Aerosol Mass Spectrometer (AMS). The HR-ToF-AMS is described in detail elsewhere (Canagaratna et al., 2007, and references therein). The HR-ToF-AMS switched once every minute between the high resolution W-mode and the lower resolution, higher sensitivity V-mode. The V-mode data were an-10
alyzed using a fragmentation table to separate sulfate, ammonium, and organic spectra and to time-trace specific mass-to-charge ratios. W-mode data were analyzed using a separate high-resolution spectra toolbox known as PIKA to determine the chemical formulas contributing to distinct mass-to-charge ratios (DeCarlo et al., 2006).
To determine elemental ratios, the computational toolbox Analytical Procedure for 15
Elemental Separation (APES) was used. This toolbox applies the analysis procedure described in Aiken et al. (2007) to the high-resolution W-mode data. The particle-phase
signal of CO+ and the organic contribution to HxO+ ions were estimated as described
in Aiken et al. (2008).
Acknowledgements. This work was supported by the Office of Science (BER), US Department
20
of Energy, Grant No. DE-FG02-05ER63983 and the US Environmental Protection Agency under STAR Agreement RD-833749. It has not been formally reviewed by the EPA. The views expressed in this document are solely those of the authors and the EPA does not endorse any products or commerical services mentioned in this publication.
References
25
ACPD
9, 9457–9489, 2009SOA modeling
M. N. Chan et al.
Title Page
Abstract Introduction
Conclusions References
Tables Figures
◭ ◮
◭ ◮
Back Close
Full Screen / Esc
Printer-friendly Version
Interactive Discussion
9476
Aiken, A. C., Decarlo, P. F., Kroll, J. H., Worsnop, D. R., Huffman, J. A., Docherty, K. S., Ulbrich, I. M., Mohr, C., Kimmel, J. R., Sueper, D., Sun, Y., Zhang, Q., Trimborn, A., Northway, M., Ziemann, P. J., Canagaratna, M. R., Onasch, T. B., Alfarra, M. R., Prevot, A. S. H., Dommen, J., Duplissy, J., Metzger, A., Baltensperger, U., and Jimenez, J. L.: O/C and OM/OC ratios of 5
primary, secondary, and ambient organic aerosols with high-resolution time-of-flight aerosol mass spectrometry, Environ. Sci. Technol., 42, 4478–4485, 2008. 9476
Bahreini, R., Keywood, M. D., Ng, N. L., Varutbangkul, V., Gao, S., Flagan, R. C., Seinfeld, J. H., Worsnop, D. R., and Jimenez, J. L.: Measurements of secondary organic aerosol from oxidation of cycloalkenes, terpenes, and m-xylene using an aerodyne aerosol mass 10
spectrometer, Environ. Sci. Technol., 39, 5674–5688, 2005. 9460
Bilde, M. and Pandis, S. N.: Evaporation rates and vapor pressures of individual aerosol species formed in the atmospheric oxidation of alpha- and beta-pinene, Environ. Sci. Tech-nol., 35, 3344–3349, 2001. 9463
Canagaratna, M. R., Jayne, J. T., Jimenez, J. L., Allan, J. D., Alfarra, M. R., Zhang, Q., Onasch, 15
T. B., Drewnick, F., Coe, H., Middlebrook, A., Delia, A., Williams, L. R., Trimborn, A. M., Northway, M. J., DeCarlo, P. F., Kolb, C. E., Davidovits, P., and Worsnop, D. R.: Chemi-cal and microphysiChemi-cal characterization of ambient aerosols with the aerodyne aerosol mass spectrometer, Mass. Spec. Rev., 26, 185–222, 2007. 9476
Chan, A. W. H., Kroll, J. H., Ng, N. L., and Seinfeld, J. H.: Kinetic modeling of secondary 20
organic aerosol formation: effects of particle- and gas-phase reactions of semivolatile prod-ucts, Atmos. Chem. Phys., 7, 4135–4147, 2007,
http://www.atmos-chem-phys.net/7/4135/2007/. 9473
Chen, J. J. and Griffin, R. J.: Modeling secondary organic aerosol formation from oxidation of alpha-pinene, beta-pinene, and d-limonene, Atmos. Environ., 39, 7731–7744, 2005. 9465 25
Claeys, M., Iinuma, Y., Szmigielski, R., Surratt, J. D., Blockhuys, F., Van Alsenoy, C., B ¨oge, O., Sierau, B., G ´omez-Gonz ´alez, Y., Vermeylen, R., Van der Veken, P., Shahgholi, M., Chan, A. W. H., Herrmann, H., Seinfeld, J. H., and Maenhaut, W.: Terpenylic acid and related com-pounds from the oxidation ofα-pinene: Implications for new particle formation and growth above forests, submitted, 2009. 9467, 9481
30
Cocker, D. R., Flagan, R. C., and Seinfeld, J. H.: State-of-the-art chamber facility for studying atmospheric aerosol chemistry, Environ. Sci. Technol., 35, 2594–2601, 2001. 9475
Go-ACPD
9, 9457–9489, 2009SOA modeling
M. N. Chan et al.
Title Page
Abstract Introduction
Conclusions References
Tables Figures
◭ ◮
◭ ◮
Back Close
Full Screen / Esc
Printer-friendly Version
Interactive Discussion
nin, M., Fuhrer, K., Horvath, T., Docherty, K. S., Worsnop, D. R., and Jimenez, J. L.: Field-deployable, high-resolution, time-of-flight aerosol mass spectrometer, Anal. Chem., 78, 8281–8289, 2006. 9476
Docherty, K. S., Wu, W., Lim, Y. B., and Ziemann, P. J.: Contributions of organic peroxides to secondary aerosol formed from reactions of monoterpenes with O3, Environ. Sci. Technol., 5
39, 4049–4059, 2005. 9463, 9467, 9468
Donahue, N. M., Robinson, A. L., Stanier, C. O., and Pandis, S. N.: Coupled partitioning, dilution, and chemical aging of semivolatile organics, Environ. Sci. Technol., 40, 2635–2643, 2006. 9462
Dzepina, K., Volkamer, R. M., Madronich, S., Tulet, P., Ulbrich, I. M., Zhang, Q., Cappa, C. D., 10
Ziemann, P. J., and Jimenez, J. L.: Evaluation of new secondary organic aerosol models for a case study in Mexico City, Atmos. Chem. Phys. Discuss., 9, 4417–4488, 2009,
http://www.atmos-chem-phys-discuss.net/9/4417/2009/. 9471
Gao, S., Keywood, M., Ng, N. L., Surratt, J., Varutbangkul, V., Bahreini, R., Flagan, R. C., and Seinfeld, J. H.: Low-molecular-weight and oligomeric components in secondary or-15
ganic aerosol from the ozonolysis of cycloalkenes and alpha-pinene, J. Phys. Chem. A., 108, 10147–10164, 2004. 9466
Hallquist, M., Wenger, J. C., Baltensperger, U., Rudich, Y., Simpson, D., Claeys, M., Dommen, J., Donahue, N. M., George, C., Goldstein, A. H., Hamilton, J. F., Herrmann, H., Hoffmann, T., Iinuma, Y., Jang, M., Jenkin, M., Jimenez, J. L., Kiendler-Scharr, A., Maenhaut, W., 20
McFiggans, G., Mentel, Th. F., Monod, A., Prvt, A. S. H., Seinfeld, J. H., Surratt, J. D., Szmigielski, R., and Wildt, J.: The formation, properties and impact of secondary organic aerosol: current and emerging issues, Atmos. Chem. Phys. Discuss., 9, 3555–3762, 2009, http://www.atmos-chem-phys-discuss.net/9/3555/2009/. 9472
Iinuma, Y., Boge, O., Gnauk, T., and Herrmann, H.: Aerosol-chamber study of the alpha-25
pinene/O-3 reaction: influence of particle acidity on aerosol yields and products, Atmos. Environ., 38, 761–773, 2004. 9466
Jenkin, M. E.: Modelling the formation and composition of secondary organic aerosol fromα -andβ-pinene ozonolysis using MCM v3, Atmos. Chem. Phys., 4, 1741–1757, 2004,
http://www.atmos-chem-phys.net/4/1741/2004/. 9463, 9465 30
ACPD
9, 9457–9489, 2009SOA modeling
M. N. Chan et al.
Title Page
Abstract Introduction
Conclusions References
Tables Figures
◭ ◮
◭ ◮
Back Close
Full Screen / Esc
Printer-friendly Version
Interactive Discussion
Kroll, J. H. and Seinfeld, J. H.: Representation of secondary organic aerosol laboratory cham-ber data for the interpretation of mechanisms of particle growth, Environ. Sci. Technol., 39, 4159–4165, 2005. 9466, 9472
Kroll, J. H. and Seinfeld, J. H.: Chemistry of secondary organic aerosol: Formation and evo-lution of low-volatility organics in the atmosphere, Atmos. Environ., 42, 3593–3624, 2008. 5
9472
M ¨uller, L., Reinnig, M. C., Warnke, J., and Hoffmann, T.: Unambiguous identification of esters as oligomers in secondary organic aerosol formed from cyclohexene and cyclohexene/α -pinene ozonolysis, Atmos. Chem. Phys., 8, 1423–1433, 2008,
http://www.atmos-chem-phys.net/8/1423/2008/. 9466, 9470 10
Ng, N. L., Kroll, J. H., Keywood, M. D., Bahreini, R., Varutbangkul, V., Flagan, R. C., Seinfeld, J. H., Lee, A., and Goldstein, A. H.: Contribution of first- versus second-generation products to secondary organic aerosols formed in the oxidation of biogenic hydrocarbons, Environ. Sci. Technol., 40, 2283–2297, 2006. 9464, 9465, 9471, 9482, 9483
Odum, J. R., Hoffmann, T., Bowman, F., Collins, D., Flagan, R. C., and Seinfeld, J. H.: 15
Gas/particle partitioning and secondary organic aerosol yields, Environ. Sci. Technol., 30, 2580–2585, 1996. 9458, 9459
Pankow, J. F.: An absorption-model of gas-particle partitioning of organic-compounds in the atmosphere, Atmos. Environ., 28, 185–188, 1994a. 9458, 9473
Pankow, J. F.: An absorption-model of the gas aerosol partitioning involved in the formation of 20
secondary organic aerosol, Atmos. Environ., 28, 189–193, 1994b. 9458, 9473
Pankow, J. F. and Asher, W. E.: SIMPOL.1: a simple group contribution method for predicting vapor pressures and enthalpies of vaporization of multifunctional organic compounds, At-mos. Chem. Phys., 8, 2773–2796, 2008,
http://www.atmos-chem-phys.net/8/2773/2008/. 9463, 9466, 9481 25
Pankow, J. F. and Chang, E. I.: Variation in the sensitivity of predicted levels of atmospheric organic particulate matter (OPM), Environ. Sci. Technol., 42, 7321–7329, 2008. 9474 Pankow, J. F., Seinfeld, J. H., Asher, W. E., and Erdakos, G. B.: Modeling the formation of
sec-ondary organic aerosol. 1. Application of theoretical principles to measurements obtained in the alpha-pinene/, beta- pinene/, sabinene/, Delta(3)-carene/, and cyclohexene/ozone sys-30
tems, Environ. Sci. Technol., 35, 1164–1172, 2001. 9461, 9462
ACPD
9, 9457–9489, 2009SOA modeling
M. N. Chan et al.
Title Page
Abstract Introduction
Conclusions References
Tables Figures
◭ ◮
◭ ◮
Back Close
Full Screen / Esc
Printer-friendly Version
Interactive Discussion
(yields), J. Geophys. Res.-Atmos., 112, D03201, doi:10.1029/2006JD007436, 2007. 9464, 9465, 9466, 9482, 9483
Presto, A. A. and Donahue, N. M.: Investigation of alpha-pinene plus ozone secondary organic aerosol formation at low total aerosol mass, Environ. Sci. Technol., 40, 3536–3543, 2006. 9464
5
Seinfeld, J. H., Erdakos, G. B., Asher, W. E., and Pankow, J. F.: Modeling the formation of secondary organic aerosol (SOA). 2. The predicted effects of relative humidity on aerosol formation in the alpha-pinene-, beta-pinene-, sabinene-, Delta(3)-Carene-, and cyclohexene-ozone systems, Environ. Sci. Technol., 35, 1806–1817, 2001. 9461
Shilling, J. E., Chen, Q., King, S. M., Rosenoern, T., Kroll, J. H., Worsnop, D. R., McKinney, 10
K. A., and Martin, S. T.: Particle mass yield in secondary organic aerosol formed by the dark ozonolysis of alpha-pinene, Atmos. Chem. Phys., 8, 2073–2088, 2008,
http://www.atmos-chem-phys.net/8/2073/2008/. 9460, 9464, 9465, 9470, 9482, 9483, 9486 Shilling, J. E., Chen, Q., King, S. M., Rosenoern, T., Kroll, J. H., Worsnop, D. R., DeCarlo, P. F.,
Aiken, A. C., Sueper, D., Jimenez, J. L., and Martin, S. T.: Loading-dependent elemental 15
composition ofα-pinene SOA particles, Atmos. Chem. Phys., 9, 771–782, 2009, http://www.atmos-chem-phys.net/9/771/2009/. 9465, 9468, 9469, 9470, 9471, 9487
Stanier, C. O., Donahue, N., and Pandis, S. N.: Parameterization of secondary organic aerosol mass fractions from smog chamber data, Atmos. Environ., 42, 2276–2299, 2008. 9461, 9462 Yu, J. Z., Cocker, D. R., Griffin, R. J., Flagan, R. C., and Seinfeld, J. H.: Gas-phase ozone 20
ACPD
9, 9457–9489, 2009SOA modeling
M. N. Chan et al.
Title Page Abstract Introduction Conclusions References Tables Figures ◭ ◮ ◭ ◮ Back Close
Full Screen / Esc
Printer-friendly Version
Interactive Discussion
Table 1. Major products chosen to represent the ozonolysis of α-pinene under dry, dark, and
low-NOxconditions in the presence of dry ammonium sulfate particles.
l e d o M c i f i c e p S -t c u d o r
P Volatility Basis Set
(Kp 1 case) (Kp 100case)
Product Chemical structure
O/C H/C Kpa(c*) Kp(c*) Kp (c*) from Product-Specific Model
(Kp 100 case)
Pinic acid C9H14O4
(MW: 186)
O
O OH OH
0.444 1.556 0.2822 (3.544)
0.2308 28.22 (0.0354)
0.0563 100 (0.01) 0.0707 0.0563 (Pinic acid:c* = 0.0354)
Terpenylic acid b C8H12O4
(MW: 172)
0.5 1.5 0.0332 (30.12)
0.0172 3.32 (0.3012)
0.0132 10 (0.1) 0.0110 0.0131 (Terpenylic acid: c* = 0.3012)
Hydroperoxide C10H16O4
(MW: 200)
O
O
OOH 0.4 1.6 0.0029
(344.8)
0.0181 0.29 (3.448)
0.0173 1 (1) 0.0120 0.0172 (Hydroperoxide:c* = 3.448)
Pinonic acid C10H16O3
(MW: 184)
O
O OH
0.3 1.6 0.0018 (555.6)
0.6883 0.18 (5.556)
0.1573 0.1 (10) 0.1603 0.1573 (Pinonic acid: c* = 5.556)
0.01 (100) 0.0210 -
Pinonaldehyde C10H16O2
(MW: 168)
O
O
0.2 1.6 1.145 10-5
(87334)
1 1.145 10-3
(873.34)
0.9380 0.001 (1000) 0.9554 0.9380 (Pinonaldehyde:c* = 873.34)
O
O O H
O
aVapor pressure is determined at 293 K using a model developed by Pankow and Asher (2008).K
pis determined at
293 K with the assumption of activity coefficient of the products equal to one and the molecular weight of producti, is used as mean molecular weight in organic absorbing phase, as a first approximation.
ACPD
9, 9457–9489, 2009SOA modeling
M. N. Chan et al.
Title Page
Abstract Introduction
Conclusions References
Tables Figures
◭ ◮
◭ ◮
Back Close
Full Screen / Esc
Printer-friendly Version
Interactive Discussion
0 100 200 300 400
0 0.1 0.2 0.3 0.4 0.5 0.6
SOA Yield, Y
Organic Mass Loading, M (µg/m3) Ng et al. (2006) Pathak et al. (2007) Shilling et al. (2008) Product−Specific Model (K
p x 1)
Product−Specific Model (K
p x 100)
Volatility Basis Set
0 5 10 15 20
0 0.05 0.1 0.15 0.2 0.25 0.3 0.35
SOA Yield, Y
Organic Mass Loading, M (µg/m3)
Fig. 1. SOA yield from ozonolysis of α-pinene at different organic mass loading, M. Data
represent experiments conducted under dry, dark, and low-NOxconditions in the presence of dry ammonium sulfate particles (Ng et al., 2006; Pathak et al., 2007; Shilling et al., 2008). Top panel: organic mass loading: 0–411 µg m−3
; Bottom panel: organic mass loading: 0–20 µg m−3
ACPD
9, 9457–9489, 2009SOA modeling
M. N. Chan et al.
Title Page
Abstract Introduction
Conclusions References
Tables Figures
◭ ◮
◭ ◮
Back Close
Full Screen / Esc
Printer-friendly Version
Interactive Discussion
0 100 200 300 400
0 0.2 0.4 0.6 0.8 1 1.2
SOA Yield, Y
Organic Mass Loading, M (µg/m3) Data (273K)
Data (288K) Data (293K) Data (303K) Data (313K) 273K 288K 293K 303K 313K
10−1 100 101 102
0 0.2 0.4 0.6 0.8 1
SOA Yield, Y
Organic Mass Loading, M (µg/m3) Data (273K)
Data (288K) Data (293K) Data (303K) Data (313K) 273K 288K 293K 303K 313K
Fig. 2. Temperature dependence of SOA yield of ozonolysis ofα-pinene obtained from
ACPD
9, 9457–9489, 2009SOA modeling
M. N. Chan et al.
Title Page
Abstract Introduction
Conclusions References
Tables Figures
◭ ◮
◭ ◮
Back Close
Full Screen / Esc
Printer-friendly Version
Interactive Discussion
0 50 100 150
0 20 40 60 80 100
Percentage (%)
Organic Mass Loading, M (µg/m3) Pinonic acid
Hydroperoxide Terpenylic acid Pinic acid Pinonaldehyde
0 50 100 150
0 20 40 60 80 100
Percentage (%)
Organic Mass Loading, M (µg/m3) Pinonic acid Hydroperoxide Terpenylic acid Pinic acid Pinonaldehyde Class A Class B Class C
Fig. 3. Relative contributions of the modeled products to the SOA yield at different organic
mass loadings forKp×1 case at different temperatures. Top panel: 293 K; Bottom panel: 306 K;
ACPD
9, 9457–9489, 2009SOA modeling
M. N. Chan et al.
Title Page
Abstract Introduction
Conclusions References
Tables Figures
◭ ◮
◭ ◮
Back Close
Full Screen / Esc
Printer-friendly Version
Interactive Discussion
0 50 100 150
0 20 40 60 80 100
Percentage (%)
Organic Mass Loading, M (µg/m3) Pinonic acid Hydroperoxide Terpenylic acid Pinic acid Pinonaldehyde
0 50 100 150
0 20 40 60 80 100
Percentage (%)
Organic Mass Loading, M (µg/m3)
Pinonic acid Hydroperoxide Terpenylic acid Pinic acid Pinonaldehyde Class A Class B Class C
Fig. 4.Relative contributions of the modeled products to the SOA yield at different organic mass
loadings forKp×100 case at different temperatures. Top panel: 293 K; Bottom panel: 306 K;
ACPD
9, 9457–9489, 2009SOA modeling
M. N. Chan et al.
Title Page
Abstract Introduction
Conclusions References
Tables Figures
◭ ◮
◭ ◮
Back Close
Full Screen / Esc
Printer-friendly Version
Interactive Discussion
0 50 100 150
0.2 0.25 0.3 0.35 0.4 0.45 0.5
O/C ratio
Organic Mass Loading, M (µg/m3)
O/C ratio (Shilling et al. (2009)) 273K
283K 293K 298K 306K 313K
0 50 100 150
0.2 0.25 0.3 0.35 0.4 0.45 0.5
O/C ratio
Organic Mass Loading, M (µg/m3)
O/C ratio (Shilling et al. (2009)) 273K
283K 293K 298K 306K 313K
Fig. 5.O/C ratio of SOA formed from the ozonolysis ofα-pinene under dry, dark, and low-NOx
conditions in the presence of dry ammonium sulfate particles as a function of organic mass laoding, M, at different temperatures. Top panel: Kp×1 case; Bottom panel: Kp×100 case;
ACPD
9, 9457–9489, 2009SOA modeling
M. N. Chan et al.
Title Page
Abstract Introduction
Conclusions References
Tables Figures
◭ ◮
◭ ◮
Back Close
Full Screen / Esc
Printer-friendly Version
Interactive Discussion
0 50 100 150
1.3 1.35 1.4 1.45 1.5 1.55 1.6
H/C ratio
Organic Mass Loading, M (µg/m3)
H/C ratio (Shilling et al. (2009)) 273K
283K 293K 298K 306K 313K
0 50 100 150 1.3
1.35 1.4 1.45 1.5 1.55 1.6
H/C ratio
Organic Mass Loading, M (μg/m3)
H/C ratio (Shilling et al. (2009)) 273K
283K 293K 298K 306K 313K
Fig. 6.H/C ratio of SOA formed from the ozonolysis ofα-pinene under dry, dark, and low-NOx
conditions in the presence of dry ammonium sulfate particles as a function of organic mass loading, M, at different temperatures. Top panel: Kp×1 case; Bottom panel: Kp×100 case;
ACPD
9, 9457–9489, 2009SOA modeling
M. N. Chan et al.
Title Page
Abstract Introduction
Conclusions References
Tables Figures
◭ ◮
◭ ◮
Back Close
Full Screen / Esc
Printer-friendly Version
Interactive Discussion
1.6
1.4
1.2
1.0
0.8
0.6
0.4
0.2
0.0
O/C and H/C Ratios
400 300
200 100
0
Oxidation Time (min) 60
50
40
30
20
10
0
Organic Mass Loading (µg/m
3 ), a-pinene conc. (ppb)
O/C Ratio H/C Ratio
Organic Mass Loading a-pinene Conc.
Fig. 7. Time evolution of α-pinene concentration, organic mass loading, and O/C and H/C
ACPD
9, 9457–9489, 2009SOA modeling
M. N. Chan et al.
Title Page
Abstract Introduction
Conclusions References
Tables Figures
◭ ◮
◭ ◮
Back Close
Full Screen / Esc
Printer-friendly Version
Interactive Discussion
0.40
0.35
0.30
0.25
O/C Ratio
60 50
40 30
20 10
0
Organic Mass Loading (µg/m3)
1.60
1.55
1.50
1.45
1.40
1.35
1.30
H/C Ratio
O/C ratio H/C ratio
Fig. 8.O/C and H/C ratios of SOA formed from the ozonolysis ofα-pinene under dry, dark, and