ACPD
15, 28575–28617, 2015Observation of viscosity transition in
α-pinene secondary
organic aerosol
E. Järvinen et al.
Title Page
Abstract Introduction
Conclusions References
Tables Figures
◭ ◮
◭ ◮
Back Close
Full Screen / Esc
Printer-friendly Version Interactive Discussion
Discussion
P
a
per
|
Discussion
P
a
per
|
Discussion
P
a
per
|
Discussion
P
a
per
Atmos. Chem. Phys. Discuss., 15, 28575–28617, 2015 www.atmos-chem-phys-discuss.net/15/28575/2015/ doi:10.5194/acpd-15-28575-2015
© Author(s) 2015. CC Attribution 3.0 License.
This discussion paper is/has been under review for the journal Atmospheric Chemistry and Physics (ACP). Please refer to the corresponding final paper in ACP if available.
Observation of viscosity transition in
α
-pinene secondary organic aerosol
E. Järvinen1, K. Ignatius2, L. Nichman3, T. B. Kristensen2, C. Fuchs4, N. Höppel1, J. C. Corbin4, J. Craven5, J. Duplissy6, S. Ehrhart7, I. El Haddad4, C. Frege4, S. J. Gates4, H. Gordon7, C. R. Hoyle4,8, T. Jokinen6, P. Kallinger9, J. Kirkby7,10, A. Kiselev1, K.-H. Naumann1, T. Petäjä6, T. Pinterich9, A. S. H. Prevot4,
H. Saathoff1, T. Schiebel1, K. Sengupta11, M. Simon10, J. Tröstl4, A. Virtanen12, P. Vochezer1, S. Vogt1, A. C. Wagner10, R. Wagner1, C. Williamson10,13,14, P. M. Winkler9, C. Yan6, U. Baltensperger4, N. M. Donahue15, R. C. Flagan16, M. Gallagher3, A. Hansel17, M. Kulmala6, F. Stratmann2, D. R. Worsnop18, O. Möhler1, T. Leisner1, and M. Schnaiter1
1
Karlsruhe Institute of Technology, Institute for Meteorology and Climate Research, P.O. Box 3640, 76021 Karlsruhe, Germany
2
Institute for Tropospheric Research (TROPOS), 04318 Leipzig, Germany 3
School of Earth, Atmospheric and Environmental Sciences, University of Manchester, Manchester, M13 9PL, UK
4
Laboratory of Atmospheric Chemistry, Paul Scherrer Institute, Villigen, Switzerland 5
ACPD
15, 28575–28617, 2015Observation of viscosity transition in
α-pinene secondary
organic aerosol
E. Järvinen et al.
Title Page
Abstract Introduction
Conclusions References
Tables Figures
◭ ◮
◭ ◮
Back Close
Full Screen / Esc
Printer-friendly Version Interactive Discussion
Discussion
P
a
per
|
Discussion
P
a
per
|
Discussion
P
a
per
|
Discussion
P
a
per
|
6
Helsinki Institute of Physics and University of Helsinki, Department of Physics, Helsinki, Finland
7
CERN, 1211, Geneva, Switzerland 8
Swiss Federal Institute for Forest Snow and Landscape Research (WSL)-Institute for Snow and Avalanche Research (SLF), 7270 Davos, Switzerland
9
Faculty of Physics, University of Vienna, Austria 10
Institute for Atmospheric and Environmental Sciences, Goethe-University Frankfurt am Main, Campus Riedberg Altenhöferallee 1, 60438 Frankfurt am Main, Germany
11
University of Leeds, School of Earth and Environment, LS2-9JT Leeds, UK 12
Department of Applied Physics, University of Eastern Finland, Kuopio, Finland 13
NOAA Earth Systems Research Laboratory (ESRL), Chemical Sciences Division, 325 Broadway, Boulder, Colorado 80305, USA
14
Cooperative Institute for Research in Environmental Sciences (CIRES), University of Colorado Boulder, UCB 216, Boulder, Colorado 80309, USA 15
Center for Atmospheric Particle Studies, Carnegie Mellon University, 5000 Forbes Ave., Pittsburgh PA 15213, USA
16
California Institute of Technology, Division of Chemistry and Chemical Engineering, Pasadena, California 91125, USA
17
Institute for Ion and Applied Physics, 6020 Innsbruck and Ionicon Analytik GmbH, 6020 Innsbruck, Austria
18
Aerodyne Research, Inc., Billerica, MA 08121, USA
Received: 4 September 2015 – Accepted: 2 October 2015 – Published: 22 October 2015
Correspondence to: E. Järvinen (emma.jaervinen@kit.edu)
ACPD
15, 28575–28617, 2015Observation of viscosity transition in
α-pinene secondary
organic aerosol
E. Järvinen et al.
Title Page
Abstract Introduction
Conclusions References
Tables Figures
◭ ◮
◭ ◮
Back Close
Full Screen / Esc
Printer-friendly Version Interactive Discussion
Discussion
P
a
per
|
Discussion
P
a
per
|
Discussion
P
a
per
|
Discussion
P
a
per
Abstract
Under certain conditions, secondary organic aerosol (SOA) particles can exist in the atmosphere in an amorphous solid or semi-solid state. To determine their relevance to processes such as ice nucleation or chemistry occurring within particles requires knowledge of the temperature and relative humidity (RH) range for SOA to exist in
5
these states. In the CLOUD experiment at CERN, we deployed a new in-situ optical method to detect the viscosity ofα-pinene SOA particles and measured their transition from the amorphous viscous to liquid state. The method is based on the depolarising properties of laboratory-produced non-spherical SOA particles and their transforma-tion to non-depolarising spherical liquid particles during deliquescence. We found that
10
particles formed and grown in the chamber developed an asymmetric shape through coagulation. A transition to spherical shape was observed as the RH was increased to between 35 % at −10◦C and 80 % at −38◦C, confirming previous calculations of the viscosity transition conditions. Consequently,α-pinene SOA particles exist in a vis-cous state over a wide range of ambient conditions, including the cirrus region of the
15
free troposphere. This has implications for the physical, chemical and ice-nucleation properties of SOA and SOA-coated particles in the atmosphere.
1 Introduction
Organic particulate material is abundant in Earth’s atmosphere. Biogenic and anthro-pogenic sources emit volatile organic compounds (VOCs), which are oxidised through
20
a cascade of chemical reactions into extremely low volatility vapours that condense into the particle phase to form secondary organic aerosol (SOA) (Hallquist et al., 2009). Biogenic VOCs are much more abundant than anthropogenic VOCs (Guenther et al., 1995; Jimenez et al., 2009) and monoterpenes such asα-pinene are found throughout the continental boundary layer, particularly in boreal forest regions (e.g., Tunved et al.,
25
ACPD
15, 28575–28617, 2015Observation of viscosity transition in
α-pinene secondary
organic aerosol
E. Järvinen et al.
Title Page
Abstract Introduction
Conclusions References
Tables Figures
◭ ◮
◭ ◮
Back Close
Full Screen / Esc
Printer-friendly Version Interactive Discussion
Discussion
P
a
per
|
Discussion
P
a
per
|
Discussion
P
a
per
|
Discussion
P
a
per
|
scale directly by scattering and absorbing solar radiation and indirectly through aerosol-cloud interactions. Locally, SOA can affect air quality and human health (e.g., Nel, 2005; Huang et al., 2014). However, the chemical and physical processes that determine the properties of SOA particles are complex, and our understanding of these processes is limited (Hallquist et al., 2009; Hoyle et al., 2011).
5
Recently, considerable attention has been given to water uptake and viscous prop-erties of SOA. It has been found that SOA particles can exist in the atmosphere in an amorphous semi-solid or solid state (Virtanen et al., 2010; Koop et al., 2011; Renbaum-Wolff et al., 2013; Pajunoja et al., 2014). The existence of these states has several atmospheric implications. Molecular diffusion in the condensed phase affects the gas
10
uptake by viscous SOA particles and can, therefore, alter the SOA particle lifetime in the atmosphere (Shiraiwa et al., 2011). In addition, water uptake is inhibited in the vis-cous particles (Riipinen et al., 2012), limiting the SOA growth under conditions in which SOA would typically grow hygroscopically (Swietlicki et al., 2008; Pajunoja et al., 2015). This, in turn, influences the aerosol direct effect on radiative forcing. More recent
stud-15
ies have shown that the viscous SOA particles or their proxies can act as ice nuclei (IN) (Murray et al., 2010; Wagner et al., 2012; Wang et al., 2012; Wilson et al., 2012; Schill et al., 2014), thus influencing cloud cover, cloud optical properties, and precipitation.
In order to understand the climatological influence of the viscous state of SOA parti-cles, detailed knowledge of the temperature and relative humidity (RH) ranges in which
20
SOA can persist in a solid or semi-solid state is needed. Several experimental methods have been developed to measure the transition temperature or RH between different SOA phase states. A direct way to measure the glass transition temperature, Tg, of
SOA substances is to use differential scanning calorimetry (DSC, Zobrist et al., 2008). However, this method requires the removal of the semivolatile aerosol particles from
25
the surrounding gas, which can change the state, shape, or composition of the SOA particles. In contrast, indirect methods allow the sampling of the SOA particles with their surrounding gas. As indirect methods, they do not directly measureTg, but rather
ACPD
15, 28575–28617, 2015Observation of viscosity transition in
α-pinene secondary
organic aerosol
E. Järvinen et al.
Title Page
Abstract Introduction
Conclusions References
Tables Figures
◭ ◮
◭ ◮
Back Close
Full Screen / Esc
Printer-friendly Version Interactive Discussion
Discussion
P
a
per
|
Discussion
P
a
per
|
Discussion
P
a
per
|
Discussion
P
a
per
temperature or RH. These methods include the bounce method that exploits the fact that solid or semisolid particles rebound in an impactor plate, whereas liquid particles adhere. A low pressure impactor (ELPI; Virtanen et al., 2010; Saukko et al., 2012) has been used for this purpose and, recently, the method is extended to work at atmo-spheric pressures (Bateman et al., 2014). Moreover, the so-calledpoke-flow method
5
(Renbaum-Wolff et al., 2013) and the shatter technique (Schill et al., 2014) use me-chanical forces to disturb single particles and the response to the meme-chanical stress can be linked with a phase state. Finally, the particle phase state can be determined with measurement of their aerodynamic shape factor (Zhang et al., 2015).
Although these methods provide useful insights into the nature of the SOA particles,
10
the SOA aerosol has been sampled and passed through an instrument, in which their environment is altered. This may result in a change in the material properties. In an effort to minimise biases due to these perturbations, we have employed a new optical method that provides a noninvasive probe of shape or structural anisotropy that may be present in solid or highly viscous semisolid SOA particles (Virtanen et al., 2010;
15
Adler et al., 2013; Pajunoja et al., 2014; Schill et al., 2014; Zhang et al., 2015), but that is quickly erased in low viscosity droplets as they relax toward the most energet-ically favourable state, i.e., spherical droplets that are homogeneous throughout their volumes.
For a perfectly isotropic, spherical particle, light that is scattered directly back toward
20
its source, i.e., in a direction of 180◦ from that of the incident light, retains its initial polarisation state. Whether it results from deviations from spherical symmetry, or from structural inhomogeneities, anisotropy in the optical properties leads to depolarisation. A measurement of the extent of depolarisation in the backscattered light probes the magnitude of the anisotropy and, hence, the ability of the particle to relax to its
low-25
energy state. This signal thus reflects the viscosity of the material that comprises the particle, provided that some mechanism has previously introduced anisotropy.
tran-ACPD
15, 28575–28617, 2015Observation of viscosity transition in
α-pinene secondary
organic aerosol
E. Järvinen et al.
Title Page
Abstract Introduction
Conclusions References
Tables Figures
◭ ◮
◭ ◮
Back Close
Full Screen / Esc
Printer-friendly Version Interactive Discussion
Discussion
P
a
per
|
Discussion
P
a
per
|
Discussion
P
a
per
|
Discussion
P
a
per
|
sitions that SOA particles may undergo as they become solvated with water at high humidity. This paper is organised as follows. The new method depends on how diff er-ent types of anisotropy affect depolarisation of light scatted by the small (sub-micron) SOA particles that are found in the atmosphere. We begin, therefore, with theoretical and modelling studies of the effects of size, shape, and internal structure on the
depo-5
larisation signals that we may expect. The modelling studies allow us to constrain the range of particle sizes and concentrations for which the method is useful, and proved central to the design and optimisation of an instrument capable of measuring the vis-cous transition under atmospheric conditions. Moreover, they aid in understanding the relative importance of shape and structural anisotropy in the measurements.
10
We then describe the experimental method, the instrument that has been devel-oped, and instrument characterisation experiments that assess the limits to the sensi-tivity of the depolarisation measurements. We have measured the viscosity transition of a model SOA system, i.e., the SOA produced by oxidation ofα-pinene. The experi-ments were conducted in the CERN CLOUD chamber, an environmental chamber that
15
has unique capabilities to simulate conditions throughout the troposphere while main-taining the cleanliness required for new particle formation studies (Schnitzhofer et al., 2014). We describe the experimental facility, key measurement methods that were em-ployed, and experimental procedures.
Experimental results are described, beginning with those from the instrument
char-20
acterisation studies, but then focusing on the dynamics of the SOA particles, the evo-lution of their properties, and the viscosity transition of theα-pinene SOA. We continue the paper by a discussion of the atmospheric implications of our findings, and finish with conclusions.
2 Theoretical considerations
25
ACPD
15, 28575–28617, 2015Observation of viscosity transition in
α-pinene secondary
organic aerosol
E. Järvinen et al.
Title Page
Abstract Introduction
Conclusions References
Tables Figures
◭ ◮
◭ ◮
Back Close
Full Screen / Esc
Printer-friendly Version Interactive Discussion
Discussion
P
a
per
|
Discussion
P
a
per
|
Discussion
P
a
per
|
Discussion
P
a
per
linear or circular depolarisation in the exact backward direction, whereas non-spherical particles alter the depolarisation state of incident light depending on their size, shape, and refractive index. Therefore, depolarisation measurements can be used to deter-mine the asphericity of isotropic particles. The magnitude of the depolarisation ratio can, in the case of aerosol particles, vary from only few per cent (in the case of sea
5
salt) to up to 0.4 (in the case of dust aerosol) (Sakai et al., 2010). Solid or semi-solid amorphous particles may also induce depolarisation due to internal structures or inho-mogeneous refractive index. In this case the depolarisation will depend on the gradient and/or variation of the refractive index as well as the size of the particle. In the case of sub-micron particles, the scale of the variation in particle properties is restricted by
10
the size, and hence we can expect a maximum depolarisation ratio of 0.01 due to par-ticle inhomogenities, whereas the probable depolarisation ratios are well below that (Li et al., 2005; Dlugach and Mishchenko, 2015).
To quantify the extent of depolarisation, we define the the depolarisation ratio,δL,C
(indices L, C denoting the liner or circular incident depolarisation state) as the ratio
15
of the intensity of the parallel polarised light, Ik, to the perpendicular polarised light,
I⊥, in the backscatter direction when the particle is illuminated with perpendicularly polarised light. For a perfect measurement, we could take the ratio directly. In any real measurement there will be some background contribution to these two signals in the form of molecular scattering and scattering from chamber walls. Therefore, we subtract
20
the background intensitiesIbg
k andI
bg
⊥ measured in the absence of scattering particles from the measured scattered light intensities during particle measurements, defining
δL,Cas
δL,C=
Ik−Ikbg
I⊥−I⊥bg
. (1)
We modelled the depolarisation ratio to assess the sensitivity of this method to the
25
ACPD
15, 28575–28617, 2015Observation of viscosity transition in
α-pinene secondary
organic aerosol
E. Järvinen et al.
Title Page
Abstract Introduction
Conclusions References
Tables Figures
◭ ◮
◭ ◮
Back Close
Full Screen / Esc
Printer-friendly Version Interactive Discussion
Discussion
P
a
per
|
Discussion
P
a
per
|
Discussion
P
a
per
|
Discussion
P
a
per
|
for studies of the viscosity transition. We ignore the effect of anisotropy and consider only the influence of the particle asphericity on the depolarisation ratio. This can be estimated using a T-matrix approach in a regime that is appropriate for particles whose size is of the order of the wavelength of the incident light (Mishchenko et al., 1996). We performed T-matrix computations using the aforementioned constraints to model the
5
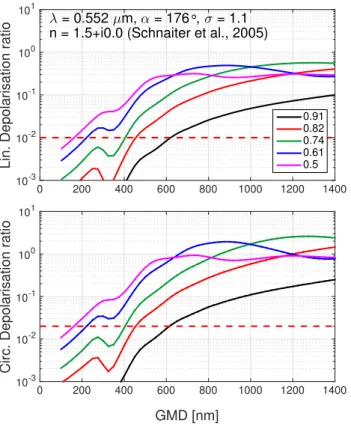
expected depolarisation properties of growing SOA particles in our experiments. The simulations were done for a particle size distributions with geometric mean diameters (GMD) ranging from 100 to 1400 nm and with a narrow geometric standard deviation (GSD) of 1.1, as would be expected when the primary growth mechanism is conden-sation. The refractive index was chosen to be 1.5+0i after Schnaiter et al. (2005), with
10
the assumption that the refractive index of viscousα-pinene SOA does not differ sig-nificantly from that of an aqueous solution of α-pinene SOA. Further details on the computational procedures used to model particle depolarisation ratios can be found in Schnaiter et al. (2012).
2.1 Simulation results
15
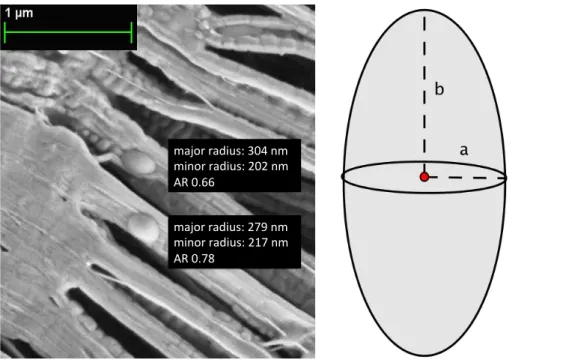
The SOA particles were modelled with prolate spheroids. Prolate spheroids have a greater polar radius than equatorial radius, having the form of a symmetrical egg. In the T-matrix formalism the aspect ratio of these particles describes the relationship of the equatorial radius to the polar radius and is therefore always smaller than 1 (Fig. 1). Since the aspect ratio of the SOA particles is unknown, we performed the calculations
20
with aspect ratios ranging from 0.91 to 0.5 (Fig. 2), where the largest aspect ratio of 0.91 represents the smallest deviation from a spherical shape and the smallest aspect ratio of 0.5 the largest deviation. Figure 2 shows that both the linear and circular de-polarisation ratios increase with increasing GMD of the particles. The increase in the depolarisation ratio is significant up to 800 nm, whereafter the influence of the size of
25
ACPD
15, 28575–28617, 2015Observation of viscosity transition in
α-pinene secondary
organic aerosol
E. Järvinen et al.
Title Page
Abstract Introduction
Conclusions References
Tables Figures
◭ ◮
◭ ◮
Back Close
Full Screen / Esc
Printer-friendly Version Interactive Discussion
Discussion
P
a
per
|
Discussion
P
a
per
|
Discussion
P
a
per
|
Discussion
P
a
per
zero depolarisation ratios at GMD below 400 nm and a maximum depolarisation ratio that is close to 0.1 (linear depolarisation) or to 0.25 (circular depolarisation) at GMD of 1400 nm.
As a result of these modelling studies, we can estimate that the internal inhomo-geneity of SOA particles will most likely have only small, almost negligible effect on the
5
depolarisation ratio and that the depolarisation ratio is mainly determined by the de-gree of particle asphericity. The T-matrix results showed that the particles with a GMD from 50 to 800 nm will only produce extremely small depolarisation ratios, which will be challenging for the depolarisation measurements. A high degree of sensitivity is re-quired for the depolarisation instrument, otherwise, the particles would require growth
10
to sizes larger than 1 µm.
3 Experimental methods
3.1 Depolarisation measurements
We developed a new in-situ depolarisation instrument, SIMONE-Junior, with the neces-sary sensitivity to detect very low depolarisation ratios. SIMONE-Junior is based on the
15
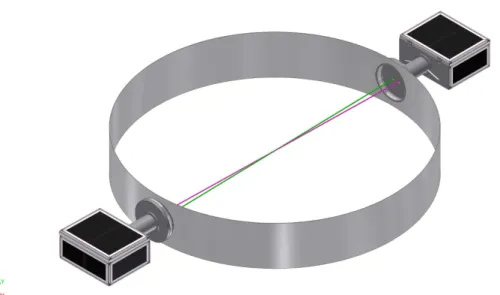
design of the first SIMONE instrument (Schnaiter et al., 2012), which is installed at the cloud chamber facility AIDA of the Karlsruhe Institute of Technology, with few improve-ments that have been implemented to attain the sensitivity and stability requireimprove-ments that were identified in the simulations. SIMONE-Junior uses a continuous wave (cw) laser (Coherent 552 nm OBIS laser, 20 mW) to create a polarised and collimated light
20
beam that is directed horizontally across the chamber (Fig. 3). The incident linear po-larisation state of the laser beam can be aligned either parallel or perpendicular to the scattering plane by a liquid crystal polarisation rotator. Moreover, in contrast to the AIDA SIMONE, a liquid crystal variable retarder, cabable to be operated as a quarter-wave plate, was introduced to the system to allow generation of circularly polarised
25
ACPD
15, 28575–28617, 2015Observation of viscosity transition in
α-pinene secondary
organic aerosol
E. Järvinen et al.
Title Page
Abstract Introduction
Conclusions References
Tables Figures
◭ ◮
◭ ◮
Back Close
Full Screen / Esc
Printer-friendly Version Interactive Discussion
Discussion
P
a
per
|
Discussion
P
a
per
|
Discussion
P
a
per
|
Discussion
P
a
per
|
to left-handed, although in this study we used only right-handed circular incident polar-isation.
Two telescopes collect the laser light scattered from centre of the aerosol chamber at an angle of 4◦in the forward direction and 176◦in the backward direction. While the intensity in the forward scattering angle is directly measured with a photonmultiplier
5
tube, the intensity in the backward scattering angle is decomposed into its polarisation components by a Wollaston prism. In the case of circular polarisation, the scattered light is first retarded to linear polarisation with a second liquid crystal variable retarder before the Wollaston prism.
3.2 Experimental setup
10
The experiments presented here were conducted at the CERN CLOUD cham-ber (Kirkby et al., 2011; Duplissy et al., 2015) during the CLOUD8 (Novemcham-ber– December 2013) and CLOUD9 campaigns (September–November 2014). The cham-ber consists of a 26 m3 stainless steel cylinder that is located inside a housing with thermal insulation. The temperature of the chamber can be varied from−60 to 100◦C
15
and it is controlled by regulating the temperature of air flowing around the chamber and inside the thermal housing. During the CLOUD8 and CLOUD9 campaigns, the temperature inside the chamber was measured with a string of six thermocouples po-sitioned horizontally at different distances between the wall and the chamber centre. We used the mean of the four inner thermocouples as a representative measure of the
20
temperature in the chamber volume.
In the course of the experiments, air from the chamber was constantly sampled; and this sampled air was replaced with humidified artificial air to maintain a constant pres-sure inside the chamber. The artificial air was created by evaporating liquid nitrogen and oxygen, and humidified by passing part of the flow through a Nafion humidifier
25
ACPD
15, 28575–28617, 2015Observation of viscosity transition in
α-pinene secondary
organic aerosol
E. Järvinen et al.
Title Page
Abstract Introduction
Conclusions References
Tables Figures
◭ ◮
◭ ◮
Back Close
Full Screen / Esc
Printer-friendly Version Interactive Discussion
Discussion
P
a
per
|
Discussion
P
a
per
|
Discussion
P
a
per
|
Discussion
P
a
per
or lower, to enable rapid RH increase. The water vapour was mixed with the main air stream before entering the chamber, which allowed a homogeneous RH throughout the chamber volume after a mixing time of few minutes (Voigtländer et al., 2012). The RH inside the chamber was measured with a chilled mirror dew point hygrometer (MBW, model 973). During CLOUD9 a tuneable diode laser (TDL system) was used to
mea-5
sure water vapour, in addition to the MBW. The newly installed tuneable diode laser system will be described in more detail in the following section.
SOA particles were produced within the CLOUD chamber by ozonolysis of gaseous
α-pinene; the two reactant gases were separately fed into the chamber through mass flow controllers. The ozone was monitored with a trace gas monitor (O3 analyser, 10
Thermo Environmental Instruments, Inc., Model 49C); α-pinene was measured by a PTR-TOF (Proton Transfer Reaction Time of Flight Mass Spectrometer, Ionicon An-alytic). The ozone concentration was continuously measured, but, due to high concen-trations of α-pinene (over 600 ppbv), the PTR-TOF signal saturated, so it could not be measure continuously. The production of SOA was enhanced by UV photolysis of
15
ozone to form OH radicals. A 50 W UV source (Philips TUV 130 W XPT lamp) was in-stalled in a quartz tube inserted into the chamber. The formed OH oxidisedα-pinene to produce secondary organic vapours that nucleated and grew the aerosol particles.
Supporting measurements were provided by a range of instruments that were used to measure the physical and chemical composition of the aerosol particles inside the
20
chamber. The chemical composition of the sub-micron aerosol particles was measured with an Aerodyne high-resolution time-of-flight aerosol mass spectrometer (HR-ToF AMS). From these measurements the atomic oxygen to carbon ratio (O/C) was deter-mined. The size distribution of the aerosol particles was measured with an Ultra-High Sensitivity Aerosol Spectrometer (UHSAS, DMT), which measures the optical sphere
25
ACPD
15, 28575–28617, 2015Observation of viscosity transition in
α-pinene secondary
organic aerosol
E. Järvinen et al.
Title Page
Abstract Introduction
Conclusions References
Tables Figures
◭ ◮
◭ ◮
Back Close
Full Screen / Esc
Printer-friendly Version Interactive Discussion
Discussion
P
a
per
|
Discussion
P
a
per
|
Discussion
P
a
per
|
Discussion
P
a
per
|
a 10 nm cutoffand with a maximum detectable particle concentration of 10 000 cm−3 without coincidence corrections.
3.2.1 Relative humidity measurements
During the CLOUD9 campaign a tuneable diode laser (TDL) hygrometer, comparable to the APicT instrument as described by Fahey et al. (2014), was used to measure the
5
water vapour content in-situ. The TDL has 1 Hz time resolution and employs a single optical path of 314 cm once across the mid-plane of the CERN CLOUD chamber. Its main component is a temperature-controlled, 10 mW distributed feedback diode laser (NTT Electronics) at a wavelength of (1370±1) nm. The water absorption line was fitted on-line to determine water concentrations based on well-known spectroscopic
10
constants. The windows mounted on the chamber limited the measurement range to between 30–1300 Pa water vapour pressure (300–13 000 ppm mixing ratio); the mea-surement uncertainty was ±7 % above 100 Pa and ±10 % between 30 and 100 Pa. The relative humidity in the CLOUD chamber was calculated using these humidity data together with the average temperatures measured with a horizontal string of four
cal-15
ibrated thermocouples at the mid-plane of the chamber. The two thermocouples near the wall were excluded due to wall temperature effect. The TDL hygrometer data en-abled determination of the relative humidity even in the presence of clouds in the cham-ber, with an uncertainty of ±10 % above 100 Pa and ±13 % between 30 and 100 Pa water vapour pressure. The total humidity in the CLOUD chamber was also derived
20
from the measurements from dew point hygrometer (model MBW973, MBW calibration Ltd.) attached to a heated sampling line.
3.2.2 Experimental procedure
The aim of the experiments was to determine if a slightly aspherical particle shape or internal inhomogeneity of the viscous amorphous SOA could be detected by
sensi-25
ACPD
15, 28575–28617, 2015Observation of viscosity transition in
α-pinene secondary
organic aerosol
E. Järvinen et al.
Title Page
Abstract Introduction
Conclusions References
Tables Figures
◭ ◮
◭ ◮
Back Close
Full Screen / Esc
Printer-friendly Version Interactive Discussion
Discussion
P
a
per
|
Discussion
P
a
per
|
Discussion
P
a
per
|
Discussion
P
a
per
from irregular to a spherical shape during a phase transition as the RH was increased. The range of experiments required was determined using the T-matrix modelling to-gether with the lowest detection limit of the SIMONE-Junior instrument as guidelines. Figure 2 demonstrates that, in order to measure a significant depolarisation signal with the highest aspect ratio (0.91), particles with a GMD of at least 600 nm must be
gen-5
erated. Furthermore, in contrast to atmospheric lidar applications (e.g., Sassen, 1991; Hirsikko et al., 2014), the detection volume of the SIMONE instrument is small, only few cubiccentimeters. This means that we would need a high concentration to have enough particles inside this small detection volume to produce measurable signals. We estimated that an initial concentration of 10 000 cm−3newly formed SOA particles
10
would produce adequate signals once the particles reached the size of 600 nm. Each experiment commenced with clean, aerosol-free air (background concentra-tion well below 1 cm−3 and low RH (ranging from 5–15 %). The SOA particles were generated and grown in the chamber by continuous oxidation ofα-pinene (maximum concentration ∼600 ppbv) with ozone (maximum concentration ∼700 ppbv) to form
15
low volatility oxidised organic compounds. SOA nucleation was initiated by injectingα -pinene (10 mL min−1) and ozone (1000 mL min−1) into the chamber simultaneously for 1 to 7 min, depending on the chamber temperature, and then turning on the UV light. After 1 min theα-pinene flow was turned offuntil the freshly nucleated particles had grown to a mean diameter of approximately 100 nm. This produced a near-monodisperse
20
particle population. At this point the α-pinene flow was turned back on and continu-ously injected into the chamber in order to grow the existing particles without induc-ing further new particle formation. The initial particle burst typically comprised around 50 000–100 000 cm−3 α-pinene SOA particles, which rapidly grew to about 20 nm di-ameter. After the particles had grown to diameters of approximately 600 nm, losses
25
ACPD
15, 28575–28617, 2015Observation of viscosity transition in
α-pinene secondary
organic aerosol
E. Järvinen et al.
Title Page
Abstract Introduction
Conclusions References
Tables Figures
◭ ◮
◭ ◮
Back Close
Full Screen / Esc
Printer-friendly Version Interactive Discussion
Discussion
P
a
per
|
Discussion
P
a
per
|
Discussion
P
a
per
|
Discussion
P
a
per
|
the chamber while simultaneously mixing the air inside the chamber with fans. This was continued until the depolarisation signal had decreased to a constant zero-level. These experiments were performed at four different temperatures:−10,−20,−30 and
−38◦C.
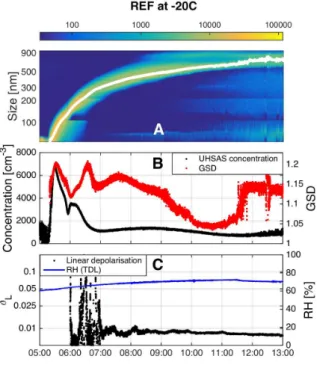
In addition to these transition experiments, we performed one reference run with
5
a higher starting RH (60–70 %) at−20◦C. The nucleation and growth of the α-pinene SOA particles was conducted in the same way as the other experiments but the high RH was kept constant throughout. The purpose of this reference run was to produce a similar size distribution ofα-pinene SOA particles as in the viscosity-transition runs, while ensuring that the state of the particles did not change, i.e., remained liquid, so
10
they could not induce depolarisation. This run was used to verify the depolarisation method for a SOA system and to exclude the possibility of artifacts. The operating conditions for the reference run and all the viscosity-transition runs are listed in Table 1.
4 Results and discussion
4.1 Sensitivity of the depolarisation measurements
15
Imperfect alignment and non-ideal behaviour of the optical components can induce crosstalk between the parallel and perpendicular channels in the backward scattering direction, i.e., in the perpendicular channel a percentage of the parallel intensity is measured and vice versa. This crosstalk ultimately determines the limit of detection (LOD) for the depolarisation ratio. The LOD can also be defined as the depolarisation
20
crosstalk that is measured in the case of spherical particles.
To determine the LOD, we measured the depolarisation ratio of laboratory-generated sulphuric acid (SA) solution droplets. SA droplets are known to be spherical (e.g., Schnaiter et al., 2012), and since in the calibration we restrict to sub-micrometer sizes, the SA particles should not introduce linear or circular depolarisation at the
measure-25
ACPD
15, 28575–28617, 2015Observation of viscosity transition in
α-pinene secondary
organic aerosol
E. Järvinen et al.
Title Page
Abstract Introduction
Conclusions References
Tables Figures
◭ ◮
◭ ◮
Back Close
Full Screen / Esc
Printer-friendly Version Interactive Discussion
Discussion
P
a
per
|
Discussion
P
a
per
|
Discussion
P
a
per
|
Discussion
P
a
per
calibration experiments; this signal represents the crosstalk from the parallel channel to the perpendicular channel. To minimise this depolarisation crosstalk, we optimised the alignment of the optical components by separately rotating the optical planes of each component until a minimum depolarisation signal was measured. The minimum crosstalk depolarisation signal in the case of linear (parallel) incident polarisation was
5
0.002, and, in the case of circular (right-handed) incident polarisation, 0.015. Moreover, it has to be kept in mind that the alignment of the instrument may change over time, as the instrument is mounted on a chamber (Sect. 3.2, Fig. 3), whose walls move during the 200 mbar pressure expansions used for other experiments (a maximum displace-ment of 0.5◦was observed), and may not return to the exact original position. This also
10
means that the LOD will increase from the calibration value. To be absolutely confident that a measured depolarisation signal is significant, we specified the LOD for linear depolarisation to be 0.01 and for circular depolarisation to be 0.02. If the depolarisa-tion ratio is below these thresholds, we consider the particles indistinguishable from spherical according to our method.
15
4.2 Growth and coagulation of theα-pinene SOA particles
We performed eight SOA nucleation and growth experiments in the CLOUD chamber using identical initial conditions described in Sect. 3.2.2. Each experiment resulted in a nucleation event that was followed by rapid growth of theα-pinene SOA particles, producing a narrow particle size mode. Two examples of the growth of a single narrow
20
mode are shown in Figs. 4 and 5. We fitted a log-normal distribution to the particle size distribution data to retrieve GMD and GSD. The GMD are shown in the first panels, and the GSD together with number concentration in the second panels. From the log-normal fit results, we see that the two runs presented in Figs. 4 and 5 are almost identical with respect to the particle size distribution, even though they were conducted
25
ACPD
15, 28575–28617, 2015Observation of viscosity transition in
α-pinene secondary
organic aerosol
E. Järvinen et al.
Title Page
Abstract Introduction
Conclusions References
Tables Figures
◭ ◮
◭ ◮
Back Close
Full Screen / Esc
Printer-friendly Version Interactive Discussion
Discussion
P
a
per
|
Discussion
P
a
per
|
Discussion
P
a
per
|
Discussion
P
a
per
|
In each case, particles grew beyond 700 nm. The similarities between these two runs is important for interpreting the depolarisation signals, as will be shown later.
Continuous addition of trace gases during RUN1_-20C, RUN_-30C and RUN_-38C led to undesired nucleation events leading to a bimodal distribution of large (main mode with highest concentration) and small particles (secondary nucleation). The additional
5
nucleation event always occurred before the viscosity-transition RH was reached, so we can assume that the state of the newly formedα-pinene SOA particles was highly viscous. This assumption will be verified later with the depolarisation data.
The high SOA particle concentration led to the formation of aggregates by coagula-tion inside the chamber. The coagulacoagula-tion process becomes an important determinant
10
for the shape of the particles at sizes larger than 30 nm; it has been suggested that sub-30 nm SOA particles are sufficiently liquid (Virtanen et al., 2011) that they coales-cence upon coagulation and, therefore, remain spherical. We estimated the coagula-tion rate using the COSIMA model of Naumann (2003), which was initialised with the size distribution measurements from the SPMS and with an estimated particle
den-15
sity of 1.25 g cm−3. The sticking probability was set to 1 in the model. Figure 6 shows the calculated coagulation rate together with the total concentration from SMPS for the experiment RUN2_-10C (Fig. 4). A maximum concentration of 100 000 cm−3 was reached, which led to a coagulation rate of 10 cm−3s−1. At 17:30 UTC the time integral of the coagulation rate was 23 000 cm−3, which gives an estimate of the number of
20
particles involved in the coagulation process. This number is of the same order as the total number concentration (25 000 cm−3) measured at the same time, indicating that the majority of the SOA particles were involved in coagulation processes and can be expected to have formed aggregates. As the particle number concentration decreases, the aggregation rate decreases to well below 1 cm−3s−1, making coagulation
unim-25
ACPD
15, 28575–28617, 2015Observation of viscosity transition in
α-pinene secondary
organic aerosol
E. Järvinen et al.
Title Page
Abstract Introduction
Conclusions References
Tables Figures
◭ ◮
◭ ◮
Back Close
Full Screen / Esc
Printer-friendly Version Interactive Discussion
Discussion
P
a
per
|
Discussion
P
a
per
|
Discussion
P
a
per
|
Discussion
P
a
per
The nucleation and growth conditions for the SOA particles in these experiments at the CLOUD chamber are unlikely to be fully representative of the conditions where SOA is formed in the atmosphere (e.g., Dal Maso et al., 2005; Kulmala et al., 2007, 2013; Kirkby et al., 2011; Riccobono et al., 2014). Viscous biogenic SOA particles have been observed to form in nucleation events in the boreal forest (Virtanen et al.,
5
2010), where the concentrations of particles larger than 25 nm are typically below 100 000 cm−3 (Dal Maso et al., 2005). Lower natural particle concentration may not promote the formation of aggregates, and therefore, it is uncertain if natural SOA par-ticles can be expected to be aspherical.
4.3 Depolarisation properties of theα-pinene SOA particles 10
We conducted a set of experiments with two different initial conditions. The primary experiments were started at low RH, so that the nucleated SOA particles grew in an amorphous solid or semi-solid state. In contrast to these runs, one reference run was made at−20◦C with a high initial RH (60–70 %), so that the SOA particles started out in the aqueous phase state. The purpose of this reference run was to validate the
de-15
polarisation method on a SOA system that would produce optically isotropic particles, and to exclude possible window artefacts. The SIMONE-Junior instrument is isolated from the chamber with two coated windows that do not change the depolarisation ra-tio itself, but if material condenses to form a film on the windows, this might affect the measurements.
20
Figures 4 and 5 show the measured depolarisation ratios of theα-pinene SOA parti-cles during the reference run and during RUN2_-10C. During all the low RH experimen-tal runs below 0◦C, a depolarisation ratio above LOD was measured, whereas during the reference run, the depolarisation signal stayed below the depolarisation threshold of 0.01 throughout the growth of the SOA particles. Based on this comparison, we can
25
ACPD
15, 28575–28617, 2015Observation of viscosity transition in
α-pinene secondary
organic aerosol
E. Järvinen et al.
Title Page
Abstract Introduction
Conclusions References
Tables Figures
◭ ◮
◭ ◮
Back Close
Full Screen / Esc
Printer-friendly Version Interactive Discussion
Discussion
P
a
per
|
Discussion
P
a
per
|
Discussion
P
a
per
|
Discussion
P
a
per
|
The measured linear depolarisation ratio averaged between 0.01 and 0.1, and the circular depolarisation ratio varied between 0.05 and 0.3 (Figs. 4, 5 and 8). The cir-cular depolarisation ratio was always higher than linear depolarisation ratio and both showed the same trend, i.e. both signals showed the oscillation maxima and minima at same locations. This is a common feature in depolarisation measurements, and has
5
been discussed in previous work by Mishchenko and Hovenier (1995). In theory, the circular depolarisation ratio is more sensitive to small changes; this sensitivity should provide advantages over linear depolarisation. However, in our case the LOD for cir-cular depolarisation ratio was a factor two higher than that for linear depolarisation ratio. Thus, for this instrument, circular depolarisation offered no clear advantage in our
10
measurements.
A depolarisation ratio that is above the LOD in these experiments suggests the pres-ence of aspherical particles. In this case the magnitude of the depolarisation signal depends on the size and shape of the particles. The increase in the depolarisation at the beginning of the runs can be linked with the growth in the particle size, as can be
15
expected from the T-matrix model (Fig. 2). A median particle diameter of 100 nm was sufficient to produce a depolarisation ratio above the detection threshold; the highest depolarisation ratio was measured for 600 nm particles (Fig. 4). The maximum linear depolarisation ratio varied between 0.05 and 0.1, which corresponds to an aspect ra-tio of 0.8 to 0.74 according to the T-matrix model for spheroidal particles. The good
20
agreement of the spheroidal model with our measurements support the hypothesised presence of SOA aggregates that grow quasi-spheroidal. Later in the experiments, condensational growth drives the particles to become increasingly spherical, which is also indicated by our measurements, as a slight decrease in the depolarisation ratio as the particle median diameter grew beyond 600 nm.
25
depolarisa-ACPD
15, 28575–28617, 2015Observation of viscosity transition in
α-pinene secondary
organic aerosol
E. Järvinen et al.
Title Page
Abstract Introduction
Conclusions References
Tables Figures
◭ ◮
◭ ◮
Back Close
Full Screen / Esc
Printer-friendly Version Interactive Discussion
Discussion
P
a
per
|
Discussion
P
a
per
|
Discussion
P
a
per
|
Discussion
P
a
per
tion signal. It should be possible to confirm this conclusion by simulating the scattering properties of the evolving spheroidal particles, but that is beyond the scope of this work and will be addressed in a future study.
As described in Sect. 3.1, secondary nucleation occurred in some of our experi-ments, resulting in a bimodal size distribution. Figure 9 shows such a run with two
5
growing modes. The main mode was somewhat wider than in the single-mode exper-iments, so we do not see clear oscillations in the depolarisation signal. A new narrow mode was nucleated after 15:00 UTC, causing oscillations in the depolarisation sig-nal, as the new mode grew. The measured depolarisation is, therefore, likely due to the net scattering and depolarisation contributions from both of these modes, making
10
the interpretation of the depolarisation properties more challenging. Although the size distribution is not confined to a single size in the bimodal runs, the phase of the new particles was viscous, since the mode was formed before a significant increase in RH. The asphericity of the new mode is also observed in the oscillations that are caused by the newly nucleated narrow mode.
15
4.4 The atomic oxygen to carbon ratio of theα-pinene SOA
The atomic oxygen to carbon (O/C) ratio of SOA particles increases with particle age-ing and is related to the hygroscopicity of the particles (Massoli et al., 2010; Duplissy et al., 2011; Lambe et al., 2011). The O/C ratio affects the particle hardness; in the case of α-pinene SOA particles, the hardness increases with increasing O/C ratio
20
(Berkemeier et al., 2014). This might affect the particle shape and refractive index vari-ation inside the particle, as higher hardness increases the possibility that the particles remain aspherical and thus induce higher depolarisation signal.
We measured the O/C ratio using the HR-ToF-AMS (Aiken et al., 2007, 2008). The measured O/C ratios varied from 0.23 to 0.29 with an average value of 0.25±0.04
25
ACPD
15, 28575–28617, 2015Observation of viscosity transition in
α-pinene secondary
organic aerosol
E. Järvinen et al.
Title Page
Abstract Introduction
Conclusions References
Tables Figures
◭ ◮
◭ ◮
Back Close
Full Screen / Esc
Printer-friendly Version Interactive Discussion
Discussion
P
a
per
|
Discussion
P
a
per
|
Discussion
P
a
per
|
Discussion
P
a
per
|
The SOA mass concentration shows a steep increase at the beginning of RUN2_-10C due to the continuous addition of ozone and alpha-pinene to the chamber. At 15:35 UTC the SOA production rate decreased slightly as the fresh supply of ozone was reduced. After switching offthe ozone supply at 20:20 UTC the formation of SOA was stopped and as a result the SOA concentration decreased due to dilution.
5
4.5 Measured viscosity-transition-RH as a function of temperature
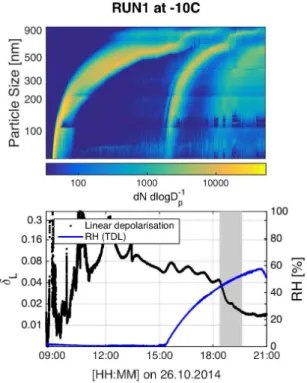
The depolarisation signal in our experiments showed that the viscousα-pinene SOA particles were non-spherical when the nucleation and growth of the particles occurred at low RH. As the RH increases, the highly viscous SOA particles start to take up water. The water uptake is slow, and proceeds gradually with increasing RH (Mikhailov
10
et al., 2009; Zobrist et al., 2011). This is seen by the relatively slow shape transitions observed as the RH increases (Figs. 4 and 5). In the aqueous phase, the surface area is minimised to reach an energetically favourable state. The minimisation of the surface area results in shape change from aspherical to spherical. This change was observed in the depolarisation ratio at the end of the low-RH runs, as the depolarisation ratio
15
decreased towards the instrument LOD. We determined the transition RH range from the measurements; the start of the transition was detected when the depolarisation ratio started to decrease significantly. The end of the transition was detected when the depolarisation ratio reached a constant level below the detection threshold (highlighted with grey in Figs. 4, 9, 8). The RH value at the time the depolarisation had decreased
20
to a constant, zero level, describes the transition to an optically spherical shape. We label this RH value the viscosity-transition RH.
Figure 11 summarises the complete RH range, where the viscosity transition were observed for sub-zero temperatures. At 10◦C a depolarization signal over LOD was not observe, suggesting that the particles were already in a liquid state at 12 % RH.
25
Generally, two results can be obtained from Fig. 11:
ACPD
15, 28575–28617, 2015Observation of viscosity transition in
α-pinene secondary
organic aerosol
E. Järvinen et al.
Title Page
Abstract Introduction
Conclusions References
Tables Figures
◭ ◮
◭ ◮
Back Close
Full Screen / Esc
Printer-friendly Version Interactive Discussion
Discussion
P
a
per
|
Discussion
P
a
per
|
Discussion
P
a
per
|
Discussion
P
a
per
2. the RH range, where the transition occurs becomes wider as the temperature decreases.
The viscosity-transition RH has near linear dependency of the temperature. At
−10◦C the viscosity-transition occurred at RH around 35 % and at−38◦C the transition was observed at around 80 % RH. Result (ii) can be linked to the transition timescales,
5
so that at colder temperatures the transition from a solid or semi-solid to liquid will last longer.
The viscosity-transition RH of the SOA particles does not directly provide the glass transition RH, RHg, since the viscosity transition occurs near the full deliquescence rel-ative humidity (FDRH), and the glass transition occurs when the relaxation timescales
10
match the experimental timescale. The delay between the RHgand the FDRH is
gov-erned by the competition between the humidification rate and timescale for water dif-fusion within the particle bulk (Berkemeier et al., 2014). We can expect that the vis-cosity transition is shifted to somewhat higher RH than the actual RHgwould be. Also
it should be noted that the RHg describes a change in the phase or state of a
ma-15
terial at a constant composition, i.e., in a closed system. Our experiments probe the change as composition changes and this likely leads to a continuous variation in the RHg. However, the advantage of our setup is that both the particle size and rate of change of RH, correspond roughly to those found in the atmosphere. Moreover, the transition timescales that we observed, 10 s of minutes, are relevant to those that we
20
can expect in the atmosphere. Consequently, the viscosity transition RH that we report is relevant for the atmospheric processes and, therefore, can be compared to RHg in
an atmospheric context.
We compared our results with the Koop et al. (2011) generic SOA estimate that predicts the glass transition temperature as a function of RH for a broad variety of SOA
25
ACPD
15, 28575–28617, 2015Observation of viscosity transition in
α-pinene secondary
organic aerosol
E. Järvinen et al.
Title Page
Abstract Introduction
Conclusions References
Tables Figures
◭ ◮
◭ ◮
Back Close
Full Screen / Esc
Printer-friendly Version Interactive Discussion
Discussion
P
a
per
|
Discussion
P
a
per
|
Discussion
P
a
per
|
Discussion
P
a
per
|
transition might take place at a much higher temperature (around 220 K) than predicted in Koop et al. (2011).
Our method to detect the viscosity-transition of viscous SOA is likely limited to lab-oratory experiments with high number concentrations promoting the formation of non-spherical SOA particle aggregates. Though our limited data do not support the
hy-5
pothesis that SOA particles in the lower troposphere might be non-spherical, we have demonstrated the first non-invasive method to study the viscosity of the SOA parti-cles. Moreover, we observe the viscosity changes on a timescale that is relevant to the atmosphere. This method can be extended to other SOA types and temperature regimes. The present study focused on understanding the humidity effect on the
vis-10
cosity transition temperature of a single SOA component. The method could also be used in future studies to determine the influence of oxidation level or mixing ratio of the SOA precursor to the transition temperature.
4.6 Atmospheric implications
Atmospheric conditions where SOA is found cover the full range of RH (e.g. Hamed
15
et al., 2011). The observed near-linear dependence of the viscosity transition temper-ature on RH is important for the low tempertemper-atures; our results imply that SOA particles may remain viscous in the upper troposphere up to very high RH, where previous studies have suggested that they might relax already at lower RH (Koop et al., 2011). Moreover, the long time required for the phase transition suggest that, even though the
20
particles may temporarily be exposed to high RH, they could remain in a viscous state. Hence, this kind of SOA particles may be able to act as IN, especially in the cirrus regime. The IN activity of the sameα-pinene SOA particles produced for the present study has been investigated in a parallel study (Ignatius, 2015) using a portable IN counter. They found that, at temperatures below or at the homogeneous freezing limit,
25
ACPD
15, 28575–28617, 2015Observation of viscosity transition in
α-pinene secondary
organic aerosol
E. Järvinen et al.
Title Page
Abstract Introduction
Conclusions References
Tables Figures
◭ ◮
◭ ◮
Back Close
Full Screen / Esc
Printer-friendly Version Interactive Discussion
Discussion
P
a
per
|
Discussion
P
a
per
|
Discussion
P
a
per
|
Discussion
P
a
per
above the homogeneous freezing threshold, but, to better understand the phase state of SOA in the cirrus regime, future studies at lower temperatures are needed.
5 Conclusions
The influence of temperature and relative humidity on the viscosity transition of SOA particles is a subject of considerable uncertainty (Koop et al., 2011). Here, we
mea-5
sured the viscosity transition RH at different atmospherically-relevant temperatures us-ing a new optical and non-invasive in-situ method. We used near-backscatterus-ing de-polarisation to measure the asphericity of the SOA particles and the shape change to spherical at near the full deliquescence relative humidity. The relaxation timescales were observed to be 10 s of minutes – time scales relevant for atmospheric processes.
10
Thus, we conclude that the viscosity transition RH provides a quantity that is directly relevant for glassy transitions of SOA particles in the atmosphere.
We showed thatα-pinene SOA particles acquire a non-spherical shape due to coag-ulation in our chamber experiments. The non-spherical shape persists when the par-ticles are nucleated and grown under low RH. This non-spherical shape is a result of
15
the viscosity of the particles and this viscous state can be detected with depolarisation measurements for SOA particles larger than 100 nm.
We observed the viscosity transition in six experiments conducted at at four temper-atures. We found that the viscosity transition temperature depends linearly on RH. This increases the likelihood thatα-pinene SOA particles persist in a viscous state at low
20
temperatures, making them potential ice nuclei (IN) in the cirrus cloud regime. Gener-ally, our results improve the understanding of the viscosity transition temperature RH at temperatures above the homogeneous freezing point. The influence of highly viscous SOA on climate should be further assessed in future modelling studies.
Acknowledgements. We would like to thank CERN for supporting CLOUD with important
25
Sev-ACPD
15, 28575–28617, 2015Observation of viscosity transition in
α-pinene secondary
organic aerosol
E. Järvinen et al.
Title Page
Abstract Introduction
Conclusions References
Tables Figures
◭ ◮
◭ ◮
Back Close
Full Screen / Esc
Printer-friendly Version Interactive Discussion
Discussion
P
a
per
|
Discussion
P
a
per
|
Discussion
P
a
per
|
Discussion
P
a
per
|
enth Framework Programme of the European Union (Marie Curie-Networks for Initial Training MC-ITN CLOUD-TRAIN no. 316 662), from Swiss National Science Foundation (SNSF) grant number 200021_140663, from US National Science Foundation Grants AGS-1447056 and AGS-1439551, from Dreyfus Award EP-11-117, from German Federal Ministry of Education and Research BMBF (project no. 01LK1222A and B), from the Davidow Foundation, and from
5
the funding of the German Federal Ministry of Education and Research (BMBF) through the CLOUD12 project.
The article processing charges for this open-access publication were covered by a Research Centre of the Helmholtz Association.
10
References
Adler, G., Koop, T., Haspel, C., Taraniuk, I., Moise, T., Koren, I., Heiblum, R. H., and Rudich, Y.: Formation of highly porous aerosol particles by atmospheric freeze-drying in ice clouds, P. Natl. Acad. Sci. USA, 110, 20414–20419, doi:10.1073/pnas.1317209110, 2013. 28579 Aiken, A. C., DeCarlo, P. F., and Jimenez, J. L.: Elemental analysis of organic species with
15
electron ionization high-resolution mass spectrometry, Anal. Chem., 79, 8350–8358, 2007. 28593
Aiken, A. C., Decarlo, P. F., Kroll, J. H., Worsnop, D. R., Huffman, J. A., Docherty, K. S., Ul-brich, I. M., Mohr, C., Kimmel, J. R., Sueper, D., Sun, Y., Zhang, Q., Trimborn, A., Northway, M., Ziemann, P. J., Canagaratna, M. R., Onasch, T. B., Alfarra, M. R., Prevot, A. S. H.,
Dom-20
men, J., Duplissy, J., Metzger, A., Baltensperger, U., and Jimenez, J. L.: O/C and OM/OC ratios of primary, secondary, and ambient organic aerosols with high-resolution time-of-flight aerosol mass spectrometry, Environ. Sci. Technol., 42, 4478–4485, 2008. 28593
Bateman, A. P., Belassein, H., and Martin, S. T.: Impactor apparatus for the study of particle rebound: Relative humidity and capillary forces, Aerosol Sci. Tech., 48, 42–52, 2014. 28579
25
ACPD
15, 28575–28617, 2015Observation of viscosity transition in
α-pinene secondary
organic aerosol
E. Järvinen et al.
Title Page
Abstract Introduction
Conclusions References
Tables Figures
◭ ◮
◭ ◮
Back Close
Full Screen / Esc
Printer-friendly Version Interactive Discussion
Discussion
P
a
per
|
Discussion
P
a
per
|
Discussion
P
a
per
|
Discussion
P
a
per
Dal Maso, M., Kulmala, M., Riipinen, I., Wagner, R., Hussein, T., Aalto, P. P., and Lehtinen, K. E.: Formation and growth of fresh atmospheric aerosols: eight years of aerosol size distribution data from SMEAR II, Hyytiala, Finland, Boreal Environ. Res., 10, 323–336, 2005. 28591 Dlugach, J. M. and Mishchenko, M. I.: Scattering properties of heterogeneous mineral particles
with absorbing inclusions, J. Quant. Spectrosc. Ra., 162, 89–94, 2015. 28581
5
Duplissy, J., DeCarlo, P. F., Dommen, J., Alfarra, M. R., Metzger, A., Barmpadimos, I., Pre-vot, A. S. H., Weingartner, E., Tritscher, T., Gysel, M., Aiken, A. C., Jimenez, J. L., Cana-garatna, M. R., Worsnop, D. R., Collins, D. R., Tomlinson, J., and Baltensperger, U.: Relating hygroscopicity and composition of organic aerosol particulate matter, Atmos. Chem. Phys., 11, 1155–1165, doi:10.5194/acp-11-1155-2011, 2011. 28593
10
Duplissy, J., Merikanto, J., Franchin, A., Tsagkogeorgas, G., Kangasluoma, J., Wimmer, D., Vuollekoski, H., Schobesberger, S., Lehtipalo, K., Flagan, R., Brus, D., Donahue, N. M., Vehkämäki, H., Almeida, J., Amorim, A., Barmet, P., Bianchi, F., Breitenlechner, M., Dunne, E. M., Guida, R., Henschel, H., Junninen, H., Kirkby, J., Kürten, A., Kupc, A., Määttänen, A., Makhmutov, V., Mathot, S., Nieminen, T., Onnela, A., Praplan, A. P., Riccobono, F., Rondo,
15
L., Steiner, G., Tome, A., Walther, H., Baltensperger, U., Carslaw, K. S., Dommen, J., Hansel, A., Petäjä, T., Sipilä, M., Stratmann, F., Vrtala, A., Wagner, P. E., Worsnop, D. R., Curtius, J., and Kulmala, M.: Effect of ions on sulfuric acid-water binary particle formation II: Exper-imental data and comparison with QC-normalized classical nucleation theory, J. Geophys. Res.-Atmos., 120, doi:10.1002/2015JD023539, 2015. 28584
20
Fahey, D. W., Gao, R.-S., Möhler, O., Saathoff, H., Schiller, C., Ebert, V., Krämer, M., Peter, T., Amarouche, N., Avallone, L. M., Bauer, R., Bozóki, Z., Christensen, L. E., Davis, S. M., Durry, G., Dyroff, C., Herman, R. L., Hunsmann, S., Khaykin, S. M., Mackrodt, P., Meyer, J., Smith, J. B., Spelten, N., Troy, R. F., Vömel, H., Wagner, S., and Wienhold, F. G.: The AquaVIT-1 intercomparison of atmospheric water vapor measurement techniques, Atmos.
25
Meas. Tech., 7, 3177–3213, doi:10.5194/amt-7-3177-2014, 2014. 28586
Guenther, A., Hewitt, C. N., Erickson, D., Fall, R., Geron, C., Graedel, T., Harley, P., Klinger, L., Lerdau, M., McKay, W., Pierce, T., Scholes, B., Steinbrecher, R., Tallamraju, R., Taylor, J., and Zimmerman, P.: A global model of natural volatile organic compound emissions, J. Geophys. Res.-Atmos., 100, 8873–8892, 1995. 28577
30
Maen-ACPD
15, 28575–28617, 2015Observation of viscosity transition in
α-pinene secondary
organic aerosol
E. Järvinen et al.
Title Page
Abstract Introduction
Conclusions References
Tables Figures
◭ ◮
◭ ◮
Back Close
Full Screen / Esc
Printer-friendly Version Interactive Discussion
Discussion
P
a
per
|
Discussion
P
a
per
|
Discussion
P
a
per
|
Discussion
P
a
per
|
haut, W., McFiggans, G., Mentel, Th. F., Monod, A., Prévôt, A. S. H., Seinfeld, J. H., Sur-ratt, J. D., Szmigielski, R., and Wildt, J.: The formation, properties and impact of sec-ondary organic aerosol: current and emerging issues, Atmos. Chem. Phys., 9, 5155–5236, doi:10.5194/acp-9-5155-2009, 2009. 28577, 28578
Hamed, A., Korhonen, H., Sihto, S.-L., Joutsensaari, J., Järvinen, H., Petäjä, T., Arnold, F.,
5
Nieminen, T., Kulmala, M., Smith, J. N., Lehtinen, K. E. J., and Laaksonen, A.: The role of relative humidity in continental new particle formation, J. Geophys. Res.-Atmos., 116, D03202, doi:10.1029/2010JD014186, 2011. 28596
Hirsikko, A., O’Connor, E. J., Komppula, M., Korhonen, K., Pfüller, A., Giannakaki, E., Wood, C. R., Bauer-Pfundstein, M., Poikonen, A., Karppinen, T., Lonka, H., Kurri, M.,
10
Heinonen, J., Moisseev, D., Asmi, E., Aaltonen, V., Nordbo, A., Rodriguez, E., Lihavainen, H., Laaksonen, A., Lehtinen, K. E. J., Laurila, T., Petäjä, T., Kulmala, M., and Viisanen, Y.: Ob-serving wind, aerosol particles, cloud and precipitation: Finland’s new ground-based remote-sensing network, Atmos. Meas. Tech., 7, 1351–1375, doi:10.5194/amt-7-1351-2014, 2014. 28587
15
Hoyle, C. R., Boy, M., Donahue, N. M., Fry, J. L., Glasius, M., Guenther, A., Hallar, A. G., HuffHartz, K., Petters, M. D., Petäjä, T., Rosenoern, T., and Sullivan, A. P.: A review of the anthropogenic influence on biogenic secondary organic aerosol, Atmos. Chem. Phys., 11, 321–343, doi:10.5194/acp-11-321-2011, 2011. 28578
Huang, R.-J., Zhang, Y., Bozzetti, C., Ho, K.-F., Cao, J.-J., Han, Y., Daellenbach, K. R.,
20
Slowik, J. G., Platt, S. M., Canonaco, F., Zotter, P., Wolf, R., Pieber, S. M., Bruns, E. A., Crippa, M., Ciarelli, G., Piazzalunga, A., Schwikowski, M., Abbaszade, G., Schnelle-Kreis, J., Zimmermann, R., An, Z., Szidat, S., Baltensperger, U., El Haddad, I., and Prévôt, A. S. H.: High secondary aerosol contribution to particulate pollution during haze events in China, Nature, 514, 218–222, 2014. 28578
25
Ignatius, K.: Heterogeneous ice nucleation of viscous secondary organic aerosol produced from ozonolysis of alpha-pinene, Atmos. Chem. Phys. Discuss., in preparation, 2015. 28596 Jimenez, J. L., Canagaratna, M. R., Donahue, N. M., Prevot, A. S. H., Zhang, Q., Kroll, J. H., DeCarlo, P. F., Allan, J. D., Coe, H., Ng, N. L., Aiken, A. C., Docherty, K. S., Ulbrich, I. M., Grieshop, A. P., Robinson, A. L., Duplissy, J., Smith, J. D., Wilson, K. R., Lanz, V. A.,
30