www.atmos-chem-phys.net/17/77/2017/ doi:10.5194/acp-17-77-2017
© Author(s) 2017. CC Attribution 3.0 License.
Modeling biogenic and anthropogenic secondary organic aerosol
in China
Jianlin Hu1, Peng Wang2, Qi Ying1,2, Hongliang Zhang3, Jianjun Chen4, Xinlei Ge1, Xinghua Li5, Jingkun Jiang6, Shuxiao Wang6, Jie Zhang7,9, Yu Zhao8,9, and Yingyi Zhang10
1Jiangsu Key Laboratory of Atmospheric Environment Monitoring and Pollution Control, Jiangsu Engineering Technology Research Center of Environmental Cleaning Materials, Jiangsu Collaborative Innovation Center of Atmospheric Environment and Equipment Technology, School of Environmental Science and Engineering, Nanjing University of Information Science & Technology, 219 Ningliu Road, Nanjing 210044, China
2Zachry Department of Civil Engineering, Texas A&M University, College Station, TX 77843-3136, USA 3Department of Civil and Environmental Engineering, Louisiana State University, Baton Rouge, LA 77803, USA
4Air Quality Planning and Science Division, California Air Resources Board, 1001 I Street, Sacramento, CA 95814, USA 5School of Space & Environment, Beihang University, Beijing, 100191, China
6State Key Joint Laboratory of Environment Simulation and Pollution Control, School of Environment, Tsinghua University, Beijing 100084, China
7Jiangsu Provincial Academy of Environmental Science, 176 North Jiangdong Rd., Nanjing, Jiangsu 210036, China 8State Key Laboratory of Pollution Control & Resource Reuse and School of the Environment, Nanjing University, 163 Xianlin Ave., Nanjing, Jiangsu 210023, China
9Jiangsu Collaborative Innovation Center of Atmospheric Environment and Equipment Technology, Nanjing, Jiangsu 210044, China
10School of Environment and Energy, South China University of Technology, Guangzhou, China
Correspondence to:Qi Ying (qying@civil.tamu.edu)
Received: 29 July 2016 – Published in Atmos. Chem. Phys. Discuss.: 8 August 2016 Revised: 15 November 2016 – Accepted: 30 November 2016 – Published: 3 January 2017
Abstract. A revised Community Multi-scale Air Quality (CMAQ) model with updated secondary organic aerosol (SOA) yields and a more detailed description of SOA forma-tion from isoprene oxidaforma-tion was applied to study the spa-tial and temporal distribution of SOA in China in the en-tire year of 2013. Predicted organic carbon (OC), elemen-tal carbon and volatile organic compounds agreed favor-ably with observations at several urban areas, although the high OC concentrations in wintertime in Beijing were under-predicted. Predicted summer SOA was generally higher (10– 15 µg m−3) due to large contributions of isoprene (country average, 61 %), although the relative importance varies in different regions. Winter SOA was slightly lower and was mostly due to emissions of alkane and aromatic compounds (51 %). Contributions of monoterpene SOA was relatively constant (8–10 %). Overall, biogenic SOA accounted for ap-proximately 75 % of total SOA in summer, 50–60 % in
1 Introduction
Fast economic development and rapid industrialization and urbanization in the past several decades not only significantly increased the level of air pollution in China but also lead to higher aerosol loadings in the downwind regions. A signifi-cant fraction of the aerosols is made up of organic carbona-ceous material (Sun et al., 2014). Globally, organic aerosols (OA) from both biogenic and anthropogenic sources play a significant role in affecting global climate by directly scat-tering and absorbing solar radiation and indirectly by alter-ing cloud and rain formation processes. It was estimated that China contributed to approximately 16 % of global organic aerosol loading in 2000 (Saikawa et al., 2009; Tsigaridis et al., 2005), and its contributions are likely higher nowadays due to increased air pollution levels in recent years. Dur-ing severe haze events, it was found that secondary organic aerosol (SOA), which is formed in the atmosphere from gas-to-particle conversion of primary precursor volatile organic compounds (VOCs), could account for a significant fraction of the total observed organic aerosol (Huang et al., 2014a; Carlton et al., 2009; Tsigaridis and Kanakidou, 2003).
To better quantify the impacts of SOA on human health and climate and to design more efficient control strategies for improving air quality in China, improved understanding of SOA is urgently needed, including its precursors, forma-tion processes and physicochemical properties. While a large amount of experimental work, both in the field (Boström et al., 2002; Aramandla et al., 2011) and in the laboratory (Lai et al., 2016), has been carried out in recent years, only a small number of modeling analyses of SOA in China have been reported. In order to determine the contributions of SOA to total organic carbon (OC) burden in China, receptor-oriented analysis with specific SOA tracers (Akagi et al., 2011), or statistical analysis with minimal elemental-carbon-to-OC (EC/OC) ratio (Peng et al., 2013; Wang et al., 2015), have been attempted. Recently, advanced techniques such as the positive matrix factorization analysis of organic aerosol data from aerosol mass spectrometers have also been applied to determine the amount of SOA and its precursors (Huang et al., 2014b; Sun et al., 2014; Wang et al., 2016)
Mechanistic modeling analyses of SOA formation in China were seldom reported in the literature until the last 5 years or so. The complexity of the models ranges from relatively simple box models (Ciccioli et al., 2014) to full-blown 3-D Eulerian models (Hellén et al., 2012; Setyan et al., 2012; Jiang et al., 2012; B. Li et al., 2015; Zhao et al., 2016). Most of the studies focused on the Pearl River Delta (PRD) region in southern China (Ciccioli et al., 2014; B. Li et al., 2015; Setyan et al., 2012) and eastern China (Hellén et al., 2012) and were for short time periods. While computa-tionally intensive, a full-year simulation with a fully coupled meteorology–chemistry model for the entire Chinese region was also attempted (Jiang et al., 2012).
The SOA modules used in these studies applied the rel-atively simple traditional two-product approach (Ciccioli et al., 2014) or the more complex volatility basis set (VBS) approach to better represent multi-generation oxidation of SOA precursors in the gas phase and their aging processes in the aerosol phase (Hellén et al., 2012). The two-product approach has been shown in many previous studies to under-predict SOA. While the VBS approach and many of its vari-ants have been shown to predict higher SOA concentrations, a recent study showed that the VBS parameters adjusted to fit individual SOA precursors in photochemical chamber ex-periments cannot produce satisfying results for simulating chamber experiments with mixed precursors (Zhao et al., 2015). In addition, both two-product and VBS approaches as-sume equilibrium partitioning of semivolatile products; how-ever, recent studies revealed that reactions on particle sur-faces or with particle water under acidic conditions of certain compounds, such as dicarbonyls (e.g. glyoxal) and epoxy-diols from isoprene, lead to rapid formation of low volatile oligomers, organosulfates and organonitrates (George et al., 2015). The heterogeneous SOA formation pathway from aqueous uptake of glyoxal (GLY) has been studied for the PRD region, and it was found that including glyoxal surface uptake leads to higher isoprene SOA (iSOA) fraction (B. Li et al., 2015).
Isoprene epoxydiols (IEPOX) and methacrylic acid epox-ide (MAE) formed from isoprene oxidation under low and high-NOx conditions (Lin et al., 2013; Surratt et al., 2010),
respectively, have been reported to form low-volatile or-ganic products in aerosol water under strong acidic condi-tions (Karambelas et al., 2014; Pye et al., 2013). Some of the recent SOA modeling studies included more detailed treat-ment of isoprene oxidation in the gas phase and updated SOA modules by using either a surface-controlled uptake ap-proach (J. Li et al., 2015; Ying et al., 2015) or a more mech-anistic approach for the aqueous reactions (Pye et al., 2013). It was found that IEPOX accounted for as much as 34 % of the total iSOA in summer (Ying et al., 2015). Most of these modeling studies were for North America, and whether these processes are important to SOA formation in China remains unclear.
the contributions of anthropogenic and biogenic sources to SOA loading throughout the country.
2 Method
2.1 Model description
The Community Multiscale Air Quality (CMAQ) model (v5.0.1), developed by the United States Environmental Pro-tection Agency (US EPA), with an updated gas-phase photo-chemical mechanism and a revised SOA module, was applied in this study. A complete description of the SOA module was described in greater detail in Ying et al. (2015), and a short summary is provided below. The CMAQ model was also up-dated to include heterogeneous reactions of NO2and SO2on particle surface to form secondary nitrate and sulfate (Ying et al., 2014).
The gas-phase photochemical mechanism applied in this study is based on the SAPRC11 (S11) photochemical mech-anism (Carter and Heo, 2012), an update of the widely used SAPRC07 (S07) mechanism. The S11 mechanism was fur-ther modified to include a more detailed isoprene oxidation scheme to predict the formation of IEPOX and MAE, as orig-inally described by Xie et al. (2013) and Lin et al. (2013). In addition, this modified S11 mechanism was designed to track GLY and methylglyoxal (MGLY) from six major groups of precursors using a tagged-species approach. The six groups of precursors are (1) aromatics with OH reaction rates less than 2×10⁴ppm−1min−1(ARO1), (2) aromatics with OH reaction rates greater than 2×10⁴ppm−1min−1 (ARO2), (3) isoprene (ISOP), (4) monoterpenes (TERP), (5) sesquiter-penes (SESQ) and (6) primary emissions of GLY and MGLY. Two major SOA formation pathways were included in the SOA module. The first is the equilibrium partitioning of semivolatile products from oxidation of long-chain alkanes (ALK5), ARO1, ARO2, ISOP, TERP and SESQ, and subse-quent formation of nonvolatile oligomers based on the tra-ditional two-product approach as implemented in version 6 of the aerosol module in CMAQ (AERO6). Oligomers from different precursors were also treated using the precursor-tagging approach so that a complete analysis of precursor contributions to SOA could be conducted. In this study, the SOA mass yields were updated from the ones used in Ying et al. (2014, 2015) to account for vapor wall loss during chamber experiments based on data provided by Zhang et al. (2014). The original and updated mass yields are listed in Table 1. No changes of the saturation concentrations (C∗)
of the products were made, even though the mass yields were updated. This partial correction only represents an up-per bound estimation of the wall-loss effect. It should also be noted that while the correction factors proposed Zhang et al. (2014) for aromatic compounds by were based on the same chamber experiments that the CMAQ yields were based on, the correction factors for alpha-pinene and isoprene
re-ported by Zhang et al. (2014) were based on a different set of chamber experiments than were used to derive the yields used in CMAQ. This could lead to additional uncertainties in the yields used in this study. The second SOA formation pathway in the model is the surface-controlled irreversible reactive uptake of GLY, MGLY, IEPOX and MAE. Uptake coefficients (γ )for GLY and MGLY were fixed at 2.9×10⁻³, taken from Fu et al. (2008), and an acidity-dependent uptake coefficient for IEPOX and MAE was based on the param-eterization described by J. Li et al. (2015). The treatment of GLY and MGLY SOA formation as an irreversible pro-cess provided an upper-limit estimation of SOA formation from these two precursors, as it was reported that reactive uptake of GLY and MGLY can be reversible (Galloway et al., 2009) and dissolved GLY and MGLY can react with ox-idants to form products with volatile products (Lim et al., 2010). The resultingγisoepoxin the summertime (June, July and August) in this study are approximately 4–10×10−4in most areas (see Fig. S1 in the Supplement). These γisoepox values are in the range mentioned by Pye et al. (2013), which were based on more mechanistic calculations. The isoprene SOA yields in the CMAQ model were taken from Kroll et al. (2006), whose study was conducted under dry conditions (RH < 10 %). Thus, the yields derived from the experiments do not include contributions from reactive surface uptake, which only occurs on wet particles.
2.2 Model application
The modified CMAQ model was applied to simulate sur-face concentrations and determine precursor contributions to SOA in China for the entire year of 2013. The model domain covers China and surrounding areas in eastern and South-east Asia, with a horizontal resolution of 36 km (see Fig. 1). The meteorology inputs needed to drive the air quality sim-ulations were generated by the Weather Research and Fore-casting (WRF) model v3.6.1 using the NCEP FNL (National Centers for Environmental Prediction Final) Operational Model Global Tropospheric Analyses dataset for boundary and initial conditions. The anthropogenic emissions in China were based on the Multi-resolution Emission Inventory for China (MEIC, v1.0) (http://www.meicmodel.org) with a res-olution of 0.25◦×
0.25◦
In-Table 1.Updated aerosol mass yields used in this study that account for the wall-loss using scaling factors based on Zhang et al. (2014). Saturation concentrations (C∗) for each product were also listed.
Updated Originalc
α1 α2 α1 α2 C∗
1 C
∗ 2
ALK 0.0865 – 0.0865 – 0.02 –
ARO1a 0.2545 0.7623 0.2253 0.6764 8.024 119.3166
ARO2b 0.2545 0.7653 0.2253 0.6764 8.024 119.3166
TERP 0.1811 0.5905 0.1393 0.4542 14.792 133.7297
ISOP 0.0634 0.5104 0.0288 0.232 0.617 116.01
SQT 1.537 – 1.537 – 24.984 –
ak
OH< 2×10⁴ppm−1min−1.bk
OH≥2×10⁴ppm−1min−1.cAs used in Ying et al. (2015).
Figure 1. Location of major cities (Beijing, Nanjing, Shanghai, Chengdu and Guangzhou) mentioned in this study.
line processing was used to generate dust and sea salt sions during CMAQ simulations. More details of the emis-sion processing and meteorology model result evaluation can be found in J. Hu et al. (2016).
3 Results
3.1 Model evaluation
The capability of the model to predict ozone and PM2.5 mass concentrations has already been evaluated by compar-ison with observations at 60 major urban areas, and it is described in much greater detail in J. Hu et al. (2016). In summary, model performance of ozone (1 h peak and 8 h av-erage) and PM2.5 mass concentrations (daily average) were considered generally within the model performance criteria recommended by the US EPA. Model performance is gener-ally better in the more economicgener-ally developed regions such as the Yangtze River Delta (YRD) and North China Plain (NCP) because of more accurate emission inventories than
the less developed regions such as the northwest. Nonethe-less, as ozone and a significant portion of the PM2.5mass are formed from photochemical reactions of the precursors, the general capability of the model to reproduce these species suggests that the oxidation capability of the atmosphere and precursor concentrations essential for SOA predictions were reasonably predicted – even though the SOA formation pro-cesses are much more complex and less understood.
In this section, predicted concentrations of several VOCs, as well as OC and EC (elemental carbon), are compared with observations available during this period to provide more supporting evidence for the SOA estimations.
3.1.1 Volatile organic compounds
Predicted hourly concentrations of lumped primary VOCs (ARO1, ARO2 and ALK5) and ISOP, which act as SOA precursors in the S11 mechanism are compared with obser-vations made at the Nanjing University of Information Sci-ence and Technology (NUIST) in August 2013 and shown in Fig. 2. The VOC monitoring site is located on the rooftop of the science building on campus of NUIST (33.205◦
N, 118.727◦
oxida-Figure 2.Predicted and observed August VOC concentrations in Nanjing. Observed concentrations are based on individual VOCs lumped into the SAPRC-11 model species. Shaded areas represent the range of predictions in the nine grid cells with the monitor site at the center. Units are ppb.
tion of a number of VOCs and their oxidation products (such as MACR and MVK), are also included in the evaluation. The predicted concentrations at the grid cell where the mon-itor is located are used to compare with observations. To il-lustrate the spatial variability of the VOC species, the ranges of the VOC concentrations in the nine grid cells, with the monitor site at the center, are also shown in the comparison.
As shown in Fig. 2, predicted anthropogenic primary emit-ted species (ETHE, OLE1, OLE2, ARO1, ARO2 and ALK5) have large spatial variations. This indicates that their emis-sions are likely much higher in urban areas but significantly lower in rural areas. Day-to-day variations of these species are generally well captured. For example, the decrease of ETHE as well as other primary species during 20–24 August and the subsequent rapid increase on 25 August are correctly predicted. This day-to-day variation is due to changes in the meteorological conditions. Emissions remain constant in the same month except for the weekday and weekend variations, and other factors that cause day-to-day variations of emis-sions (such as plume rise) within the same month were not considered. Observed OLE2 concentrations show erratically high concentrations during 20–22 August, which are likely due to impact of local emissions near the sampling site. For ARO1 and ARO2, the two major SOA precursors, predicted concentrations at the sampling site are slightly lower than
ob-servations (mean fractional bias, MFB= −0.63 and−0.77, respectively). ALK5 concentrations are lower than aromatic compounds and show both over- and under-predictions, with an overall MFB of−0.05 and a mean fractional error (MFE) of 0.69. Since the olefin species are important in affecting the oxidation capacity of the atmosphere, the general agree-ment between model predictions and observations suggests that the initial oxidation rate of the SOA precursors can be reasonably predicted at this location.
Predicted isoprene concentrations show distinct day-to-day variations, with higher concentrations (up to approxi-mately 8 ppb at peak hours) in the first half of August and lower in the second half (up to 1–2 ppb in the afternoon). The predicted high concentration peaks are sharp and usually last for 1–2 h only. Observed isoprene concentrations do not show significant day-to-day variations, with peak-hour con-centration of approximately 2 ppb throughout the month. As isoprene is a short-lived species under typical daytime urban atmospheric conditions, the predicted high concentrations could not be due to regional transport for the large grid cell size used in this study. Variations in the predicted day-to-day concentrations must be due to isoprene emissions estimated by the MEGAN model. A previous study indicated that the MEGAN model might have overestimated the amount of iso-prene emission vegetation in the urban areas due to incorrect vegetation types and fractions and leaf area index (Kota et al., 2015). However, a few other studies suggested that a sig-nificant portion of the observed isoprene was not from live vegetation but from other sources such as vehicles in urban areas (Hellén et al., 2012; McLaren et al., 1996; Borbon et al., 2001). More detailed analyses are needed to determine what trigged the rapid increase in the predicted emissions of isoprene in the afternoon.
Oxidation products of isoprene, MACR and MVK, show better agreement between predictions and observations (MFB= −0.14 and−0.35 and MFE=0.68 and 0.74, respec-tively). Observed concentrations of these species are higher in the first half of the month, which can cast some doubt on the isoprene measurements. However, these species are much longer lived than isoprene; therefore, transport from high-isoprene-emission regions can contribute to the higher observed concentrations. In the second half of the month, regional emissions of isoprene decreased due to changed weather conditions, and thus reduce the amount of MACR and MVK transported to the urban grid cell where the mon-itor was located. In summary, good agreement of these two species with observations provides a good starting point for iSOA predictions.
11 August was observed. However, VOC observations were not available because of an equipment problem on 10 and 11 August, making it impossible to evaluate if these pre-dicted peaks actually occurred or not. Although this evalu-ation of VOC species is only for a single locevalu-ation in a single month due to limited observation data available during the studying period, it provides support for the VOC emissions and chemistry, at least in this region, being reasonably repre-sented by the modeling system.
3.1.2 Elemental and organic carbon
Predicted EC and OC concentrations are also compared with observations, as shown in Fig. 3. EC and OC measurements are available at several locations: two locations in Beijing (on the campuses of Tsinghua University, Cao et al., 2014, and Beihang University, Wang et al., 2015; January and March 2013), one in Nanjing (Jiangsu Provincial Academy of Envi-ronmental Science, B. Li et al., 2015; December 2013), and one in Guangzhou (Tianhu, January and February 2013; Lai et al., 2016). As shown in Fig. 1, Nanjing is located in east-ern China near the YRD, approximately 1000 km to the south of Beijing. Guangzhou is a megacity located in southeastern China near Hong Kong. These three cities represent very dif-ferent climate and emission conditions and likely have differ-ent SOA formation pathways. Daily average concdiffer-entrations were measured with different sampling intervals.
Figure 3a and b show predicted and observed OC concen-trations in Beijing in January 2013, the month characterized by several high-PM pollution episodes that covered large parts of the country. The Tsinghua and Beihang campuses are 3 km apart and are located in the same model grid cell. Ob-servation data are available at the Tsinghua site only during 8–14 January and are very similar to the observed concen-trations at the Beihang site. The close agreement of the two sets of measurements during high-OC days suggests that the high concentrations (as high as 60–80 µg m−3)are not due to local sources very close to monitors but likely to a regional phenomenon. EC predictions agree well with observations (Fig. 2b; MFB=0.23 and MFE=0.48). While the model predictions of OC generally agree with the observations for day-to-day variations (MFB= −0.36, MFE=0.53), they are significantly lower than observations on high-concentration days, except the last pollution episode in the last week of Jan-uary. The good agreement of EC even on high-pollution days suggests that primary emissions and meteorological fields are accurate enough and are not the major cause of OC under-prediction. Therefore, the OC under-prediction is more likely due to under-prediction of SOA from anthropogenic sources during high-pollution days.
Figure 3c and d show that day-to-day variations in the OC and EC concentrations in Beijing during March 2013 are also well captured (MFB= −0.59 and −0.17 and MFE=0.61 and 0.42). Spatial variations of the OC concentrations are much smaller than those in January since primary emissions
Figure 3.Predicted and observed concentrations of total organic carbon (OC, left column) and elemental carbon (EC, right column) in several different cities. BH: Beihang University campus; TH: Ts-inghua University campus; Nanjing: Jiangsu Provincial Academy of Environmental Science; Guangzhou: Tianhu (rural site). Shaded areas represent the range of predictions in the nine grid cells with the monitor site at the center. Units are µg m−3.
and MFE=0.33 and 0.48, respectively), it is hard to con-clude whether the day-to-day variations are correctly cap-tured since observations were made every 6 days.
In summary, available OC and EC observations in winter and spring in three major cities suggest that emissions of EC, and thus possibly emissions of primary OC (POC), are well estimated. POC provides the medium for the partitioning of SVOCs formed from oxidation of the precursors, and cor-rectly predicting POC is necessary for corcor-rectly predicting SOA concentrations. There are also indications that SOA is likely under-predicted, especially during the high-pollution days in winter in Beijing. While it has been suggested that VOCs with intermediate volatility (IVOCs) might also con-tribute to under-predictions of SOA (Zhao et al., 2016), miss-ing other SOA precursors such as polycyclic aromatic hy-drocarbons (PAHs) (Zhang and Ying, 2012) could also con-tribute to the OC under-prediction. Both field observations and detailed modeling studies are needed to close the gap between predicted and observed SOA concentrations.
3.2 Regional distribution of SOA 3.2.1 Mass concentrations of SOA
Figure 4 shows predicted seasonal average SOA concen-trations in (a) spring (March, April and May), (b) summer (June, July and August), (c) autumn (September, October and November), and (d) winter (December, January and Febru-ary) of 2013. In spring, predicted SOA concentrations peak in Southeast Asia, which is associated with a larger amount of open burning emissions, as well as higher temperature and stronger solar radiation that enhance the photochemical pro-duction of SOA. Increase of POA could lead to additional gas-to-particle partitioning, but as shown in Sect. 3.2.2, this high SOA is mainly associated with isoprene oxidation prod-ucts. Some SOA is transported to southwestern China by the southeastern monsoon, which contributes to high SOA concentrations (∼20 µg m−3)in the Yunnan and part of the Guangxi provinces. These high-SOA regions are ideal for further studies to better understand the impact of large-scale open burning on SOA and air quality. Relatively high SOA concentrations are also predicted in other southern provinces and in the Sichuan Basin, with seasonal average concentra-tions reaching ∼10 µg m−3. Predicted SOA concentrations are low in the north and northeast provinces. As indicated in Fig. S3a, SOA accounts for approximately 20–50 % of OA in the majority of the areas where SOA concentrations are high. In summer, SOA concentrations are generally more than 5 µg m−3 in a large portion of the populated areas in cen-tral and eastern China. Cencen-tral provinces, such as Jiangsu, Henan, Shandong and the southern part of the Hebei in the NCP have concentrations of up to 10–15 µg m−3. This shift of high-SOA regions from southeastern to central China is accompanied by a change in the average surface wind direc-tion from erratic wind in spring to generally southerly wind
Figure 4. Predicted monthly average SOA concentrations in (a)spring (March, April and May),(b)summer (June, July and Au-gust),(c)fall (September, October and November), and(d)winter (December, January and February) 2013. Units are µg m−3. Over-lain on the panels are seasonal average wind vectors.
in summer. Figure S3b shows that SOA is the major form of OA in summer, accounting for approximately 50–70 % of the OA in the densely populated areas, which is consistent with the findings in a few field measurement studies (W. Hu et al., 2016; Huang et al., 2013), and more than 80 % in most other areas.
contribution to total OA is approximately 30 %, and the high-est SOA concentration in China is in the Sichuan Basin with an annual average concentration of 10–12 µg m−3.
3.2.2 SOA from traditional and reactive surface uptake pathways
Figure 5 shows the predicted seasonal average concentrations of SOA components, which represent SOA formation from different pathways: equilibrium partitioning of semivolatile SOA (SEMI), oligomerization of the condensed semivolatile SOA (OLGM), and surface irreversible uptake of IEPOX, MAE, GLY and MGLY. The SEMI and OLGM pathways are considered traditional because they are included in the default CMAQ aerosol module AERO6. The SEMI contri-butions to SOA were on the order of 2 µg m−3 and did not vary significantly in different seasons. The spatial distribu-tion of the SEMI components generally follows the same distribution as the total SOA but shows more spatial hetero-geneity, with higher concentrations near the source regions. This is because the primary precursors generally become ox-idized relatively quickly after they are emitted. In the current SOA module, oxidation of primary precursors leads to im-mediate formation of two semivolatile products, which then partition to the particle phase assuming instant equilibrium. SOA aging is not considered. In contrast, the OLGM com-ponents have wider and smoother spatial distribution, as they are formed slowly from the SEMI components. In the current parameterization, the SEMI components turn into OLGM following a first-order reaction with a half-life of 20 h. The contributions of OLGM to total SOA are higher in spring and winter (∼27 %, see Table 2) and lower in summer and autumn (21–23 %), even though the relative contributions of the SEMI components to total SOA remain relatively con-stant (∼20 %) in all seasons. This is likely due to more effi-cient removal such as wet deposition in the warmer months. Overall, the traditional pathways account for 43–47 % of the total SOA. This is higher than summer SOA simulations for the eastern US, where SOA from the traditional pathways is approximately 16 % because the contribution of isoprene to total SOA is much higher (Ying et al., 2015).
Contribution of MAE to total SOA is negligible (< 1 %). It is known that MAE is typically formed under high-NOx
conditions, but isoprene emission is generally high in rural and remote areas where NOxemissions are low. Even though
transport might occasionally mix urban plumes with suffi-cient isoprene, creating a high-NOxenvironment locally, this
did not occur frequently enough to make significant contri-butions. SOA from IEPOX shows clear spatial and temporal distributions. IEPOX is predicted to be a major contributor to iSOA, with contributions of∼13–14 % in spring and lower contributions in autumn (∼9 %) and winter (∼5 %), aver-aged over the entire country. In some downwind regions, the contributions of IEPOX are much higher. GLY and MGLY have contributions from both primary emissions and
sec-Figure 5.Predicted seasonal average SOA component concentra-tions in(a)spring,(b)summer,(c)autumn and(d) winter 2011. Units are µg m−3. SEMI: semivolatile SOA; OLGM: oligomers; IEPOX: SOA from isoprene epoxide; MAE: SOA from methacrylic acid epoxide; GLY: SOA from glyoxal; MGLY: SOA from methyl-glyoxal.
Table 2.Predicted seasonal average component contributions (%) to SOA. SEMI: semivolatile isoprene SOA; OLGM: oligomers; IEPOX: SOA from isoprene epoxide; MAE: SOA from methacrylic acid epoxide; GLY: SOA from glyoxal; MGLY: SOA from methyl-glyoxal.
Spring Summer Autumn Winter
SEMI 19.8 % 22.0 % 22.1 % 20.6 %
OLGM 26.7 % 20.8 % 22.7 % 26.8 %
IEPOX 13.3 % 14.3 % 8.6 % 4.5 %
MAE 0.7 % 0.8 % 0.6 % 0.3 %
GLY 14.4 % 14.2 % 19.4 % 24.5 %
MGLY 25.1 % 28.0 % 26.7 % 23.3 %
resi-dential heating, suggesting the importance of anthropogenic GLY emissions in China.
3.2.3 SOA from different precursors
Figure 6 shows the predicted contributions to seasonal av-erage SOA concentrations due to different types of precur-sor species: aromatic compounds (ARO=ARO1+ARO2), ALK5, isoprene, TERP, SESQ, and primary glyoxal and methylglyoxal ([M]GLY=GLY+MGLY). In spring, iso-prene is the largest contributor to total SOA, and it explains most of the spatial distribution of SOA shown in Fig. 4a. The peak contributions of 4–5 µg m−3occur in the Sichuan Basin and southern China. Figure 4a indicates that some border provinces experienced cross-border transport of SOA from neighboring countries. Isoprene SOA in these near-border re-gions are as high as 10 µg m−3. While it has been reported that large amounts of isoprene and other biogenic VOCs can be emitted from biomass burning (Ciccioli et al., 2014), the emission factors of isoprene vary significantly for different burning activities and fuel types (Akagi et al., 2011). Thus, the large amount of isoprene SOA predicted from open burn-ing in this region needs to be confirmed by additional exper-imental studies to quantify the sources, by detailed analysis of SOA tracer compounds, for example. Averaged over the entire region in China, isoprene contributes to approximately 48 % of the total SOA in spring (see Table 3), and TERP con-tributes to 10 % (∼2 µg m−3). TERP contributions are also confined in the forested regions in southern China. ARO ac-counts for 21 % of the total SOA in spring, and its spatial dis-tribution is much wider, contributing a relatively uniformed concentration of approximately 2 µg m−3throughout central, eastern, southern and southeastern China.
Isoprene SOA also dominates the total SOA predicted in summer, with the highest concentrations in the Sichuan Basin. High-iSOA regions cover the NCP, the three provinces in the northeast and some provinces in east and central China. County-average contributions of iSOA account for 61 % of total SOA. Relative contribution of isoprene to total SOA is shown in Fig. S5b. Most of the areas in central China and the NCP do not have significant emissions of isoprene. With southerly summer wind, significant regional transport of iSOA from southern China contributes to the PM2.5mass loading in the downwind central China and NCP areas. In contrast, SOA from TERP and SESQ does not show as much regional transport and is generally located in southeastern China where their emissions are highest (see Figs. S5c and d, S3). This is because GLY and MGLY from TERP and SESQ are much lower than from isoprene. Detailed analy-sis of different formation pathways to iSOA is discussed in Sect. 4.2. Together with contributions from TERP (10 %) and SESQ (4 %), the estimated contribution of biogenic SOA to total SOA in summer is approximately 75 %. Increases in the summer solar radiation and temperature facilitates the bio-genic emissions. Absolute contribution of ARO to SOA in
Figure 6. Predicted seasonal average SOA concentrations due to contributions from different precursors in(a) spring (March, April and May),(b)summer (June, July and August),(c)autumn (September, October and November), and(d) winter (December, January and February) 2013. Units are µg m−3. ARO: aromat-ics; ALK: alkane; ISOP: isoprene; TERP: monoterpenes; SESQ: sesquiterpenes; [M]GLY: primary glyoxal+methylglyoxal.
summer is approximately 2 µg m−3 in the NCP, similar to that in spring. The high fractional contribution of ARO to SOA (∼25 %) is in the coastal regions in east China where the ARO emissions are high. However, the country-average relative contribution of ARO to total SOA decreases from 21 % in spring to 14 % in summer, due to significant increase in biogenic SOA,
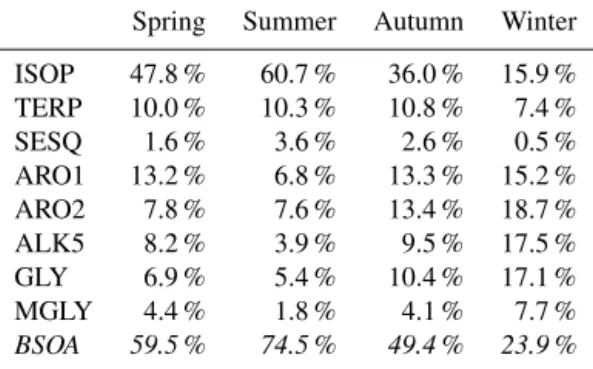
Table 3. Predicted seasonal average precursor contributions (%) to SOA. ISOP: isoprene; TERP: monoterpenes; SESQ: sesquiterpenes; ARO1 and ARO2: aromatic compounds; ALK5: long-chain alkanes; GLY: primary glyoxal; MGLY: primary methylglyoxal; and BSOA: SOA due to biogenic emissions (ISOP+TERP+SESQ; in italic).
Spring Summer Autumn Winter
ISOP 47.8 % 60.7 % 36.0 % 15.9 %
TERP 10.0 % 10.3 % 10.8 % 7.4 %
SESQ 1.6 % 3.6 % 2.6 % 0.5 %
ARO1 13.2 % 6.8 % 13.3 % 15.2 %
ARO2 7.8 % 7.6 % 13.4 % 18.7 %
ALK5 8.2 % 3.9 % 9.5 % 17.5 %
GLY 6.9 % 5.4 % 10.4 % 17.1 %
MGLY 4.4 % 1.8 % 4.1 % 7.7 %
BSOA 59.5 % 74.5 % 49.4 % 23.9 %
seasons. As GLY and MGLY form SOA directly through ir-reversible surface uptake reactions, and there are always suf-ficient particles in the polluted atmosphere, this suggests that once the SOA are formed on particles, they are not trans-ported over long distances as effectively as gas precursors and their intermediate oxidation products. The timescale of the gas-phase multistep oxidation reactions can greatly affect long-range transport and thus spatial distribution of SOA. Residential sources are the sole important contributor to total primary GLY and MGLY emissions in China (see Fig. S6). The large contributions of primary GLY and MGLY to SOA formation were not found in the previous study in the eastern US since residential emissions were not significant (Ying et al., 2015).
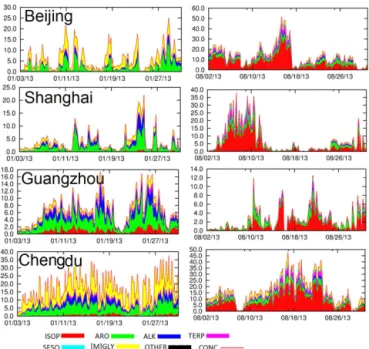
3.3 Time series in different cities
Figure 6 illustrates the time series of SOA in January and August of 2013 at four cities, i.e., Beijing in the NCP, Shang-hai in the YRD, Guangzhou in the PRD and Chengdu in the Sichuan Basin. The four cities are located in the four most economically developed regions and have quite differ-ent emissions and meteorological conditions. In all cities, summer (August) SOA concentrations are higher than win-ter SOA concentrations (January). Chengdu has experienced the highest SOA concentrations among the four cities both in winter and summer, with the highest hourly concentrations of 35 and 50 µg m−3 in January and August, respectively. Peak hourly SOA concentrations in other cities in January are approximately 20 µg m−3. In August, SOA concentrations in Shanghai and Beijing could reach approximately 40 µg m−3. Aromatic compounds are important in winter, with contribu-tions of as much as 10 µg m−3on high-SOA days in all cities. Primary GLY and MGLY are also important in winter, espe-cially in Chengdu. In summer, isoprene is the most important
precursor of SOA in all cities. However, the contributions of ALK, ARO and [M]GLY are not negligible.
4 Discussion
4.1 SOA from primary and secondary glyoxal and methylglyoxal
4.2 Isoprene SOA formation pathways
Analyses in Sect. 3 show that contribution of isoprene to total SOA is high in spring and summer. A more detailed analy-sis of the iSOA was conducted to reveal the contributions of components from different pathways to the predicted sum-mer iSOA concentrations, as shown in Fig. 8. Averaged over the entire country, SEMI and OLGM components account for only 27 % of the predicted iSOA. The rest of the iSOA is due to GLY (10 %), MGLY (35 %), IEPOX (27 %) and MAE (1 %). Spatial distributions of these components are shown in Fig. 7b–e. The SEMI component is high in the Sichuan Basin and central and eastern China, close to the forest regions of southern China with high isoprene emissions. The other com-ponents show a generally similar spatial pattern with high concentrations in the Sichuan Basin, NCP, and YRD regions.
4.3 Sensitivity of predicted SOA to isoprene–NOx–VOC emission changes
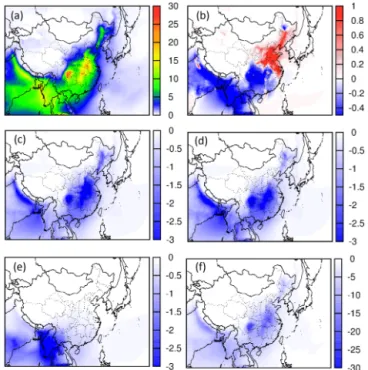
The formation of SOA is affected by both biogenic and an-thropogenic emissions. To evaluate the changes in SOA con-centrations with respect to changes in anthropogenic and bio-genic emissions, multiple sensitivity simulations for SOA in January and August 2013 were conducted, as summarized in Table 4. The 50 % reduction in NOxemissions and 25 %
reduction in VOC emissions used in simulations 2–4 repre-sent a rough estimation of the emission reduction target for the year 2020 based on data from Chatani et al. (2014) for a stringent emission control scenario. In simulation 5, bio-genic emissions were reduced by 50 %, while anthropobio-genic emissions remained unchanged, as some studies showed that the MEGAN model might overestimate biogenic emissions (Carlton and Baker, 2011). This was used to evaluate the sen-sitivity of SOA predictions for biogenic emissions. Recently, studies of biogenic SOA in the southeastern United States suggested that SOA from isoprene could be enhanced by an-thropogenic emissions; thus, reducing anan-thropogenic emis-sions might have extra benefit in reducing both biogenic and anthropogenic SOA (Carlton et al., 2010). Simulation 6 was designed to test the magnitude of this interaction in China by removing all anthropogenic emissions.
Figures 9b and 10b show that reducing NOx emissions
alone by 50 % would result in both an increase and decrease in predicted SOA. In both seasons, a decrease of SOA by ap-proximately 1 µg m−3occurs in the south and in the Sichuan Basin, while an increase in SOA of 1–2 µg m−3occurs in the Beijing–Tianjin–Hebei (BTH) and YRD regions. However, the causes of the changes are different. Analysis of the SOA components in August showed that the increase of SOA in the domain is mostly due to an increase in the SOA from the IEPOX pathway (Fig. S7). The decrease of SOA is mostly due to reduction in the SOA from GLY and MGLY, which are mainly because of reduction of GLY and MGLY from isoprene (compare Figs. S7 and S8). In January, the increase
Figure 7.Predicted time series of SOA concentrations (secondary
yaxis, units are µg m−3)and fractional contributions to SOA due to different precursors at four cities (Beijing, Shanghai, Guangzhou and Chengdu) in January and August 2013. Units are µg m−3. ARO: aromatics; ISOP: isoprene; TERP: monoterpene; SESQ: sesquiter-pene; [M]GLY: glyoxal+methylglyoxal directly emitted or from other precursors; OTHER: boundary conditions.
Figure 8.Predicted fractional component contributions to summer isoprene SOA in China(a)and spatial distributions of iSOA from the traditional(b, c)and surface uptake(d, e)pathways. Units are µg m−3for panels(b–d).
and decrease in the SOA are due to changes in the SOA from ARO and ALK5 (Fig. S9d, e). SOA from primary GLY and MGLY (Fig. S9f) also showed similar spatial patterns. In the current mechanism, ARO, ALK5 and GLY–MGLY only re-act with OH to form semivolatile SOA and oligomers. The results suggested that the spatial pattern change of SOA in winter due to NOxis likely due to an increase in the OH
con-centrations associated with NOx reduction in the high-NOx
emission regions. Increase in SOA also occurs in regions downwind of the megacities due to regional transport, even though these downwind regions may not be NOx-saturated
Table 4.Settings for sensitivity simulations.
Simulation Abbreviation Notes
1 Base Base case simulation, all biogenic and anthropogenic emissions at 100 %
2 0.5NOx Anthropogenic NOxreduced by 50 %
3 0.75VOC Anthropogenic VOC reduced by 25 %
4 NV Anthropogenic NOxand VOC reduced by 50 and 25 %, respectively
5 0.5ISOP Biogenic isoprene emissions reduced by 50 %
6 BIO Biogenic emissions at 100 %, no anthropogenic emissions*
∗All gas and particulate emissions were excluded, not only NO
xand VOC emissions.
Figure 9.Predicted(a)spatial distribution of SOA for August 2013 and change of SOA concentrations (sensitivity case – base case) due to (b)reduction of anthropogenic NOx by 50 %,(c)reduction of anthropogenic VOC by 25 %,(d)simultaneous reduction of anthro-pogenic NOxand VOC by 50 and 25 %,(e)reduction of biogenic isoprene by 50 %, and(f)reduction of all anthropogenic emissions.
As shown in Fig. 9c, reducing anthropogenic VOC emis-sions by 25 % in August resulted in a decrease of SOA throughout the domain by 1–1.4 µg m−3, or a relative change of approximately 10 %. In January, 25 % reduction of VOCs led to an approximately 20 % reduction of the predicted SOA concentrations, or up to 3 µg m−3 (Fig. 10c). This higher amount of reduction is expected because most of the SOA in winter is due to anthropogenic emissions. Figure 8d shows that simultaneous reduction of NOx and VOC in August is
more effective in reducing SOA concentrations than NOxor
VOC emission reduction alone. However, Fig. 9d shows that in January reducing both led to slightly less SOA reduction than reducing VOC alone. As shown in Fig. 9e, decreasing isoprene by 50 % resulted in a decrease of total SOA by
Figure 10.Same as Fig. 8, but for January 2013.
as much as 4 µg m−3 (or 35 %) in August. Analysis of the SOA components shows that both iSOA and SOA from other precursors are decreased. This result highlights that the ac-curacy of the estimation of the biogenic isoprene and other biogenic VOCs can greatly affect the model predictions of iSOA. Given the high sensitivity of predicted SOA and iSOA to isoprene emissions, more studies should be carried out to evaluate, constrain and refine biogenic emission estimations in China.
Removing all anthropogenic emissions while keeping the biogenic emissions unchanged (including soil NOx) leads to
at-mosphere (i.e. lower OH during the day and NO3 radical at night), which leads to slower formation of semivolatile components and oligomers as well as lower acidity of the aerosols that reduce the uptake coefficient of IEPOX and thus SOA. Nonetheless, the results from sensitivity simula-tion 6 clearly demonstrate that human-related emissions are responsible for almost all SOA. Dividing the SOA concentra-tions into biogenic and anthropogenic porconcentra-tions by the carbon source alone will erroneously underestimate the impact of manmade emissions on aerosol loadings (Setyan et al., 2012, 2014).
5 Conclusions
In China, predicted SOA concentrations are generally higher in summer (10–15 µg m−3)due to large contributions of iso-prene (country average, 61 %) and lower in wintertime due to emissions of alkane and aromatic compounds (51 %). Over-all, 75 % of total SOA in summer, 50–60 % in autumn and spring, and approximately 24 % in winter are due to bio-genic SOA. The highest SOA in mainland China occurs in the Sichuan Basin in all seasons, with hourly concentrations as high as 50 µg m−3. Regarding the SOA formation path-ways, approximately half of the SOA in all seasons is due to the traditional equilibrium partitioning of semivolatile com-ponents followed by oligomerization, while the remaining is mainly due to reactive surface uptake of isoprene epoxide (IEPOX, 5–14 %), glyoxal (GLY, 14–25 %) and methylgly-oxal (MGLY, 23–28 %). Manmade emissions facilitate bio-genic SOA formation, and controlling anthropobio-genic emis-sions would result in reduction of both anthropogenic and biogenic SOA. It should be noted that the reported SOA con-centrations in this study have not been compared with direct measurements of SOA. More detailed measurements of or-ganic components within the aerosol phase, such as the oxi-dation state measurements from aerosol mass spectrometers (AMS) (W. Hu et al., 2016) and tracer species representing SOA formation from precursor species (Yang et al., 2016), are becoming available in many areas in China. Future local-scale SOA modeling studies can be conducted to better uti-lize these data as constraints on model parameters and input data.
6 Data availability
Data used in this manuscript can be provided upon re-quest by email to the corresponding author Qi Ying (qy-ing@civil.tamu.edu).
The Supplement related to this article is available online at doi:10.5194/acp-17-77-2017-supplement.
Acknowledgements. The authors Jianlin Hu, Xinlei Ge and Xinghua Li would like to thank the National Natural Science Foundation of China (91544220 and 41275121), Natural Science Foundation of Jiangsu Province (BK20150904 and BK20151041), Jiangsu Specially Appointed Professor Project (2191071503201), and the Priority Academic Program Development of Jiangsu Higher Education Institutions (PAPD), and Jiangsu Province Innovation Platform for Superiority Subject of Environmental Science and Engineering (No. KHK1201) for their support. The authors also want to acknowledge the Texas A&M Supercomputing Facility (http://sc.tamu.edu/) for providing computing resources useful in conducting the research reported in this paper.
Edited by: D. Topping
Reviewed by: two anonymous referees
References
Akagi, S. K., Yokelson, R. J., Wiedinmyer, C., Alvarado, M. J., Reid, J. S., Karl, T., Crounse, J. D., and Wennberg, P. O.: Emis-sion factors for open and domestic biomass burning for use in atmospheric models, Atmos. Chem. Phys., 11, 4039–4072, doi:10.5194/acp-11-4039-2011, 2011.
Aramandla, R., Anthony, E. A., Darryl, B. H., Zhongmao, G., and Bommanna, G. L.: Global Environmental Distribution and Hu-man Health Effects of Polycyclic Aromatic Hydrocarbons, in: Global Contamination Trends of Persistent Organic Chemicals, CRC Press, 97–126, doi:10.1201/b11098-7, 2011.
Borbon, A., Fontaine, H., Veillerot, M., Locoge, N., Galloo, J. C., and Guillermo, R.: An investigation into the traffic-related frac-tion of isoprene at an urban locafrac-tion, Atmos. Environ., 35, 3749– 3760, doi:10.1016/S1352-2310(01)00170-4, 2001.
Boström, C.-E., Gerde, P., Hanberg, A., Jernström, B., Johansson, C., Kyrklund, T., Rannug, A., Törnqvist, M., Victorin, K., and Westerholm, R.: Cancer risk assessment, indicators, and guide-lines for polycyclic aromatic hydrocarbons in the ambient air, Environ. Health Persp., 110, 451–488, 2002.
Cao, C., Jiang, W., Wang, B., Fang, J., Lang, J., Tian, G., Jiang, J., and Zhu, T. F.: Inhalable Microorganisms in Beijing’s PM2.5 and PM10Pollutants during a Severe Smog Event, Environ. Sci. Technol., 48, 1499–1507, doi:10.1021/es4048472, 2014. Carlton, A. G. and Baker, K. R.: Photochemical Modeling of the
Ozark Isoprene Volcano: MEGAN, BEIS, and Their Impacts on Air Quality Predictions, Environ. Sci. Technol., 45, 4438–4445, doi:10.1021/es200050x, 2011.
Carlton, A. G., Wiedinmyer, C., and Kroll, J. H.: A review of Sec-ondary Organic Aerosol (SOA) formation from isoprene, At-mos. Chem. Phys., 9, 4987–5005, doi:10.5194/acp-9-4987-2009, 2009.
Carlton, A. G., Pinder, R. W., Bhave, P. V., and Pouliot, G. A.: To What Extent Can Biogenic SOA be Controlled?, Environ. Sci. Technol., 44, 3376–3380, doi:10.1021/es903506b, 2010. Carter, W. P. L. and Heo, G.: Development of revised SAPRC
Chatani, S., Amann, M., Goel, A., Hao, J., Klimont, Z., Kumar, A., Mishra, A., Sharma, S., Wang, S. X., Wang, Y. X., and Zhao, B.: Photochemical roles of rapid economic growth and potential abatement strategies on tropospheric ozone over South and East Asia in 2030, Atmos. Chem. Phys., 14, 9259–9277, doi:10.5194/acp-14-9259-2014, 2014.
Ciccioli, P., Centritto, M., and Loreto, F.: Biogenic volatile organic compound emissions from vegetation fires, Plant Cell Environ., 37, 1810–1825, doi:10.1111/pce.12336, 2014.
Fu, T. M., Jacob, D. J., Wittrock, F., Burrows, J. P., Vrekous-sis, M., and Henze, D. K.: Global budgets of atmospheric gly-oxal and methylglygly-oxal, and implications for formation of sec-ondary organic aerosols, J. Geophys. Res.-Atmos., 113, D15303, doi:10.1029/2007JD009505, 2008.
Galloway, M. M., Chhabra, P. S., Chan, A. W. H., Surratt, J. D., Flagan, R. C., Seinfeld, J. H., and Keutsch, F. N.: Glyoxal up-take on ammonium sulphate seed aerosol: reaction products and reversibility of uptake under dark and irradiated conditions, At-mos. Chem. Phys., 9, 3331–3345, doi:10.5194/acp-9-3331-2009, 2009.
George, C., Ammann, M., D’Anna, B., Donaldson, D. J., and Nizkorodov, S. A.: Heterogeneous Photochemistry in the Atmo-sphere, Chem. Rev., 115, 4218–4258, doi:10.1021/cr500648z, 2015.
Hellén, H., Tykkä, T., and Hakola, H.: Importance of monoterpenes and isoprene in urban air in northern Europe, Atmos. Environ., 59, 59–66, doi:10.1016/j.atmosenv.2012.04.049, 2012.
Hu, J., Wu, L., Zheng, B., Zhang, Q., He, K., Chang, Q., Li, X., Yang, F., Ying, Q., and Zhang, H.: Source contributions and re-gional transport of primary particulate matter in China, Environ. Pollut., 207, 31–42, 2015.
Hu, J., Chen, J., Ying, Q., and Zhang, H.: One-year simulation of ozone and particulate matter in China using WRF/CMAQ modeling system, Atmos. Chem. Phys., 16, 10333–10350, doi:10.5194/acp-16-10333-2016, 2016.
Hu, W., Hu, M., Hu, W., Jimenez, J. L., Yuan, B., Chen, W., Wang, M., Wu, Y., Chen, C., Wang, Z., Peng, J., Zeng, L., and Shao, M.: Chemical composition, sources, and aging pro-cess of submicron aerosols in Beijing: Contrast between sum-mer and winter, J. Geophys. Res.-Atmos., 121, 1955–1977, doi:10.1002/2015jd024020, 2016.
Huang, R.-J., Zhang, Y., Bozzetti, C., Ho, K.-F., Cao, J.-J., Han, Y., Daellenbach, K. R., Slowik, J. G., Platt, S. M., and Canonaco, F.: High secondary aerosol contribution to particulate pollution during haze events in China, Nature, 514, 218–222, 2014a. Huang, R.-J., Zhang, Y., Bozzetti, C., Ho, K.-F., Cao, J.-J., Han, Y.,
Daellenbach, K. R., Slowik, J. G., Platt, S. M., Canonaco, F., Zot-ter, P., Wolf, R., Pieber, S. M., Bruns, E. A., Crippa, M., Ciarelli, G., Piazzalunga, A., Schwikowski, M., Abbaszade, G., Schnelle-Kreis, J., Zimmermann, R., An, Z., Szidat, S., Baltensperger, U., El Haddad, I., and Prevot, A. S. H.: High secondary aerosol con-tribution to particulate pollution during haze events in China, Na-ture, 514, 218–222, doi:10.1038/nature13774, 2014b.
Huang, X. F., Xue, L., Tian, X. D., Shao, W. W., Sun, T. L., Gong, Z. H., Ju, W. W., Jiang, B., Hu, M., and He, L. Y.: Highly time-resolved carbonaceous aerosol characteriza-tion in Yangtze River Delta of China: Composicharacteriza-tion, mixing state and secondary formation, Atmos. Environ., 64, 200–207, doi:10.1016/j.atmosenv.2012.09.059, 2013.
Jiang, F., Liu, Q., Huang, X. X., Wang, T. J., Zhuang, B. L., and Xie, M.: Regional modeling of secondary organic aerosol over China using WRF/Chem, J. Aerosol Sci., 43, 57–73, doi:10.1016/j.jaerosci.2011.09.003, 2012.
Karambelas, A., Pye, H. O. T., Budisulistiorini, S. H., Surratt, J. D., and Pinder, R. W.: Contribution of Isoprene Epoxy-diol to Urban Organic Aerosol: Evidence from Modeling and Measurements, Environ. Sci. Technol. Lett., 1, 278–283, doi:10.1021/ez5001353, 2014.
Kota, S. H., Schade, G. W., Estes, M., Boyer, D., and Ying, Q.: Evaluation of MEGAN Predicted Biogenic Isoprene Emissions at Urban Locations using a Source-Oriented Community Multi-scale Air Quality Model, Atmos. Environ., 110, 54–64, 2015. Kroll, J. H., Ng, N. L., Murphy, S. M., Flagan, R. C., and
Se-infeld, J. H.: Secondary Organic Aerosol Formation from Iso-prene Photooxidation, Environ. Sci. Technol., 40, 1869–1877, doi:10.1021/es0524301, 2006.
Kurokawa, J., Ohara, T., Morikawa, T., Hanayama, S., Janssens-Maenhout, G., Fukui, T., Kawashima, K., and Akimoto, H.: Emissions of air pollutants and greenhouse gases over Asian re-gions during 2000–2008: Regional Emission inventory in ASia (REAS) version 2, Atmos. Chem. Phys., 13, 11019–11058, doi:10.5194/acp-13-11019-2013, 2013.
Lai, S., Zhao, Y., Ding, A., Zhang, Y., Song, T., Zheng, J., Ho, K. F., Lee, S.-C., and Zhong, L.: Characterization of PM2.5 and the major chemical components during a 1-year campaign in rural Guangzhou, Southern China, Atmos. Res., 167, 208–215, doi:10.1016/j.atmosres.2015.08.007, 2016.
Li, B., Zhang, J., Zhao, Y., Yuan, S., Zhao, Q., Shen, G., and Wu, H.: Seasonal variation of urban carbonaceous aerosols in a typical city Nanjing in Yangtze River Delta, China, Atmos. Environ., 106, 223–231, doi:10.1016/j.atmosenv.2015.01.064, 2015. Li, J., Cleveland, M., Ziemba, L. D., Griffin, R. J., Barsanti, K. C.,
Pankow, J. F., and Ying, Q.: Modeling regional secondary organic aerosol using the Master Chemical Mechanism, Atmos. Environ., 102, 52–61, doi:10.1016/j.atmosenv.2014.11.054, 2015. Lim, Y. B., Tan, Y., Perri, M. J., Seitzinger, S. P., and Turpin,
B. J.: Aqueous chemistry and its role in secondary organic aerosol (SOA) formation, Atmos. Chem. Phys., 10, 10521– 10539, doi:10.5194/acp-10-10521-2010, 2010.
Lin, Y.-H., Zhang, H., Pye, H. O. T., Zhang, Z., Marth, W. J., Park, S., Arashiro, M., Cui, T., Budisulistiorini, S. H., Sexton, K. G., Vizuete, W., Xie, Y., Luecken, D. J., Piletic, I. R., Edney, E. O., Bartolotti, L. J., Gold, A., and Surratt, J. D.: Epoxide as a precursor to secondary organic aerosol formation from isoprene photooxidation in the presence of nitrogen oxides, P. Natl. Acad. Sci., 110, 6718–6723, doi:10.1073/pnas.1221150110, 2013. Liu, Z., Wang, Y., Vrekoussis, M., Richter, A., Wittrock, F.,
Burrows, J. P., Shao, M., Chang, C.-C., Liu, S.-C., Wang, H., and Chen, C.: Exploring the missing source of glyoxal (CHOCHO) over China, Geophys. Res. Lett., 39, L10812, doi:10.1029/2012GL051645, 2012.
Lonneman, W. A.: Overview of VOC measurement technology in the PAMS program [microform], Washington, D.C.: mental Protection Agency, EP 1.23/6:600/A-94/193, Environ-mental Protection Agency, Atmospheric Research and Exposure Assessment Lab, Research Triangle Park, NC, USA, 1994. Marais, E. A., Jacob, D. J., Jimenez, J. L., Campuzano-Jost, P.,
C. C., Fisher, J. A., Travis, K., Yu, K., Hanisco, T. F., Wolfe, G. M., Arkinson, H. L., Pye, H. O. T., Froyd, K. D., Liao, J., and McNeill, V. F.: Aqueous-phase mechanism for secondary or-ganic aerosol formation from isoprene: application to the south-east United States and co-benefit of SO2emission controls, At-mos. Chem. Phys., 16, 1603–1618, doi:10.5194/acp-16-1603-2016, 2016.
McLaren, R., Singleton, D. L., Lai, J. Y. K., Khouw, B., Singer, E., Wu, Z., and Niki, H.: A WMA International Specialty Confer-ence on Regional Photochemical Measurements and Modeling-Analysis of motor vehicle sources and their contribution to am-bient hydrocarbon distributions at urban sites in Toronto during the Southern Ontario oxidants study, Atmos. Environ., 30, 2219– 2232, doi:10.1016/1352-2310(95)00178-6, 1996.
Peng, J. L., Li, M., Zhang, P., Gong, S. Y., Zhong, M. A., Wu, M. H., Zheng, M., Chen, C. H., Wang, H. L., and Lou, S. R.: Investiga-tion of the sources and seasonal variaInvestiga-tions of secondary organic aerosols in PM2.5in Shanghai with organic tracers, Atmos. Env-iron., 79, 614–622, doi:10.1016/j.atmosenv.2013.07.022, 2013. Pye, H. O. T., Pinder, R. W., Piletic, I. R., Xie, Y., Capps, S. L.,
Lin, Y. H., Surratt, J. D., Zhang, Z. F., Gold, A., Luecken, D. J., Hutzell, W. T., Jaoui, M., Offenberg, J. H., Kleindienst, T. E., Lewandowski, M., and Edney, E. O.: Epoxide Pathways Im-prove Model Predictions of Isoprene Markers and Reveal Key Role of Acidity in Aerosol Formation, Environ. Sci. Technol., 47, 11056–11064, doi:10.1021/es402106h, 2013.
Saikawa, E., Naik, V., Horowitz, L. W., Liu, J., and Mauzerall, D. L.: Present and potential future contributions of sulfate, black and organic carbon aerosols from China to global air quality, prema-ture mortality and radiative forcing, Atmos. Environ., 43, 2814– 2822, 2009.
Setyan, A., Zhang, Q., Merkel, M., Knighton, W. B., Sun, Y., Song, C., Shilling, J. E., Onasch, T. B., Herndon, S. C., Worsnop, D. R., Fast, J. D., Zaveri, R. A., Berg, L. K., Wiedensohler, A., Flow-ers, B. A., Dubey, M. K., and Subramanian, R.: Characterization of submicron particles influenced by mixed biogenic and anthro-pogenic emissions using high-resolution aerosol mass spectrom-etry: results from CARES, Atmos. Chem. Phys., 12, 8131–8156, doi:10.5194/acp-12-8131-2012, 2012.
Setyan, A., Song, C., Merkel, M., Knighton, W. B., Onasch, T. B., Canagaratna, M. R., Worsnop, D. R., Wiedensohler, A., Shilling, J. E., and Zhang, Q.: Chemistry of new particle growth in mixed urban and biogenic emissions – insights from CARES, Atmos. Chem. Phys., 14, 6477–6494, doi:10.5194/acp-14-6477-2014, 2014.
Sun, Y., Jiang, Q., Wang, Z., Fu, P., Li, J., Yang, T., and Yin, Y.: In-vestigation of the sources and evolution processes of severe haze pollution in Beijing in January 2013, J. Geophys. Res.-Atmos., 119, 4380–4398, doi:10.1002/2014JD021641, 2014.
Sun, Y., Du, W., Fu, P., Wang, Q., Li, J., Ge, X., Zhang, Q., Zhu, C., Ren, L., Xu, W., Zhao, J., Han, T., Worsnop, D. R., and Wang, Z.: Primary and secondary aerosols in Beijing in winter: sources, variations and processes, Atmos. Chem. Phys., 16, 8309–8329, doi:10.5194/acp-16-8309-2016, 2016.
Surratt, J. D., Chan, A. W. H., Eddingsaas, N. C., Chan, M., Loza, C. L., Kwan, A. J., Hersey, S. P., Flagan, R. C., Wennberg, P. O., and Seinfeld, J. H.: Reactive intermediates revealed in secondary organic aerosol formation from isoprene, P. Natl. Acad. Sci., 107, 6640–6645, doi:10.1073/pnas.0911114107, 2010.
Tsigaridis, K. and Kanakidou, M.: Global modelling of secondary organic aerosol in the troposphere: a sensitivity analysis, At-mos. Chem. Phys., 3, 1849–1869, doi:10.5194/acp-3-1849-2003, 2003.
Tsigaridis, K., Lathière, J., Kanakidou, M., and Hauglustaine, D. A.: Naturally driven variability in the global secondary organic aerosol over a decade, Atmos. Chem. Phys., 5, 1891–1904, doi:10.5194/acp-5-1891-2005, 2005.
Wang, H. B., Tian, M., Li, X. H., Chang, Q., Cao, J. J., Yang, F. M., Ma, Y. L., and He, K. B.: Chemical Composition and Light Extinction Contribution of PM2.5in Urban Beijing for a 1-Year Period, Aerosol Air Qual. Res., 15, 2200–2211, doi:10.4209/aaqr.2015.04.0257, 2015.
Wang, J., Ge, X., Chen, Y., Shen, Y., Zhang, Q., Sun, Y., Xu, J., Ge, S., Yu, H., and Chen, M.: Highly time-resolved urban aerosol characteristics during springtime in Yangtze River Delta, China: insights from soot particle aerosol mass spectrometry, Atmos. Chem. Phys., 16, 9109–9127, doi:10.5194/acp-16-9109-2016, 2016.
Wiedinmyer, C., Akagi, S. K., Yokelson, R. J., Emmons, L. K., Al-Saadi, J. A., Orlando, J. J., and Soja, A. J.: The Fire INventory from NCAR (FINN): a high resolution global model to estimate the emissions from open burning, Geosci. Model Dev., 4, 625– 641, doi:10.5194/gmd-4-625-2011, 2011.
Xie, Y., Paulot, F., Carter, W. P. L., Nolte, C. G., Luecken, D. J., Hutzell, W. T., Wennberg, P. O., Cohen, R. C., and Pinder, R. W.: Understanding the impact of recent advances in isoprene pho-tooxidation on simulations of regional air quality, Atmos. Chem. Phys., 13, 8439–8455, doi:10.5194/acp-13-8439-2013, 2013. Xu, L., Guo, H., Boyd, C. M., Klein, M., Bougiatioti, A., Cerully, K.
M., Hite, J. R., Isaacman-VanWertz, G., Kreisberg, N. M., Knote, C., Olson, K., Koss, A., Goldstein, A. H., Hering, S. V., de Gouw, J., Baumann, K., Lee, S.-H., Nenes, A., Weber, R. J., and Ng, N. L.: Effects of anthropogenic emissions on aerosol formation from isoprene and monoterpenes in the southeastern United States, P. Natl. Acad. Sci., 112, 37–42, doi:10.1073/pnas.1417609112, 2014.
Yang, F., Kawamura, K., Chen, J., Ho, K., Lee, S., Gao, Y., Cui, L., Wang, T., and Fu, P.: Anthropogenic and biogenic organic compounds in summertime fine aerosols (PM2.5) in Beijing, China, Atmos. Environ., 124, 166–175, doi:10.1016/j.atmosenv.2015.08.095, 2016.
Ying, Q., Cureño, I. V., Chen, G., Ali, S., Zhang, H., Malloy, M., Bravo, H. A., and Sosa, R.: Impacts of Stabilized Criegee In-termediates, surface uptake processes and higher aromatic sec-ondary organic aerosol yields on predicted PM2.5concentrations in the Mexico City Metropolitan Zone, Atmos. Environ., 94, 438–447, doi:10.1016/j.atmosenv.2014.05.056, 2014.
Ying, Q., Li, J., and Kota, S. H.: Significant Contributions of Isoprene to Summertime Secondary Organic Aerosol in East-ern United States, Environ. Sci. Technol., 49, 7834–7842, doi:10.1021/acs.est.5b02514, 2015.
Zhang, H. and Ying, Q.: Secondary organic aerosol from polycyclic aromatic hydrocarbons in Southeast Texas, Atmos. Environ., 55, 279–287, doi:10.1016/j.atmosenv.2012.03.043, 2012.
sec-ondary organic aerosol, P. Natl. Acad. Sci., 111, 5802–5807, doi:10.1073/pnas.1404727111, 2014.
Zhao, B., Wang, S., Donahue, N. M., Chuang, W., Ruiz, L. H., Ng, N. L., Wang, Y., and Hao, J.: Evaluation of One-Dimensional and Two-One-Dimensional Volatility Basis Sets in Sim-ulating the Aging of Secondary Organic Aerosol with Smog-Chamber Experiments, Environ. Sci. Technol., 49, 2245–2254, doi:10.1021/es5048914, 2015.
Zhao, B., Wang, S., Donahue, N. M., Jathar, S. H., Huang, X., Wu, W., Hao, J., and Robinson, A. L.: Quantifying the effect of organic aerosol aging and intermediate-volatility emissions on regional-scale aerosol pollution in China, Sci. Rep., 6, 28815, doi:10.1038/srep28815, 2016.


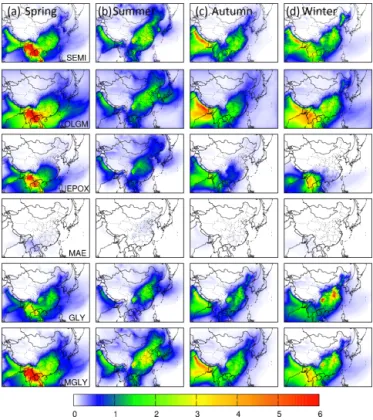
![Figure 6 shows the predicted contributions to seasonal av- av-erage SOA concentrations due to different types of precur-sor species: aromatic compounds (ARO = ARO1 + ARO2), ALK5, isoprene, TERP, SESQ, and primary glyoxal and methylglyoxal ([M]GLY = GLY +](https://thumb-eu.123doks.com/thumbv2/123dok_br/18141589.326501/9.918.474.847.101.516/predicted-contributions-seasonal-concentrations-different-aromatic-compounds-methylglyoxal.webp)