ACPD
7, 9925–9972, 2007Introducing the concept of Potential Aerosol Mass (PAM)
E. Kang et al.
Title Page
Abstract Introduction
Conclusions References
Tables Figures
◭ ◮
◭ ◮
Back Close
Full Screen / Esc
Printer-friendly Version
Interactive Discussion
EGU Atmos. Chem. Phys. Discuss., 7, 9925–9972, 2007
www.atmos-chem-phys-discuss.net/7/9925/2007/ © Author(s) 2007. This work is licensed
under a Creative Commons License.
Atmospheric Chemistry and Physics Discussions
Introducing the concept of Potential
Aerosol Mass (PAM)
E. Kang, M. J. Root, and W. H. Brune
Department of Meteorology, Pennsylvania State University, University Park, PA 16802, USA
Received: 5 June 2007 – Accepted: 25 June 2007 – Published: 9 July 2007
ACPD
7, 9925–9972, 2007Introducing the concept of Potential Aerosol Mass (PAM)
E. Kang et al.
Title Page
Abstract Introduction
Conclusions References
Tables Figures
◭ ◮
◭ ◮
Back Close
Full Screen / Esc
Printer-friendly Version
Interactive Discussion
EGU
Abstract
Potential Aerosol Mass (PAM) can be defined as the maximum aerosol mass that the oxidation of precursor gases produces. In the measurement, all precursor gases are rapidly oxidized with extreme amounts of oxidants to low volatility compounds, result-ing in the aerosol formation. Oxidation occurs in a small, simple, flow-through chamber 5
that has a short residence time and is irradiated with ultraviolet light. The amount of the oxidants ozone (O3), hydroxyl (OH), and hydroperoxyl (HO2) were measured directly and can be controlled by varying the UV light and the relative humidity. Max-imum values were 40 ppmv for O3,500 pptv for OH, and 4 ppbv for HO2. The oxidant
amounts are 100 to 1000 times troposphere values, but the ratios OH/O3and HO2/OH 10
are similar to troposphere values. The aerosol production mechanism and the aerosol mass yield were studied for several controlling variables, such as temperature, rela-tive humidity, oxidant concentration, presence of nitrogen oxides (NOx), precursor gas
composition and amount, and the presence of acidic seed aerosol. The measured secondary organic aerosol (SOA) yield of several natural and anthropogenic volatile 15
organic compounds and a mixture of hydrocarbons in the PAM chamber were similar to those obtained in large, batch-style environmental chambers. This PAM method is being developed for measuring potential aerosol mass in the atmosphere, but is also useful for examining SOA processes in the laboratory and in environmental chambers.
1 Introduction
20
Secondary aerosol particles are produced by oxidizing gaseous emissions, forming low volatility compounds that either nucleate or partition on the existing aerosol par-ticles. Secondary aerosol particles are a significant fraction of all fine particles less than 2.5µm in diameter, called PM2.5(IPCC, 2001). These small atmospheric aerosol
particles have significant effects on human health by causing intensifying bronchial 25
and cardiopulmonary diseases in the human lung (Seinfeld and Pandis, 1998). They
ACPD
7, 9925–9972, 2007Introducing the concept of Potential Aerosol Mass (PAM)
E. Kang et al.
Title Page
Abstract Introduction
Conclusions References
Tables Figures
◭ ◮
◭ ◮
Back Close
Full Screen / Esc
Printer-friendly Version
Interactive Discussion
EGU also play an important role in the global radiative balance, directly by changing light
scattering and indirectly by changing cloud characteristics such as the reflectivity, size distribution, concentration, and albedo (IPCC, 2001; Seinfeld and Pandis, 1998). Un-derstanding the origins and formation of the secondary aerosol particles is essential for understanding and predicting the impact of secondary aerosol on health and climate. 5
A growing body of evidence shows that organic compounds are a large fraction of most secondary aerosol particles (Murphy et al., 1998; Huebert et al., 2004; Drewnick et al., 2004b; Salcedo et al., 2006). The sources of particulate organics, especially biogenic sources, are numerous and uncertain, (Kamens and Jaoui, 2001), unlike the sources for sulfate and nitrate, which are known to within an uncertainty of 20∼30%
10
(IPCC, 2001). Quantifying the particulate organic component from precursor gases is further complicated by other factors, such as the type and concentration of the oxidants, the atmospheric humidity and temperature, the presence of nitrogen oxides (NOx),
and the presence of pre-existing acidic aerosol (for example, Seinfeld et al., 2001; Griffin et al., 1999; Presto et al., 2005; Northcross and Jang, 2006.). These and other 15
recent studies have begun probing the aerosol properties resulting from the oxidation of different organic precursor gases. The goal is to understand the complexities and commonalities in order to understand the mechanisms and environmental conditions that control the formation and aging of secondary organic aerosol (SOA) particles.
Inorganic secondary aerosol from sulfur dioxide (SO2) photo-oxidation by hydroxyl
20
(OH), in contrast to SOA formation, is well studied experimentally and theoretically. In particular, the binary nucleation of sulfate aerosols has been studied widely to de-termine the nucleation rate and the particle number concentration in ideal conditions (Jaecker-Voirol and Mirabel 1988; Vehkamaki et al., 2002). However, while the sulfate aerosol particle is generally well understood, its interactions with nitric acid, ammonia, 25
and organics can affect the chemical composition, mass, and volatility of the secondary aerosol particle.
chem-ACPD
7, 9925–9972, 2007Introducing the concept of Potential Aerosol Mass (PAM)
E. Kang et al.
Title Page
Abstract Introduction
Conclusions References
Tables Figures
◭ ◮
◭ ◮
Back Close
Full Screen / Esc
Printer-friendly Version
Interactive Discussion
EGU ical composition, aerosol size distributions, and aerosol yield are compared to results
from chemical models (for example, Kamens et al., 1999; Jang et al., 2002; Gao et al., 2004). The typical environmental chambers are large batch-style Teflon bags with vol-umes up to 30 m3and residence times of several hours. These chambers are designed to simulate the timescales of SOA formation and further oxidation in the atmosphere. 5
The large size makes this simulation possible, although wall effects remain significant and a concern (Cocker III et al., 2001). In these environmental chamber experiments, the amounts of oxidants are usually similar to those encountered in the atmosphere, with ozone being as much as several hundred ppbv and OH in the range of 106–107 molecules cm−3. Recently a continuous laminar flow chamber with small volume of 10
9.5 L was developed that uses about 1 ppmv of ozone with a residence time of a few hours to study SOA formation (Jonsson et al., 2006). Wall effects and limited residence time remain as significant issues that may affect the fidelity of the chamber simulations to the atmosphere.
In the atmosphere, attempts have been made to measure all the SOA precursor 15
gases, and then, using the yield data from environmental chambers, model the aerosol mass that results from the measured abundances of known aerosol precursor gases. This procedure is uncertain because not all the precursor gases may have been mea-sured and their yields and the heterogeneous chemistry for the sampled environments may not be known. While the inorganic precursor gases SO2 and NO2 are routinely
20
measured, the volatile organic compounds (VOCs) are much less commonly measured (Demerjian, 2000). The Photochemical Assessment Monitoring Stations in the United States of America measure some of the VOCs, but the high-molecular-weight VOCs that tend to produce secondary aerosol are scarcely measured. Thus, modeling the aerosol mass that comes from atmospheric organic emissions is difficult and uncertain. 25
An alternate approach is the direct and fast measurement of aerosol forming poten-tial of air masses in the atmosphere using networks of small, inexpensive chambers. Current environmental chambers are not designed to track the fast changes of precur-sor gases in the atmosphere; they are too large, have a long response time, and would
ACPD
7, 9925–9972, 2007Introducing the concept of Potential Aerosol Mass (PAM)
E. Kang et al.
Title Page
Abstract Introduction
Conclusions References
Tables Figures
◭ ◮
◭ ◮
Back Close
Full Screen / Esc
Printer-friendly Version
Interactive Discussion
EGU be difficult to replicate into a network of chambers. A new concept and measurement
method are required.
We introduce a new concept: Potential Aerosol Mass (PAM). PAM can be defined as the maximum aerosol mass that the oxidation of precursor gases produces. All precursor gases are rapidly oxidized with extreme amounts of oxidants to low volatility 5
compounds, resulting in the aerosol formation. For this approach to simulate the at-mosphere, all of the processes, including oxidation of precursor gas, nucleation, and gas and particle partitioning, should occur as they do in the atmosphere, except that instead of taking hours, the processes should be complete in a few minutes. This fast secondary aerosol formation under highly oxidizing conditions should be able to sim-10
ulate the processes that occur in either the batch-style environmental chambers or, more importantly, the real atmosphere. While defining such a quantity may seem diffi -cult, considering all the factors that affect aerosol yield, our studies indicate that it may be possible.
The term, maximum aerosol yield, was introduced by Mart´ın-Reviejo and Wirtz 15
(2005). Their maximum aerosol yield is calculated by the slope of the increase of aerosol mass with decrease in precursor organic species in environmental chamber experiments. Mart´ın-Reviejo and Wirtz (2005) observed higher value for maximum aerosol yield than for overall aerosol yield, but it was due to the use of threshold of reacted precursor organic in the calculation of overall aerosol yield. Their maximum 20
aerosol yield can be calculated for only limited SOA with mass that increases linearly with the decrease of precursor organic species. The PAM concept is completely diff er-ent from the concept of maximum aerosol yield.
In this paper, we describe our initial efforts to develop the PAM concept. We provide results that indicate its feasibility and its applicability to SOA formation in the atmo-25
ACPD
7, 9925–9972, 2007Introducing the concept of Potential Aerosol Mass (PAM)
E. Kang et al.
Title Page
Abstract Introduction
Conclusions References
Tables Figures
◭ ◮
◭ ◮
Back Close
Full Screen / Esc
Printer-friendly Version
Interactive Discussion
EGU presence of NOx, and presence of acidic seed aerosol. We compare our results for
sev-eral natural and anthropogenic volatile organic compounds to others obtained in large, batch-style environmental chambers. Finally, we show the results from the first field test. We demonstrate that the PAM concept is not only applicable to the atmosphere, but is also a potent tool for studying SOA in the laboratory and in environmental cham-5
bers.
2 Experimental method
A prototype chamber was designed to examine the PAM concept. The basic require-ments for the PAM chamber are the following: continuous flow with a long enough residence time that precursor gases will be fully oxidized to aerosol particles; sufficient 10
flow to be compatible with a variety of aerosol particle sampling instruments; an air flow through the chamber that isolates particle sampling from potential wall effects; and the ability to vary the amount of UV radiation and amounts of water vapor, precur-sor gases, and oxidants. This prototype chamber generally meets these requirements, but is certainly not optimized.
15
The prototype PAM chamber is a cylinder made of Teflon FEP film (0.5 mm thick) with a volume of 19 L, a length of 60 cm, and a diameter of 20 cm (Fig. 1). Two ozone-producing UV grid lamps (BHK Inc.) are mounted one above the other on the wall of a larger, sealed housing in which the Teflon chamber is suspended. Each of these lamps is 15 cm×15 cm and produces mainly 185 nm and 254 nm light. The volume inside the 20
housing surrounding the Teflon chamber is purged with N2to prevent ozone formation
outside of the chamber and to purge away any out-gassing from the Teflon chamber and the inside of the housing. Aerosol particles, gases, pressure, and temperature are sampled in the center at the bottom of the PAM chamber.
The sample air was continuously added to the chamber and released out through a 25
large exhaust hose at the bottom. The chamber remained at ambient pressure. The volumetric air flow could be varied and was typically 5 to 20 L min−1. At these flow
ACPD
7, 9925–9972, 2007Introducing the concept of Potential Aerosol Mass (PAM)
E. Kang et al.
Title Page
Abstract Introduction
Conclusions References
Tables Figures
◭ ◮
◭ ◮
Back Close
Full Screen / Esc
Printer-friendly Version
Interactive Discussion
EGU rates, the air flow was calculated to be laminar with a Reynolds number less than 500.
Two different methods were tried to bring the flow into the chamber: introducing the flow through a system of perforated tubes at the top of the chamber in an effort to spread the flow across the chamber area, and introducing the air flow through a 1 cm diameter tube that protrudes a few centimeter into the chamber on its cylindrical axis. 5
The results described in this feasibility study appear to be independent of the method of introducing the air into the chamber.
We define the term, exposure time, to be the average time that the sample air is exposed to the oxidants in the chamber. In the continuous flow chamber, how much precursor gas is oxidized is determined by the oxidant concentration and the exposure 10
time. The exposure time of the PAM chamber was determined by monitoring how fast SO2 was changed from an initial value to a lower value after UV lights were turned
on. At a flow rate of 5 L min−1, the exposure time was 240±36 s and at 10 L min−1
was 180±27 s. That the exposure times are not inversely proportional to the flow rates
suggests that the air does not flow through the chamber with a uniform velocity across 15
the chamber cross section.
The purified dry air comes from room air that is compressed and then passed through a zero air generator (ZAG-75 Labgas Inc.) and a series of filters: drierite, activated charcoal, hopcalite, and HEPA filter pack. The purified dry air was humidified by pass-ing it through a glass bubbler containpass-ing deionized water. The relative humidity was 20
controlled by adjusting the fraction of the total air flow that passed through the bubbler. The total flow rate of the purified air was controlled by mass flow controllers (1179A, 1479A, MKS Inc.).
Other gases were added to the chamber by combining mixtures of these gases to the purified air upstream of the PAM chamber. Commercially prepared mixtures were used 25
for SO2 (10 ppmv, Scott Specialty Gases) and for NOx (10 ppmv, Matheson-Trigas),
ACPD
7, 9925–9972, 2007Introducing the concept of Potential Aerosol Mass (PAM)
E. Kang et al.
Title Page
Abstract Introduction
Conclusions References
Tables Figures
◭ ◮
◭ ◮
Back Close
Full Screen / Esc
Printer-friendly Version
Interactive Discussion
EGU For this feasibility study, nine hydrocarbons were used: three monoterpenes (α
-pinene, β-pinene,∆3-carene), and six anthropogenic hydrocarbons (cyclohexene, m-xylene, p-m-xylene, 1,3,5-trimethylbenzene (1,3,5-TMB), toluene, and ethylbenzene). The stated purities of parent hydrocarbons are as follows: α-pinene (Fluka, 99.0%),
β-pinene (Fluka, 99.0%), ∆3-carene (Fluka, 98.5%), cyclohexene (Fluka, 99.7%), 5
m-xylene (Fluka, 99.5%), p-xylene (Fluka, 99.5%), 1,3,5-trimethylbenzene (1,3,5-TMB), (Aldrich, 100 mg of ampule), toluene (Fluka, 99.9%), and ethylbenzene (Fluka, 99.5%). The hydrocarbon gas mixtures were prepared in ultra pure N2(99.999% pure,
<0.5 ppm THC, GTS) gas in the laboratory. To make a mixture, a hydrocarbon was added to a 6 l evacuated glass bulb and the pressure,PHC, was measured (Baratron 10
390 HA, MKS Inc.). The bulb was then filled to a higher pressure with N2, creating a mixture with a mixing ratio given by the following equation:
Mixing ratio of a mixture(ppmv)=PHC−P0
PTotal−P0
×106 (1)
wherePHC is the hydrocarbon partial pressure,P0 is the minimum pressure achieved
in evacuation (typically<0.5 hPa), andPTotal is the final pressure of the mixture.
15
The reactive gases O3, OH, and HO2were generated directly in the PAM chamber. Irradiating humid, purified air inside of the chamber with 185 nm UV light produced OH and HO2 from H2O and O3 from O2. For the studies of dark reactions with ozone,
humid or dry purified air was passed through an external O3generator (AnaLamp low pressure Hg lamp, BHK Inc.) first and then added into the purified air before entering 20
the chamber. OH and HO2 were also generated in the external O3 generator, but
essentially all OH and HO2 were reacted away before they reached to the chamber. Different O3, OH, and HO2mixing ratios were generated by varying the power supplied
to the UV lamps, using one or both UV lamps, and varying the humidity. The production of reactive gases could be rapidly terminated by turning offthe UV lamps.
25
Both gases and aerosol particles were sampled through inlets near the center of the lower end of the cylindrical PAM chamber (Fig. 1). Gaseous sample inlets were
ACPD
7, 9925–9972, 2007Introducing the concept of Potential Aerosol Mass (PAM)
E. Kang et al.
Title Page
Abstract Introduction
Conclusions References
Tables Figures
◭ ◮
◭ ◮
Back Close
Full Screen / Esc
Printer-friendly Version
Interactive Discussion
EGU placed 5 cm above the bottom of the chamber. O3, SO2, and NO/NOx in the
cham-ber were continuously monitored by O3 monitor (model 8810 ozone analyzer, Monitor
Labs Inc.), SO2monitor (43i-TLE SO2analyzer, Thermo Electron Corp.), and NO/NOx
monitor (42 C Trace level NO-NO2-NOyanalyzer, Thermo Environmental Instruments). Initial and final hydrocarbon concentrations were measured by Gas Chromatography-5
Flame Ionization Detector (8610 C, SRI) before and after the UV light was turned on. Humidity and temperature is continuously monitored by a humidity and temperature sensor (HUMICAP HMP 45A/D, Vaisala).
Two aerosol sample inlets made of stainless steel and copper tubing were placed 12 cm above the bottom of the chamber. Aerosol mass was mainly detected with a 10
real-time aerosol mass measurement instrument, the Rupprecht and Patashnick Ta-pered Element Oscillating Microbalance (TEOM). One other inlet was designed to con-nect additional aerosol measurement instruments such as Quadruple-Aerosol Mass Spectrometer (AMS) or Ultra High Sensitivity Aerosol Spectrometer (UHSAS). The raw frequency of the TEOM mass transducer was recorded every 10 s and aerosol mass 15
was calculated and averaged for 2 min based on the equation:
∆Mfilter ∆t =K0
1
f2
i+1
−f12
i
,
MC(µg/m3)=∆Mfilter
∆t ×
1 flowrate(l/min)
(2)
where ∆Mfilter is mass of the TEOM filter, K0 is a calibration constant of the mass
transducer,f is frequency,t is time, MC is particle mass concentration, and flow rate is a sample flow rate through the TEOM. The mass concentration calculated by the 20
raw frequency without the manufacturer’s smoothing procedure enabled us to track rapid mass changes in the PAM chamber. The aerosol mass was obtained from the difference between produced aerosol mass and the background mass, which was the aerosol mass detected in purified air.
ACPD
7, 9925–9972, 2007Introducing the concept of Potential Aerosol Mass (PAM)
E. Kang et al.
Title Page
Abstract Introduction
Conclusions References
Tables Figures
◭ ◮
◭ ◮
Back Close
Full Screen / Esc
Printer-friendly Version
Interactive Discussion
EGU volatile organic aerosol (TEOM 1400A monitor, Technical note 4) instead of 50◦C.
The TEOM temperature setting of 30◦C can result in increased noise due to humid-ity changes, but the additional noise was less than the acceptable uncertainty, 5µg/m3 for a 10-min average. The concern is that semi-volatile organics may be lost from the TEOM (Schwab et al., 2004, 2006; Long et al., 2005; Wilson et al., 2006), even when 5
operated at 30◦C. If significant semi-volatile mass were being lost on the TEOM in the PAM measurements, then a large negative mass signal calculated by Eq. (2) would be observed after the UV lights were turned off. However, a negative mass of only at most a few percent of the measured mass was sometimes observed in the experiments or the preliminary field study. Furthermore, for experiments in which the PAM cham-10
ber was sampled with both the TEOM and an Aerosol Mass Spectrometer (AMS), the two instruments measured the same mass to within 10%. Thus, for these studies, the TEOM does not appear to be losing a significant amount of semi-volatile organic mass. A unique feature of this PAM feasibility study is the direct quantification of OH and HO2 in the PAM chamber for different conditions. The OH and HO2 mixing ratios
15
were measured separately by the Ground-based Tropospheric Hydrogen Oxides Sen-sor (GTHOS) (Root, 2007; Faloona et al., 2004). The TEOM inlet was replaced with the GTHOS inlet, which was at the same height in the PAM chamber that the TEOM inlet was. OH and HO2mixing ratios were measured for the range of relative humidity used in the feasibility studies.
20
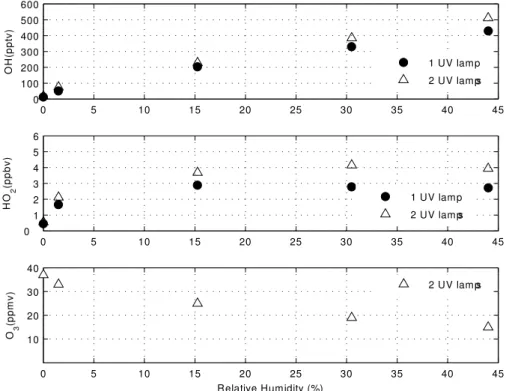
The behavior of O3, OH, and HO2are quite different as a function of relative humidity
(Fig. 2). Ozone is generally independent of relative humidity and depends only on the exposure time to the UV. The slight decrease in O3 at higher humidity is due to
absorption of UV by the increased water vapor, and therefore the reduction of UV in the chamber, to the reactions with OH and HO2, and to the photolysis of ozone and 25
reaction with water vapor that results in the formation of OH. Ozone could be varied from 0 to 30 ppmv. OH also depends on UV, but is roughly linearly dependent on water vapor. With the UV lamps on, OH could be generated over a wide range of mixing ratios, from∼7 pptv when RH was∼0% to 500 pptv when RH was∼45%. HO2showed
ACPD
7, 9925–9972, 2007Introducing the concept of Potential Aerosol Mass (PAM)
E. Kang et al.
Title Page
Abstract Introduction
Conclusions References
Tables Figures
◭ ◮
◭ ◮
Back Close
Full Screen / Esc
Printer-friendly Version
Interactive Discussion
EGU quite different behavior, changing non-linearly from 100 pptv when RH was ∼0% to
∼4.0 ppbv when RH was 15% or greater.
This behavior of HO2and OH can be understood as follows. The concentrations of
OH and HO2 are so high that the lifetimes of OH and HO2 are very short, much less
than a second. The major loss of HO2is the reaction HO2+HO2 →HOOH+O2, and to 5
a lesser extent the reaction HO2+OH→H2O+O2. HO2is at least ten times larger than
OH, so that HOx, the sum of OH+HO2, is essentially equal to HO2. Because the HOx
loss is quadratic in HOx, the HOxconcentration is equal to the square root of the HOx production:
HO2=
s
PHOx
2kHO2+HO2. (3)
10
From the Eq. (3), an estimate of the HO2production rate is 3×10 10
molecules cm−3s−1. On the other hand, the main loss for OH is reaction with HO2, which is essentially con-stant above an RH of∼15%, while OH production continues to increase with increasing
relative humidity. As a result, the OH mixing ratio continues to increase proportionally with increased OH production since the OH loss is fixed.
15
The ratios of O3 to OH to HO2 are similar to those encountered during midday in
the lower atmosphere. Assuming typical atmospheric values, 50 to 100 ppbv for O3,
20 to 80 pptv for HO2, and 0.2 to 0.5 pptv for OH, typical O3/OH ratios are 1×10⁵
to 3×10⁵ and typical HO2/OH ratios are 10 to 100. These ratios are similar to the
ratios in the PAM chamber: 2×10⁵for O3/OH and∼15 for HO2/OH. Thus, in terms of
20
major oxidants, the PAM chamber can simulate atmospheric oxidation processes, but at greatly accelerated rates.
The OH and HO2 mixing ratios were measured at the bottom of the PAM chamber. The OH mixing ratio derived from the change in SO2observed with and without the UV
lights on agrees to well within uncertainties with the OH measured directly by GTHOS 25
ACPD
7, 9925–9972, 2007Introducing the concept of Potential Aerosol Mass (PAM)
E. Kang et al.
Title Page
Abstract Introduction
Conclusions References
Tables Figures
◭ ◮
◭ ◮
Back Close
Full Screen / Esc
Printer-friendly Version
Interactive Discussion
EGU that the OH distribution in the chamber is fairly uniform. Furthermore, the directly
mea-sured OH and HO2mixing ratios allow the OH and HO2mixing ratios to be estimated
from knowledge of only the UV light and the relative humidity. Better control on these parameters will be built into the next version of the PAM measurement.
3 Results and discussion
5
3.1 Feasibility test of the PAM concept: SO2conversion to sulfate aerosol
The quantitative conversion of SO2to inorganic sulfate aerosol was studied to
demon-strate the PAM concept, even though the greatest value for PAM is improving the under-standing of secondary organic aerosol. The oxidation pathways, nucleation process, sulfate mass per amount of SO2, and unity yield are all well known:
10
SO2(g)+OH
oxidation
−→ H2SO4(g)
H2SO4(g)+H2O(g)nucleation−→ sulfate aerosol
(4)
where kOH+SO2=2.0×10− 12
molecule−1cm3s−1 at 298 K for the initial reaction of SO2
with OH. Thus, simultaneous measurements of SO2and sulfate aerosol mass test both the rapid oxidation and nucleation of aerosol particles and the possible loss of sulfate aerosol particles to the walls.
15
The theoretical value of the maximum sulfate aerosol produced in the PAM chamber is calculated by the equation:
The calculated conversion ratio =χ(SO2(1 ppbv))×mass of sulfurSO
2volume ×
H2SO4mass
mass of sulfur ×growth factor
(5)
The growth factor is given by the equation:
growth factor(f)=mH2SO4+mH20
mH2SO4
(6) 20
ACPD
7, 9925–9972, 2007Introducing the concept of Potential Aerosol Mass (PAM)
E. Kang et al.
Title Page
Abstract Introduction
Conclusions References
Tables Figures
◭ ◮
◭ ◮
Back Close
Full Screen / Esc
Printer-friendly Version
Interactive Discussion
EGU The calculation assumes that OH is in great excess in the chamber and that all of
the oxidized SO2 becomes sulfate aerosol. One ppbv of SO2 produces 3.95µgm− 3
of H2SO4. A complication is the water uptake on the sulfate aerosol particles, which
makes the aerosol particle mass dependent on relative humidity (RH). As a result, the conversion ratio from SO2 to sulfate aerosol particle mass depends on a
humidity-5
dependent growth factor. The growth factor as a function of relative humidity is calcu-lated by the theoretical model of Jaecker-Voirol et al. (1990) (Fig. 3). For example, at a relative humidity of 28% and a TEOM temperature of 30◦C, total conversion of 1 ppbv of SO2produces 5.8µgm−
3
of sulfate aerosol. The water uptake of the sulfate aerosol particles rapidly adjusts to equilibrium with the relative humidity, so that the relative hu-10
midity that is important in determining the aerosol particle mass is the relative humidity at the TEOM mass transducer.
A range of SO2mixing ratios from 3 ppbv to 35 ppbv were added to the air flow in the
chamber. For these experiments, the air flow rate was 5 l/min, the exposure time to the UV light was 240±36 s, and the relative humidity was 40% in the chamber and 28% at
15
the TEOM mass transducer (Fig. 4). Both UV grid lamps were on, producing 450 pptv of OH in the chamber.
The unsmoothed TEOM mass was calculated from the raw frequency change mea-surements (Fig. 4). For this graph, the SO2mixing ratios have been converted to sulfate
mass using the calculated conversion ratio of 5.8µgm−3appropriate for the 28% rela-20
tive humidity at the TEOM mass transducer. The aerosol mass quickly increased to the stable value simultaneously as SO2dropped down to background levels. The aerosol
mass calculated from the raw frequency indicated that sulfate aerosol formation was completed in a few minutes in the PAM chamber. The slope in Fig. 4b represents the measured conversion ratio, 5.6µgm−3 (ppbv SO2)−
1
, which agrees to well with the 25
expected conversion ratio of 5.8µgm−3(ppbv SO2)− 1
.
temper-ACPD
7, 9925–9972, 2007Introducing the concept of Potential Aerosol Mass (PAM)
E. Kang et al.
Title Page
Abstract Introduction
Conclusions References
Tables Figures
◭ ◮
◭ ◮
Back Close
Full Screen / Esc
Printer-friendly Version
Interactive Discussion
EGU ature of 50◦C and relative humidity of 18% in the TEOM mass transducer, the
mea-sured conversion ratio was 4.69µgm−3 (ppbv SO2)− 1
and calculated conversion ratio was 4.98µgm−3 (ppbv SO2)−
1
. Thus, the sulfate aerosol formation is not affected by the TEOM temperature. For most of our studies of inorganic and organic secondary aerosol, the TEOM mass transducer temperature was kept at 30◦C.
5
The wall loss of precursor gases was tested by measuring the SO2 mixing ratio in
and out of the chamber. Less than 20% of SO2was lost on entrance into the chamber and on the Teflon chamber wall. This low wall loss rate is due in part to the relatively fast continuous flow in the PAM chamber. This small wall loss for SO2shows that other
less sticky precursor gases have minimal loss in the PAM chamber. 10
SO2 conversion to sulfate aerosol was performed frequently to monitor the
cham-ber’s ability to reproduce the sulfate potential aerosol mass (PAM) quantitatively. For four SO2 experiments, the measured conversion ratio was 92±4% of the calculated
conversion ratio, well within the absolute uncertainty of∼16% for the expected ratio of
1. 15
These experiments show that SO2 can be completely converted to sulfate aerosol particles in the few minutes of exposure time in the PAM chamber. The oxidation of SO2 by OH is relatively slow compared to most hydrocarbon oxidation by OH, with
kOH+SO2=2×10− 12
molecule−1cm3s−1. For example, α-pinene reacts with OH with a reaction rate coefficient of kOH+α−pinene=9.4×10⁻¹¹molecule−1cm3s−1. The oxidation
20
rate constant of other SOA precursor hydrocarbons with OH is similar or even faster than kOH+α−pinene, so that these hydrocarbons should be completely oxidized in the PAM chamber. This conclusion is supported by GC-FID measurements of the nine hydrocarbons that were studied. They were all depleted to below the detection limit in the PAM chamber after the UV lights were turned on.
25
ACPD
7, 9925–9972, 2007Introducing the concept of Potential Aerosol Mass (PAM)
E. Kang et al.
Title Page
Abstract Introduction
Conclusions References
Tables Figures
◭ ◮
◭ ◮
Back Close
Full Screen / Esc
Printer-friendly Version
Interactive Discussion
EGU 3.2 Feasibility tests of the PAM concept with organic gas conversion to SOA
The feasibility of the PAM concept was checked by varying several parameters that might affect the SOA mass yield. The well-studied precursor gas,α-pinene, was cho-sen for most of the tests. In the series of experiments, the goal was to determine the conditions for which the PAM chamber would produce the maximum SOA yield. The 5
SOA yield was obtained by the equation (Seinfeld et al., 2001):
SOA Yield (Y)=MO( produced organic aerosol mass)
∆HC(reacted hydrocarbon mass). (7)
A typical procedure for these experiments was to first establish the flows of all the gases, then turn on the UV lights until the signal stabilized, and then turn offthe UV lights again, as in Fig. 4a. For the SO2 experiments, the aerosol mass would quickly 10
rise to near its peak value as the SO2 value fell and then remain there. In most sec-ondary organic aerosol experiments with sufficient oxidants, the aerosol mass would quickly rise to a peak within a minute or so, but would then decrease to a smaller stable value.
This observed behavior can be explained by the further oxidation of the semi-volatile 15
organics produced by the oxidation of precursor organics. The partitioning of the semi-volatile organics is in equilibrium between the gas and particle phases (Odum et al., 1996). If these semi-volatile organics are further oxidized to stable gas-phase products, the amount of semi-volatile organics partitioned between the gas and particle phases decreases, thus decreasing the SOA mass. We will examine this behavior and the 20
roles that OH and HO2 play in more detail in another manuscript. For the feasibility
ACPD
7, 9925–9972, 2007Introducing the concept of Potential Aerosol Mass (PAM)
E. Kang et al.
Title Page
Abstract Introduction
Conclusions References
Tables Figures
◭ ◮
◭ ◮
Back Close
Full Screen / Esc
Printer-friendly Version
Interactive Discussion
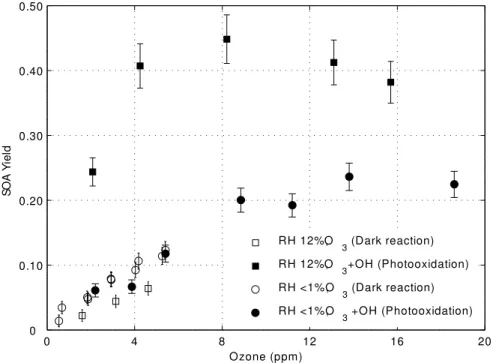
EGU 3.2.1 SOA yield as a function of O3
The effect of ozone on the SOA yield fromα-pinene was studied by varying the ozone mixing ratio in the chamber containing in purified dry air (RH<1%) (Fig. 5). The initialα -pinene mixing ratio was 100 ppbv. Ozone was varied by changing the flow rate through an external ozone generator, changing the UV lamp intensity with a controllable power 5
supply, and covering a fraction of the UV lamps with an aluminum cover. Ozone was produced in the range of 0.7 ppmv to 27 ppmv. OH was about 7 pptv and HO2 was
450 pptv in the dry, purified air. These OH and HO2values were 10 to 50 times larger
than observed in the troposphere, but ozone values were more than 100 times larger than observed in the troposphere.
10
The aerosol mass initially increased as ozone increased, but then reached a constant maximum stable value for ozone greater than ∼12 ppmv. Thus, ozone levels greater
than∼12 ppmv were sufficient to maximize the SOA yield. It is also important to note
that higher levels of O3 do not reduce the aerosol yield, suggesting that O3 does not
react significantly with theα-pinene reaction products that influence the SOA yield. 15
3.2.2 SOA yield as a function of air flow rate in the chamber
The flow rate of air through the chamber affects primarily the exposure time in the PAM chamber. In order to achieve maximum aerosol mass, the exposure time in the chamber must be sufficient to allow for the oxidation of the precursor gas, the aerosol particle nucleation, the condensation of the low-volatility product, and any particle-20
phase or gas-phase reactions that occur. The higher the flow rate means the shorter the exposure time in the PAM chamber.
The SOA yield from ozonolysis of 100 ppbv ofα-pinene in dry conditions was mea-sured as a function of ozone for three flow rates: 5, 10, and 20 L min−1 (Fig. 5). The behavior of SOA yield as a function of O3 appears to be similar for flow rates of 5 and
25
10 L min−1. The SOA yield for the 20 L min−1flow rate appears to be less than the other two, but not enough data could be obtained at higher ozone values to see if the aerosol
ACPD
7, 9925–9972, 2007Introducing the concept of Potential Aerosol Mass (PAM)
E. Kang et al.
Title Page
Abstract Introduction
Conclusions References
Tables Figures
◭ ◮
◭ ◮
Back Close
Full Screen / Esc
Printer-friendly Version
Interactive Discussion
EGU yield leveled offat higher ozone values as it did for the slower flow rates. That the SOA
yields at the 5 L min−1 and 10 L min−1 flow rates were similar indicates that the PAM chamber could be smaller than its present size and still achieve maximum SOA yields.
3.2.3 SOA yield as a function of OH
The SOA yield in UV irradiated chamber was about 5 times that in the dark chamber at 5
same relative humidity and temperature (Fig. 6). This additional SOA yield likely comes from the reaction of OH withα-pinene. The rate constants ofα-pinene with OH and with O3 are about 5.5×10⁻¹¹molecule−1cm3s−1 and 8.2×10⁻¹⁷molecule−1cm3s−1 from
288 K to 295 K (The MCM website, 2004). Since 5 ppmv of O3and 300 pptv of OH are
produced when the relative humidity was 30% and one UV light was on, the value of 10
kOH[OH] was about 20 times greater than kO3[O3]. Thus, the photo-oxidation by OH was the most important reaction in the humid, UV-irradiated chamber. The oxidation pathways opened up by reactions with OH produce additional low volatility products for the particle phase (Kamens and Jaoui, 2001). The increased SOA yield in the PAM chamber when abundant OH is present is consistent with these additional pathways. 15
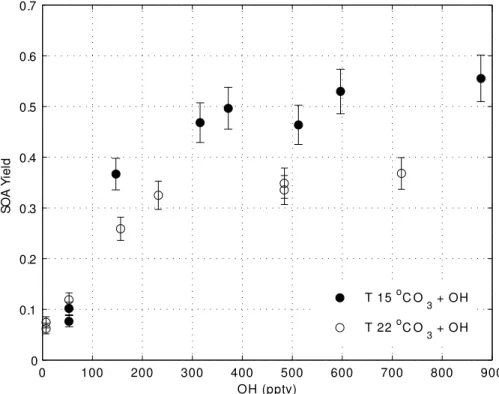
The OH mixing ratio was changed by varying the relative humidity while holding O3 (5 ppmv) and UV light constant (Fig. 7). As OH increased, SOA yield increased but eventually leveled offfor OH greater than 300 pptv. Thus, in this PAM chamber, 300 pptv of OH was sufficient to produce the maximum SOA yield forα-pinene.
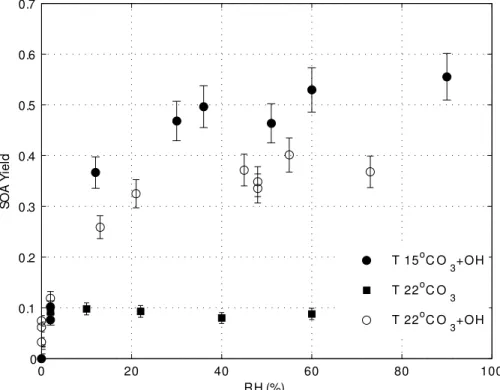
3.2.4 SOA yield as a function of temperature and humidity 20
Temperature and humidity can both have an effect on aerosol mass yield (see for ex-ample Seinfeld and Pankow, 2003). The effect of temperature on the SOA yield from
α-pinene was tested by measuring the SOA yield with two different temperatures in the chamber, 22◦C and 15◦C. O3was held constant at 5 ppmv while OH was varied by changing relative humidity. At low relative humidity (Fig. 6) and OH (Fig. 7), the SOA 25
ACPD
7, 9925–9972, 2007Introducing the concept of Potential Aerosol Mass (PAM)
E. Kang et al.
Title Page
Abstract Introduction
Conclusions References
Tables Figures
◭ ◮
◭ ◮
Back Close
Full Screen / Esc
Printer-friendly Version
Interactive Discussion
EGU 15◦C is a factor of 1.4 greater than that at 22◦C. The increased SOA yield at the lower
temperature can be explained by the decrease in the partitioning ofα-pinene products in the particle phase with increasing temperature (Pankow et al., 2001). This temper-ature dependence applies to other organics as well. Therefore the definition of PAM may require that the measurement be made at a standard temperature or be made at 5
several temperatures over a range of temperatures.
The effect of relative humidity on SOA yield was tested using oxidation primarily by ozone. The relative humidity was varied from 2 to 60% in purified air, to which ozone and α-pinene were added before the air flowed into and through the dark chamber. (Fig. 6, filled squares). In this case, the SOA yield did not change as relative humidity 10
was increased, indicating that the relative humidity itself is not an important factor to change SOA yield forα-pinene ozonolysis. This result is consistent with a previous study ofα-pinene ozonolysis, in which increasing the relative humidity from 0 to 40% increased the SOA mass only 10%, including the water mass in the aerosol particles (Cocker III et al., 2001).
15
3.2.5 SOA yield as a function of UV radiation
Extremely high UV actinic flux could possibly alter the SOA yields (Presto et al., 2005a). A test for this possibility with PAM is the comparison of the SOA yields that comes from adding ozone in the dark chamber to that from making the same amount of ozone in the chamber with UV radiation. The aerosol yield is compared for four cases: dark, dry 20
chamber (externally generated ozone added to dry air (RH<1%) in a dark chamber); UV-irradiated dry chamber (ozone generated by UV radiation in the chamber in dry air (RH<1%), in order to minimize OH and HO2 production); dark, humid chamber (with
externally generated ozone added to air with RH=12% in a dark chamber); and UV-irradiated humid chamber (with ozone generated by UV radiation in the chamber in air 25
with RH=12%). In all cases but the last case, OH was less than 15 pptv, about 10−6 times less than O3, so that O3reactions withα-pinene dominate. In the case of the
UV-irradiated humid chamber, the OH/O3ratio was at least 9×10⁻⁶when O3was 15 ppmv
ACPD
7, 9925–9972, 2007Introducing the concept of Potential Aerosol Mass (PAM)
E. Kang et al.
Title Page
Abstract Introduction
Conclusions References
Tables Figures
◭ ◮
◭ ◮
Back Close
Full Screen / Esc
Printer-friendly Version
Interactive Discussion
EGU and OH was 150 pptv; the OH reactions withα-pinene were much more significant.
The SOA yield for the dark, dry chamber and UV-irradiated, dry chamber are the same to within uncertainties for as much as 6 ppmv of ozone (Fig. 8). The external ozone generator could not produce more than 6 ppmv of ozone, so that above 6 ppmv, only yields from the UV irradiated chamber cases are shown. The yield for the case of 5
the dark, humid chamber is slightly less than the dry chamber cases. This effect needs further investigation. On the other hand, the yield for the case of the UV-irradiated hu-mid chamber is significantly greater than all the other cases, indicating the importance of OH in oxidizingα-pinene to SOA.
This agreement between the SOA yield in the dark, dry chamber and in the UV-10
irradiated dry chamber is inconsistent with the observations of Presto et al. (2005a). They observed a 20 to 40% reduction in SOA yield between the case in which the chamber was UV-irradiated and the case in which ozone was added to a dark chamber. In both cases, they used cleaned air with RH<10% and added up to 600 ppbv of ozone into the chamber. In order to remove OH in the chamber, they added 2-butanol and 15
calculated that as much as 90% of the OH was removed.
The difference between the two observations could be explained by the 10 to 15 pptv of OH in the UV-irradiated, dry PAM chamber. This amount of OH will react with α -pinene about as fast as 6 ppmv of O3. It is possible that a loss of SOA caused by UV
radiation is balanced by an increase in SOA yield from this OH produced by UV in the 20
chamber. This balance seems unlikely but will need to be tested.
3.2.6 SOA yield as a function of acidic seed aerosol particles
Acidic seed aerosol particles have been shown to increase the aerosol yield under some circumstances (Jang et al., 2002; Northcross and Jang, 2006). The effect of acidic seed was tested with the addition of sulfate aerosol in a humid UV-irradiated 25
chamber. SO2 was added to the chamber; the acidic seed aerosol particles were
ACPD
7, 9925–9972, 2007Introducing the concept of Potential Aerosol Mass (PAM)
E. Kang et al.
Title Page
Abstract Introduction
Conclusions References
Tables Figures
◭ ◮
◭ ◮
Back Close
Full Screen / Esc
Printer-friendly Version
Interactive Discussion
EGU that resulted from the oxidation of the α-pinene by OH and O3 was determined by
subtracting the aerosol mass obtained with just SO2 added to the chamber from the
aerosol mass obtained with bothα-pinene and SO2in the chamber.
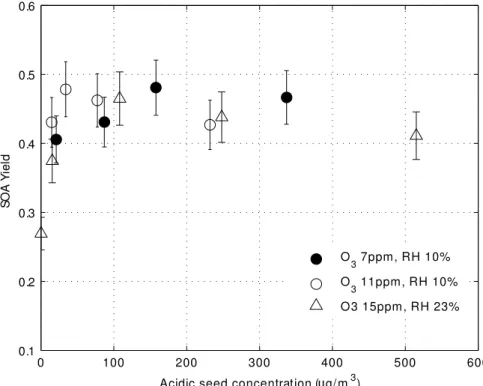
For all values ofα-pinene from 50 ppbv to 270 ppbv, the SOA yield is up a factor of 1.4 higher in the presence of the acidic seed aerosol than it is in the no-seed added 5
experiments (Fig. 9). For this study, 5 ppbv of SO2 was added, producing 20µgm− 3
of acidic seed. This increase of yield is qualitatively consistent with the results of Northcross and Jang (2006), who observed a 60 to 70% increase in SOA yield for acidic seed condition compare to neutral seed condition from theα-pinene ozonolysis. Their conditions were quite different from ours; in the PAM chamber, both OH and O3 10
oxidized α-pinene, while their chamber was dark and ozone was the only oxidant. It has been suggested that yield increases with the presence of the acidic seed aerosol because the acidic surface on the inorganic seed catalyzes the heterogeneous reaction of organic carbonyl species to increase SOA mass (Jang et al., 2002). The qualitative agreement between these two results suggests that the low-volatility products from 15
both OH and O3reactions might interact with the acidic seed in similar ways to increase
SOA yield.
As little as 15µgm−3of sulfate aerosol was able to increase the yield of 100 ppbv of
α-pinene (Fig. 10). It is not possible for us to know the SOA yield in the presence of no acidic seed aerosol, since chambers exposed to SO2will from then on always generate 20
a few acidic aerosol particles. Therefore, no seed in Fig. 10 actually means that SO2is
not added and the measured sulfate aerosol is less than 5µgm−3 for 10 min average, the precision of TEOM. In the no seed case, theα-pinene SOA yield was about 60% of that observed with added SO2. To within experimental uncertainty, the SOA yield
is independent of the acidic aerosol seed mass greater than 15µgm−3. The effect of 25
acidic seed is also independent to within experimental uncertainty of three different O3
values and two different relative humidity levels. These experiments suggest that the acidic seed effect is independent of both the OH and O3mixing ratios.
ACPD
7, 9925–9972, 2007Introducing the concept of Potential Aerosol Mass (PAM)
E. Kang et al.
Title Page
Abstract Introduction
Conclusions References
Tables Figures
◭ ◮
◭ ◮
Back Close
Full Screen / Esc
Printer-friendly Version
Interactive Discussion
EGU 3.3 SOA yields for various hydrocarbons
A powerful test of the PAM concept is the comparison of hydrocarbon SOA yields obtained in the PAM chamber with those obtained in large environmental chambers. Similar yields for a number of hydrocarbons under similar conditions provide strong evidence that the aerosol masses obtained from the PAM chamber are the same as 5
those obtained in large environmental chambers. If the large environmental chambers are reasonable simulations of the atmosphere, similar yields also suggest that the PAM measurements represent the potential aerosol mass in the atmosphere.
The SOA yields were measured for three monoterpenes and six anthropogenic hydrocarbons. The three monoterpenes were α-pinene, β-pinene, and ∆3-carene; 10
the six anthropogenic hydrocarbons were cyclohexene, m-xylene, p-xylene, 1,3,5-trimethylbenzne (1,3,5-TMB), toluene, and ethylbenzene. All experiments except some runs forα-pinene were performed at a constant temperature (297±1 K), with UV
irradi-ation, in purified air without added acidic seed. NOxwas added for some experiments
to test for a NOx effect. In all experiments, O3 was greater than 10 ppmv and OH
15
was greater than 300 pptv. Under these conditions, the hydrocarbons were reacted away; the remaining hydrocarbons were measured to be less than the GC-FID detec-tion limit. The complete list of experiments and the comparisons with previous studies is presented in Table 1. The SOA yields of nine hydrocarbons are compared to those from larger environmental chamber studies that had similar initial precursor gas mixing 20
ratios and chamber conditions.
The PAM yields are similar to the yields from previous studies for α-pinene, cyclo-hexene, m-xylene, p-xylene, 1,3,5-TMB, and toluene. If anything, the SOA yields in the PAM chamber are at the high end of the previously reported SOA yields. Two PAM yields –β-pinene and ethylbenzene – are significantly higher than from previous 25
studies; one PAM yield for∆3-carene, is significantly lower. These differences will be discussed in more detail below.
ACPD
7, 9925–9972, 2007Introducing the concept of Potential Aerosol Mass (PAM)
E. Kang et al.
Title Page
Abstract Introduction
Conclusions References
Tables Figures
◭ ◮
◭ ◮
Back Close
Full Screen / Esc
Printer-friendly Version
Interactive Discussion
EGU such as temperature, relative humidity, NOx mixing ratios, total organic aerosol mass
(Mo), and types and amounts of oxidants that were used in the large environmental
chamber studies. The values are similar, especially for precursor organic mixing ratios, but not exactly the same. However, despite these differences, the similarity of the PAM and previous yields provides evidence that the rapid oxidation in the PAM chamber 5
simulates SOA formation in the large environmental chambers.
The NOx in the PAM chamber is generally much lower than in the previous large environmental chamber studies. Background NOx in the PAM chamber was
∼3 ppb and added NOx in some runs was never more than 150 ppbv. The
ra-tio of [VOC]0/[NOx]0 (ppbC/ppb) in the chamber was always higher than 15 for 10
both of background NOx condition and added NOx conditions. The low NOx condition refers to [VOC]0/[NOx]0(ppbC/ppb)>15; the high NOx condition refers to
[VOC]0/[NOx]0(ppbC/ppb)<15 (Presto et al., 2005b; Song et al., 2005). Compared
to the previous studies in other chambers, our PAM chamber was operated essentially in the low NOx condition for all experiments.
15
Previous studies in large environmental chambers have examined the differences in SOA yields under high NOx and low NOx conditions. (Song et al., 2005; Presto et al., 2005b) In most cases, the high NOx condition reduced SOA yield
for both of biogenic hydrocarbons and anthropogenic hydrocarbons, whereas the SOA yield in low NOx condition was the same regardless of the amount of NOx. 20
For instance, α-pinene ozonolysis showed that the SOA yield was constant for [VOC]0/[NOx]0(ppbC/ppb)>15 and decreased as [VOC]0/[NOx]0decreased. They
sug-gested that as the [VOC]0/[NOx]0ratio decreases, the volatile product formation in-creases, thereby reducing aerosol yield. For [VOC]0/[NOx]0 ratios between 3 and 10,
they suggest that a greater amount of nitrate radical (NO3) is available to react with
25
α-pinene and that the product ofα-pinene and NO3does not contribute aerosol phase. Our results appear to be inconsistent with recent experiments that used neutral seed particles in the low NOxcondition (Ng et al., 2007). Ng et al. (2007) observed maximum
SOA yield 0.39 and 0.30 for m-xylene and toluene respectively. These values contrast
ACPD
7, 9925–9972, 2007Introducing the concept of Potential Aerosol Mass (PAM)
E. Kang et al.
Title Page
Abstract Introduction
Conclusions References
Tables Figures
◭ ◮
◭ ◮
Back Close
Full Screen / Esc
Printer-friendly Version
Interactive Discussion
EGU with our studies, in which the stable SOA yield is about 0.10 for both m-xylene and
toluene. Part of this difference might be explained by the aerosol seed that was used in the Ng et al. (2007) experiments but not in ours.
The SOA yield was measured many times for 100 ppbv ofα-pinene over the course of two years. The standard deviation of all these measurements is large, about 25% 5
of the mean value of 0.40. During the two years, many changes were made to the PAM chamber and experimental method as we were learning and the PAM concept was being optimized. Thus, this variability should not be too surprising. None-the-less, the SOA yield forα-pinene from the PAM chamber agrees with those from other chambers. The SOA yield for β-pinene is 0.48 in the PAM chamber. This yield is 10
greater than the SOA yields of 0.27 to 0.32 found in the large environmental chambers. This difference cannot be attributed to a difference in the initialβ-pinene mixing ratios for Lee et al. (2006) or Verutbangkul et al. (2006); the initialβ-pinene was 156 ppbv in the PAM chamber and 170 ppbv for the others. The greater SOA yield fromβ-pinene measured in the PAM chamber may be due to its low-NOxcondition (Ng et al., 2006) or
15
to some undetermined difference in environmental conditions (Lee et al., 2006; Griffin et al., 1999).
The SOA yields fromα-pinene andβ-pinene in the PAM chamber appear to be diff er-ent. However, the SOA yield can be sensitive to the organic aerosol mass,Mo. When the SOA yield for 156 ppbv ofβ-pinene is compared to the SOA yield for 150 ppbv ofα -20
pinene (Fig. 11), the two yields are the same, 0.49. This result appears to be consistent with that of Lee et al. (2006).
The SOA yield from ethylbenzene in the PAM chamber, which was 0.34, is signifi-cantly greater than the SOA yield reported in Odum et al. (1997), which was 0.09. The large environmental chamber used in the work of Odum et al. (1997) was operated 25
at a temperature of ∼34◦C. This temperature is 10◦C higher than the temperature in
semi-ACPD
7, 9925–9972, 2007Introducing the concept of Potential Aerosol Mass (PAM)
E. Kang et al.
Title Page
Abstract Introduction
Conclusions References
Tables Figures
◭ ◮
◭ ◮
Back Close
Full Screen / Esc
Printer-friendly Version
Interactive Discussion
EGU volatile organic product shifts toward the gas-phase as the saturation vapor pressure
of semi-volatile product increases with temperature (Pankow et al., 2001). Thus, the temperature difference may partially explain the higher SOA yield from ethylbenzene in our PAM chamber experiments, although a series of experiments in the PAM chamber at different temperatures are required to quantify this temperature effect.
5
The SOA yield of 0.07 from∆3-carene with NOx at chamber background levels was
lower than the low end of yields from previous studies, 0.18 (Griffin et al., 1999; Lee et al., 2006). Lee et al. (2006) observed higher SOA yield for ozonolysis than photo-oxidation for ∆3-carene. They observed a low caronaldehyde yield and a high SOA yield from ozonolysis, and a higher caronaldehyde yields and a lower SOA yield from 10
the photo-oxidation. The major difference between ozonolysis and photo-oxidation is the presence of OH radical. If the OH or HO2radical are responsible for the reduction
in SOA yield of∆3-carene by the formation of aldehydes, then the lower SOA yield in the PAM chamber may be due to higher OH/O3 and HO2/O3 ratios in the PAM cham-ber experiments compared to the large environmental chamcham-ber experiments of Lee et 15
al. (2006).
Another test of the feasibility of the PAM concept was to measure the potential aerosol mass of hydrocarbons that were added in known amounts to room air in the PAM chamber. If the SOA yields are additive, then the SOA yield calculated for the added hydrocarbon should equal the yield obtained by the addition of the same amount 20
of hydrocarbon in purified air. Room air was obtained from the pressurized room air passing through air compressor and the coarse particle filter. The relative humidity in the chamber was 10 to 14% due to the high pressure in the air compressor, and the NOx concentration varied day-to-day from 5 ppb to 25 ppb. All experiments were conducted in the low NOxcondition ([VOC]0/[NOx]0(ppbC/ppb)>15).
25
The SOA yields in room air and purified air were similar for some hydrocarbons and different for others. The SOA yield of ∆3-carene in room air was 0.26, which was 2 times greater than SOA yield 0.13 in purified clean air. The SOA yield of 1,3,5-TMB in room air was 0.19, which was also 1.7 times greater than SOA yield 0.11 in purified
ACPD
7, 9925–9972, 2007Introducing the concept of Potential Aerosol Mass (PAM)
E. Kang et al.
Title Page
Abstract Introduction
Conclusions References
Tables Figures
◭ ◮
◭ ◮
Back Close
Full Screen / Esc
Printer-friendly Version
Interactive Discussion
EGU clean air. SOA yields of m-xylene and p-xylene in room air were 0.16 and 0.11, which
were 1.6 times higher than SOA yields in purified air, 0.10 and 0.07, respectively. For other hydrocarbons, SOA yield in room air was similar to or only slightly higher than the SOA yield in purified clean air. For example, SOA yield ofβ-pinene in room air was 0.50, which was close to SOA yield in purified air, 0.48. SOA yields of cyclohexene and 5
toluene in room air was 0.19 and 0.13, and their SOA yields in purified air were 0.20 and 0.12 respectively. The total potential aerosol mass from room air without the added hydrocarbons did not exceed 10µgm−3, a value much smaller than typically observed from the added hydrocarbons.
A significant difference between room air and purified clean air could be the presence 10
of other precursor gases in room air that form seed aerosols. Different hydrocarbons were studied on different days. If the amount of gases that form seed aerosols were different from day-to-day, those differences could explain these results.
3.4 SOA yields from a hydrocarbon mixture ofα-pinene, m-xylene, and p-xylene
A recent study suggests that the large number of co-condensing semi-volatile gases 15
results in the formation of aerosol mass much greater than the expected sum of the yields of individual hydrocarbons (Volkhamer et al., 2006). If this enhancement is due to an increase in SOA yields in any common mixture of atmospheric hydrocarbons, then it would be possible to test this enhancement with experiments in the PAM chamber. For this experiment, the SOA yield of a hydrocarbon mixture ofα-pinene, m-xylene, 20
and p-xylene in a 1.00:1.25:1.25 ratio was measured and compared with the sum of the individual SOA yields.
To calculate the sum of the yields of the individual hydrocarbons, the yield of each individual hydrocarbon was measured as a function of total organic aerosol mass,Mo,
for the individual hydrocarbon:. 25
∆HCi ×Yi(MO)=Mi P
Mi=MO
ACPD
7, 9925–9972, 2007Introducing the concept of Potential Aerosol Mass (PAM)
E. Kang et al.
Title Page
Abstract Introduction
Conclusions References
Tables Figures
◭ ◮
◭ ◮
Back Close
Full Screen / Esc
Printer-friendly Version
Interactive Discussion
EGU We assume that the yield of any individual hydrocarbon depends on the total organic
aerosol mass, Mo, regardless of the origin of organic aerosol. Thus, to get the
esti-mated SOA mass of individual hydrocarbon species (Mi), the SOA yield value of each hydrocarbon corresponding to the total SOA mass in the mixture,Yi(Mo), was obtained from the individual yield curve in the Fig. 11, and multiplied to reacted hydrocarbon 5
concentration (∆HCi). The calculated mass,Mi, for all three hydrocarbons were then summed up to give the expected SOA mass,ΣMi, which could then be compared with
Mo, the total SOA mass measured in the mixture Eq. (8).
Four different hydrocarbon mixing ratios were used, although the mixture of the three hydrocarbons was constant (Table 2). In all four experiments,Mo was similar to P
Mi
10
within a factor of 1.3 or better. Thus, this mixture does not exhibit an enhancement in the SOA over what is expected from the individual hydrocarbon.
This conclusion is the same as reported by Odum et al. (1997). They observed good agreement ofMoandPMi for anthropogenic mixture containing toluene, xylene,
m-ethyltoluene, n-propylbenzene, 1,2,4-trimethylbenzene. Their experiments were per-15
formed in large environmental chamber using sunlight. Typical sunlight can produce up to 100 ppbv of O3, 0.2 pptv of OH, and 20 pptv of HO2daytime in urban area (Ren et al., 2006). Our PAM chamber is operated in highly oxidizing condition with more than 10 ppmv of O3, 300 pptv of OH, and 3 ppbv of HO2. While the oxidant mixing
ratios were 100 times larger than in either the large environmental chamber or the at-20
mosphere, the ratios of the oxidants were similar. Thus, the result obtained in the PAM chamber likely applies to the atmosphere.
This agreement also supports the argument of Seinfeld and Pankow (2003) that the SOA yield is only dependent on the organic mass concentration, and organic aerosols are not interacting each other in a mixture. However, the greater SOA yield observed 25
when acidic inorganic seed was present in the smog chamber indicates that the organ-ics are interacting with the inorganic acid to increase the SOA yield (Jang et al., 2002). More mixtures that include both inorganic and organic precursor gases will need to be tested in the PAM chamber to examine this synergistic effect on SOA yield.
ACPD
7, 9925–9972, 2007Introducing the concept of Potential Aerosol Mass (PAM)
E. Kang et al.
Title Page
Abstract Introduction
Conclusions References
Tables Figures
◭ ◮
◭ ◮
Back Close
Full Screen / Esc
Printer-friendly Version
Interactive Discussion
EGU The comparison of P
Mi toMo suggests that simultaneous measurements of PAM and all known volatile organic compounds can be used to test for unmeasured VOCs that can be oxidized to form SOA in the atmosphere during field studies. P
Mi might
be less thanMo for four possible reasons: unmeasured SOA-precursor VOCs; errors in the measurements of SOA-precursor VOCs; SOA yield values that are either incor-5
rect or not applicable to the atmospheric environment; and synergetic enhancement of SOA by co-condensing gases, such as the SOA yield increase on acidic seed aerosol. Examining these issues will require the simultaneous deployment of the PAM chamber, aerosol mass and chemical measurements, and measurement of all known precursor inorganic and organic atmospheric constituents in a field study.
10
3.5 Results from a preliminary field study
A first field test of PAM was conducted in September, 2006. The PAM instrument was installed in the Nittany Atmospheric Trailer and Integrated Validation Experiment (NATIVE) trailer at the Pennsylvania State University campus in the University Park, Pennsylvania. In the NATIVE trailer are measurements of SO2, NO, NOy, CO, O3, UV
15
radiation, relative humidity, temperature, pressure, and wind speed and direction. The PAM chamber was placed inside of the trailer and the inlet was located 1.8 m above the trailer roof. The gas sampling inlet was at the same height as the PAM chamber sampling inlet. It is possible to sample either ambient air containing aerosol particles or air run through a HEPA aerosol particle filter. By turning the UV light in the chamber 20
on and then offperiodically for both ambient air and aerosol-free air, the aerosol mass, potential aerosol mass, and sum of the two can all be measured by the PAM chamber and the TEOM instrument. However, for this preliminary study, only aerosol free air was sampled. The chamber was operated with a flow rate through the chamber of 10 L min−1and only one UV light, which produced 4 ppmv of ozone and about 400 pptv 25
ACPD
7, 9925–9972, 2007Introducing the concept of Potential Aerosol Mass (PAM)
E. Kang et al.
Title Page
Abstract Introduction
Conclusions References
Tables Figures
◭ ◮
◭ ◮
Back Close
Full Screen / Esc
Printer-friendly Version
Interactive Discussion
EGU experiments show that only 50% of the SO2was oxidized.
Examples of the PAM measurements come from two days, 6 September and 7 September (Fig. 12). The formation of secondary aerosol is shown in the shaded pe-riods when the chamber was irradiated with UV. Increases in measured aerosol mass occur every time the chamber is irradiated with UV light. Typically the increase was 5 to 5
10µgm−3. This potential aerosol mass appears to come from sources other than either SO2 or NOy. Unfortunately for this preliminary study, no hydrocarbon measurements were made and the origins of the potential aerosol mass could not be ascertained.
In some cases, a SO2 plume was sampled. The measured SO2 mixing ratio can
be converted into an expected sulfate aerosol mass by accounting for the partial 50% 10
conversion of SO2 to sulfate and using the calculated conversion ratio of 4.67µgm−3
(ppbv SO2)− 1
, which is appropriate for the 30% relative humidity at the TEOM mass transducer. For 6 September, the measured and calculated potential aerosol mass agreed to well within experimental uncertainties, indicating that in these air samples, the potential aerosol mass consisted only of SO2. However, on 7 September, the
15
potential aerosol mass measurement was 5 to 10µgm−3 greater than expected from SO2, indicating that the air masses containing SO2 on 7 September also contained other aerosol-forming gases. A comparison between the potential aerosol mass and NOysuggests that the additional potential aerosol mass was not due to NOy.
These results from this preliminary field test show the feasibility of the PAM concept 20
for ambient air. The PAM chamber conditions, while sufficient for this preliminary study, were not optimized. The many experiments that have been conducted since Septem-ber 2006 provide insight into the PAM chamSeptem-ber operating conditions and protocols that will give much better and much more information that was obtained then.
4 Conclusions
25
We have introduced the concept of Potential Aerosol Mass (PAM) and have performed experiments with inorganic and organic precursor gases to test its feasibility. These
ACPD
7, 9925–9972, 2007Introducing the concept of Potential Aerosol Mass (PAM)
E. Kang et al.
Title Page
Abstract Introduction
Conclusions References
Tables Figures
◭ ◮
◭ ◮
Back Close
Full Screen / Esc
Printer-friendly Version
Interactive Discussion
EGU experiments provide strong evidence that PAM is a viable concept. PAM measurements
can be made with a small, simple, flow-through chamber with a few minutes of exposure time in a highly oxidizing environment. The PAM chamber has two advantages over larger environmental chambers: negligible wall effects and the ability to complete the experiments in minutes, not hours.
5
We have demonstrated that the sulfate yield agrees to within 6% of theory. This agreement shows that the conversion of SO2 to sulfate can be complete even in a
chamber with only a few minutes of residence time. It also shows that the wall loss of sulfate aerosol particles in the PAM chamber is negligible.
The behavior of the SOA yields as a function of variables, such as temperature, 10
relative humidity, oxidant concentration, presence of NOx, precursor gas composition and amount, and the presence of acidic seed aerosol were generally comparable to the results found in large environmental chambers. Differences remain, possibly due to our inability to closely match the conditions in the large environmental chambers. However, the SOA yields disagree for different environmental chambers and even for 15
different years in the same chamber. Some of these differences are understood; some are not. Thus, the PAM SOA yields are validated by their general consistency with the SOA yields in the large bulk-type environmental chambers. At the same time, these new results complement those found in the large environmental chambers.
A novel aspect of the PAM chamber experiments is the direct measurements of the 20
oxidants O3, OH, and HO2 in the chamber. These direct measurements enabled the quantification of these oxidants as a function of UV light and relative humidity. As a result, the ratios can be varied by at least a factor of 10 in the range of oxidant ratios that are observed in the low-NOxtroposphere. This variability enables a careful examination of SOA formation and aging in both chambers and the atmosphere. 25