www.atmos-chem-phys.net/15/12267/2015/ doi:10.5194/acp-15-12267-2015
© Author(s) 2015. CC Attribution 3.0 License.
A qualitative comparison of secondary organic aerosol yields and
composition from ozonolysis of monoterpenes at varying
concentrations of NO
2
D. C. Draper1,a, D. K. Farmer2, Y. Desyaterik3, and J. L. Fry1 1Department of Chemistry, Reed College, Portland, OR, USA
2Department of Chemistry, Colorado State University, Fort Collins, CO, USA
3Department of Atmospheric Science, Colorado State University, Fort Collins, CO, USA acurrent address: Department of Chemistry, University of California Irvine, Irvine, CA, USA Correspondence to:J. L. Fry (fry@reed.edu)
Received: 25 April 2015 – Published in Atmos. Chem. Phys. Discuss.: 28 May 2015 Revised: 30 September 2015 – Accepted: 25 October 2015 – Published: 5 November 2015
Abstract. The effect of NO2on secondary organic aerosol
(SOA) formation from ozonolysis of α-pinene, β-pinene, 13-carene, and limonene was investigated using a dark flow-through reaction chamber. SOA mass yields were calculated for each monoterpene from ozonolysis with varying NO2
concentrations. Kinetics modeling of the first-generation gas-phase chemistry suggests that differences in observed aerosol yields for different NO2 concentrations are consistent with
NO3formation and subsequent competition between O3and
NO3 to oxidize each monoterpene. α-Pinene was the only
monoterpene studied that showed a systematic decrease in both aerosol number concentration and mass concentration with increasing [NO2]. β-Pinene and 13-carene produced
fewer particles at higher [NO2], but both retained moderate
mass yields. Limonene exhibited both higher number con-centrations and greater mass concon-centrations at higher [NO2].
SOA from each experiment was collected and analyzed by HPLC-ESI-MS, enabling comparisons between product dis-tributions for each system. In general, the systems influenced by NO3 oxidation contained more high molecular weight
products (MW>400 amu), suggesting the importance of oligomerization mechanisms in NO3-initiated SOA
forma-tion.α-Pinene, which showed anomalously low aerosol mass yields in the presence of NO2, showed no increase in these
oligomer peaks, suggesting that lack of oligomer formation is a likely cause of α-pinene’s near 0 % yields with NO3.
Through direct comparisons of mixed-oxidant systems, this work suggests that NO3is likely to dominate nighttime
ox-idation pathways in most regions with both biogenic and
anthropogenic influences. Therefore, accurately constraining SOA yields from NO3 oxidation, which vary substantially
with the volatile organic compound precursor, is essential in predicting nighttime aerosol production.
1 Introduction
Secondary organic aerosol (SOA) forms in the atmosphere from oxidized volatile organic compounds (VOCs) that are of low enough volatility to be able to partition into the con-densed phase. Aerosol directly affects Earth’s radiative bal-ance and also contributes to cloud formation, both of which have important climate forcing implications (IPCC, 2013). Aerosol is responsible for regional haze and has been shown to cause adverse cardiopulmonary health effects (Pope III et al., 1995; Davidson et al., 2005). SOA constitutes a large fraction of the total aerosol budget, but it is still poorly constrained in global chemical transport models, which un-derpredict ambient aerosol concentrations by 1 to 2 orders of magnitude (Heald et al., 2005, 2011). These models use laboratory-derived parameters, but uncertainty in precursors, detailed mechanisms, and mechanistic differences between chamber simulations and the real atmosphere result in the vast discrepancies between models and observations (Kroll and Seinfeld, 2008; Hallquist et al., 2009).
frac-α"pinene' β"pinene' Δ"carene' limonene'
Figure 1.Structures of monoterpenes used in this study.
tion of the uncertainty in model predictions of the SOA bud-get comes from uncertainty in how biogenic VOCs (BVOCs) form aerosol (Guenther et al., 1995; Middleton, 1995). Dif-ferent plant species emit difDif-ferent types and ratios of BVOCs, so the specific distribution of BVOCs emitted to the atmo-sphere is dependent on unique mixtures of vegetation and thus varies a great deal regionally. Monoterpenes are one such class of BVOC that is both widely emitted and has been shown in the laboratory to efficiently produce SOA (Gold-stein and Galbally, 2007; Sakulyanontvittaya et al., 2008; Griffin et al., 1999; Hallquist et al., 1999; Ng et al., 2006; Ehn et al., 2014; Hoyle et al., 2011). On average in the United States, α-pinene is the most dominant monoterpene emis-sion, butβ-pinene,13-carene, and limonene (Fig. 1) are also prevalent and are emitted equally or more than α-pinene in some regions (Geron et al., 2000).
While most VOCs are biogenic, the majority of atmo-spheric oxidants are anthropogenically sourced, and thus hu-man activity is highly influential on SOA production (Carl-ton et al., 2010; Hoyle et al., 2011; Xu et al., 2015). At night, most VOC oxidation in the troposphere occurs by way of ei-ther photolabile nitrate radical (NO3) or longer-lived ozone
(O3), which is photochemically produced but is not rapidly
and completely consumed at sundown as is the hydroxyl rad-ical (OH). The formation of both of these tropospheric oxi-dants requires NO2, nearly 90 % of which in the USA (64 %
globally) is estimated to come from anthropogenic sources (Reis et al., 2009). Organonitrates have been observed in ambient nighttime aerosol during multiple field studies (Fry et al., 2013; Rollins et al., 2012; Xu et al., 2015), consis-tent with NO3 oxidation, and NO3 initiated production of
aerosol organonitrates may even compete with photolysis of NO3during the day in some regions with high BVOC
emis-sions (Ayres et al., 2015). These observations are consistent with several laboratory studies that have found moderate to high aerosol yields from NO3oxidation (Griffin et al., 1999;
Hallquist et al., 1999; Fry et al., 2009, 2011, 2014; Spittler et al., 2006; Moldanova and Ljungström, 2000; Boyd et al., 2015), but this body of literature is comparatively small rel-ative to OH and O3oxidation studies.
Most chamber studies of NO3-derived SOA generate NO3
through the thermal dissociation of N2O5 in order to
min-imize the complexity caused by introducing a second
oxi-dant (Griffin et al., 1999; Hallquist et al., 1999; Fry et al., 2014). Fewer studies have been done using the atmospher-ically more relevant conditions of introducing both O3 and
NO2into the chamber to mimic this full range of nighttime
oxidation chemistry (Perraud et al., 2012; Presto et al., 2005; Boyd et al., 2015). Perraud et al. (2012) and Presto et al. (2005) both studied the effects of a range of NO2
concen-trations on dark ozonolysis ofα-pinene, and both observed that increased [NO2] suppresses aerosol formation. To our
knowledge, NO2 effects on dark ozonolysis have not been
systematically assessed for any other monoterpenes. Ozonol-ysis ofα-pinene has been previously observed to have high (14–67 %) aerosol yields (Hoffmann et al., 1997; Ng et al., 2006) but strikingly low (0–16 %) SOA yields with NO3
(Hallquist et al., 1999; Fry et al., 2014; Spittler et al., 2006). The observed aerosol suppression in the O3+NO2system is
consistent with the increased contribution of NO3at higher
[NO2]. However,α-pinene is the only monoterpene that has
been observed to have such drastic SOA yield discrepancies between the two oxidants (Ng et al., 2006; Yu et al., 1999; Hallquist et al., 1999; Fry et al., 2014), so it may not be rea-sonable to assume NO2has the same effect on other
monoter-penes.
Here we focus on the four most prevalently emitted monoterpenes in the US:α-pinene,β-pinene,13-carene, and limonene. Table 1 shows rate constants for NO3 formation
from NO2+O3 as well as each of the nighttime oxidants
with the monoterpenes used in this study. It is evident that the rates of O3loss to NO3production and BVOC oxidation are
comparable when [NO2] and [BVOC] are similar. Even
con-sidering its smaller ambient concentrations, NO3oxidation is
often much faster than O3oxidation, so it follows that NO3
oxidation should provide an important contribution to night-time aerosol formation in regions that are both biogenically and anthropogenically influenced. This work seeks to char-acterize the role of each competing nighttime oxidant over this broader range of monoterpenes and the influence of each on SOA formation.
2 Methods
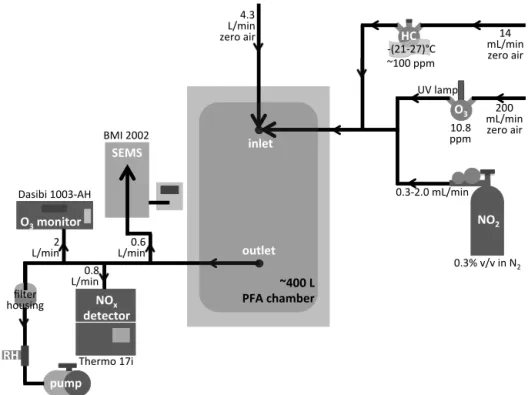
Unseeded SOA formation experiments were performed in a darkened∼400 L PFA film chamber, shown in Fig. 2, run in flow-through mode with precursors added continuously, giving a residence time of approximately 90 min. The set of experiments described in Table 2 measured the aerosol pro-duction from a single monoterpene oxidized by O3with
vary-ing concentrations of NO2added. In order to make
compar-isons across both the range of monoterpenes and the range of [NO2], the monoterpene source and O3source
concentra-tions were kept as constant as possible throughout the full study, allowing only the identity of the BVOC and the con-centration of NO2 to vary. While precursor concentrations
ob-Table 1.Rate constants at 298 K for NO2+ O3(Sander et al., 2011) and for both O3and NO3with selected monoterpenes (Atkinson and Arey, 2003).
k×1017 kO3×10
17 k
NO3×10
12
(cm3molec−1s−1) (cm3molec−1s−1) (cm3molec−1s−1)
NO2+ O3 3.2 – –
α-Pinene – 8.4 6.2
β-Pinene – 1.5 2.51
13-Carene – 3.7 9.1
Limonene – 21 12.2
served aerosol yields are likely not atmospherically relevant due to high-mass loadings and unrealistic radical fates, the ratios of [O3] : [NO2] ranging from 1:0.5 to 1:4 are
rep-resentative of ratios observable in the atmosphere from rel-atively clean sites (O3 dominated) to heavily polluted sites
(NO2dominated). Similarly, [NO2] : [BVOC] ranging from
approximately 1:1 to 2:1 is reasonable for relatively clean to relatively polluted sites, making comparisons between these conditions informative to aerosol formation in the real atmosphere.
O3(and NO2, when applicable) were introduced into the
chamber first and allowed to reach steady state prior to initi-ation of SOA forminiti-ation by BVOC injection. O3was
gener-ated by flowing zero air (Sabio Model 1001 compressed zero air generator) through a flask containing a Pen-Ray Hg lamp (primary energy at 254 nm) and was continuously measured from the outlet of the chamber using a Dasibi Model 1003-AH O3monitor. NO2was introduced from a calibrated
cylin-der (Air Liquide, 0.3 % by volume in N2) and monitored
us-ing a Thermo Model 17i chemiluminescence NOx/NH3
an-alyzer. Chemiluminescence NOx analyzers are sensitive to
any species that is converted to NO in the 350◦C Mb con-verter responsible for converting NO2to NO (Winer et al.,
1974; Grosjean and Harrison, 1985). Some of these addi-tional species include N2O5, peroxy nitrates (PNs), and alkyl
nitrates (ANs). At the high concentrations used in this study, these NOycontributions were significant. Kinetics modeling
of the oxidant stabilization period (described in the Supple-ment), corroborated by a characterization of oxidant stabi-lization using chemiluminescence NOxanalyzers and a
cav-ity ring-down spectrometer sensitive only to NO2, indicates
that we detected N2O5with approximately unit efficiency in
the NO2channel of the Thermo NOxanalyzer. The
sensitiv-ity of this NOxanalyzer to PNs and ANs, which would have
formed following BVOC addition, was not calibrated, but is expected to be near unity based on previous studies (Winer et al., 1974; Grosjean and Harrison, 1985). Modeling only the oxidant stabilization period, where NO2and N2O5were
likely the only species detected in the NO2channel, provided
the initial NO2concentrations shown in Table 2.
Once the oxidants stabilized, BVOC was introduced by flowing zero air over a small, cooled liquid sample of the
tar-get BVOC ((1R)-(+)-alpha-Pinene, TCI America,>95.0 %; (−)-beta-Pinene, TCI America,>94 %; (+)-3-Carene, TCI America, >90.0 %; (R)-(+)-Limonene, Aldrich, >97 %). The chiller temperature was held constant (±0.3◦C) during a single experiment and ranged from−27 to−21◦C for the different monoterpenes, based on the temperature-dependent vapor pressure that is calculated to give a mixing ratio of approximately 100 ppm in the source flask (Fig. S3 in the Supplement) (Haynes et al., 2012). Since vapor pressure data were unavailable for13-carene, it was estimated to reach the temperature-dependent vapor pressure at−25◦C –
be-tweenα-pinene andβ-pinene’s target temperatures – due to structural similarities. Online BVOC measurements were not available, but reacted BVOC was calculated from the ob-served decay of the oxidant in the kinetics model for each experiment. Methodology and uncertainties of this approach are described further in Sect. 3.2 and the Supplement.
Two methods were employed to measure the resulting aerosol loading and composition. Particle size distributions between 20 and 800 nm were measured at 85 s time resolu-tion with a scanning electrical mobility sizer (SEMS; BMI Model 2002) consisting of a differential mobility analyzer (BMI Model 2000C) coupled to a water condensation parti-cle counter (TSI Model 3781). Size-dependent aerosol loss rates to the chamber walls were characterized and used to correct size distributions to reflect the total aerosol num-ber and volume concentrations produced in each experi-ment (McMurry and Grosjean, 1985; VanReken et al., 2006; Fry et al., 2014). This methodology is described in further detail in the Supplement. Aerosol samples from each ex-periment were collected onto filters (47 mm quartz fiber). Each filter was extracted by sonication in 3:1 deionized water:acetonitrile to minimize solvent reactions with an-alyte compounds (Bateman et al., 2008), and the result-ing extract was analyzed offline by high-performance liquid chromatography–electrospray ionization–mass spectrometry (HPLC-ESI-MS).
inlet
outlet
NO2
O3
NOx detector
SEMS
O3 monitor
HC
RH
pump
~400 L PFA chamber
0.3‐2.0 mL/min 200 mL/min zero air 14 mL/min zero air ‐(21‐27)°C
4.3 L/min zero air
2 L/min
0.8 L/min
0.6 L/min
UV lamp
filter housing
0.3% v/v in N2 ~100 ppm
10.8 ppm
Thermo 17i BMI 2002
Dasibi 1003‐AH
Figure 2.Reed environmental chamber (REC) schematic for the experiments described here.
of an Agilent 1100 Series liquid chromatograph coupled to an Agilent LC/MCD TOF G1969A time-of-flight mass spec-trometer with an electrospray ionization source. The chro-matographic separation occurred on a Kinetex 100×3 mm C18 column with 2.6 µm particle size and a sample injection volume of 50 µL at a flow rate of 0.5 mL min−1. The electro-spray ionization system had a nebulizer gas pressure of 50 psi and an electrospray voltage of 3000 V. High mass resolution (m1m−1varies between 5000 atm/z118 amu to 15 000 at
m/z1822 amu) and chromatographic separation of the an-alytes allowed for straightforward identification of product molecular formulae (Desyaterik et al., 2013).
Between each experiment, the chamber was cleaned for at least 24 h by flushing with zero air and O3from the source
used during experiments until particle concentrations were at or below their typical background level (<1 µg m−3) and NO2 concentrations were below 5 ppb. Particle formation
was never observed while O3and NO2 were stabilizing for
a new experiment, indicating that any traces of BVOC from the previous experiment had been sufficiently removed from the chamber.
3 Results and discussion
3.1 Aerosol formation trends
Raw number and volume concentration time series are pre-sented in Fig. 3. These comparisons are not directly indica-tive of relaindica-tive yields due to differences in initial
monoter-pene concentrations shown in Table 2 (see Sect. 3.2 for fur-ther discussion of aerosol mass yields). However, these com-parisons nicely illustrate the vast diversity of the behavior of each monoterpene with respect to systematically chang-ing oxidant conditions, from O3 dominated to NO3
domi-nated.α-Pinene exhibits a decrease in both the total number of particles produced (Ntot) and total aerosol volume
pro-duced (Vtot) with increasing NO2, consistent with the
find-ings of other studies (Perraud et al., 2012; Presto et al., 2005). β-Pinene and13-carene both exhibit a similar decrease in Ntot with addition of NO2 as α-pinene, but at early times
in the reaction, the addition of NO2appears to enhance
vol-ume growth relative to the O3-only experiment. Limonene
exhibits enhancement in bothNtotandVtot with addition of
NO2. While all three of the monoalkene monoterpenes
pro-duce fewer particles at higher [NO2],α-pinene is the only
terpene for which the aerosol production seems to be sys-tematically depleted with the addition of NO2.β-Pinene and
13-carene, in contrast, seem to level off at comparableNtot
values for the intermediate range of [NO2]. All four
monoter-penes exhibit suppression of aerosol formation at the highest [NO2] studied, which is likely the result of RO2+NO2
chem-istry becoming kinetically dominant at such high concentra-tions and producing metastable, less condensable peroxy ni-trate products (Barthelmie and Pryor, 1999).
3.2 SOA yields
Table 2.Conditions for each chamber experiment.
Experiment no. Date [BVOC]i* [O3]i [NO2]i* RH Temp Notes
(ppb) (ppb) (ppb) (%) (K)
α-Pinene
1 12/19/12 780 485 – 33 294 a
2 1/5/13 680 490 – 20 295 f
3 1/16/13 590–715 480 510 24 294 a, c
4 1/18/13 780–960 480 840 22 295 a, d
5 1/14/13 ∼300 480 1400 22 294 b, e
β-Pinene
6 1/7/13 370 485 – 40 295 a
7 1/23/13 470–680 480 530 23 295 a, c
8 1/25/13 650–1100 480 910 40 295 a, b, d
9 1/21/13 ∼300 480 2000 20 295 b, e
1-Carene
10 1/9/13 220 470 – 30 294 a
11 3/9/13 250–340 470 290 27 295 a, c
12 3/13/13 400–650 470 590 38 295 a, d
13 2/6/13 ∼300 470 900 33 295 b, e
Limonene
14 1/11/13 470 485 – 20 295 a
15 3/23/13 340–400 470 360 20 295 a, c
16 3/27/13 470–560 470 720 31 295 a, d
17 3/21/13 ∼300 465 1000 26 295 a, b, e
* Values calculated using kinetics model.aSOA filter sample collected and analyzed by HPLC-ESI-MS.b[BVOC] estimated according to flow rate and temperature-dependent vapor pressure within source flask.cDesignated “low NO2.” dDesignated “medium NO
2.”eDesignated “high NO2.”fExperiment included to show reproducibility of chamber.
the framework of aerosol mass yields can still be used to compare aerosol formation trends between each experiment while accounting for differing initial hydrocarbon concen-trations as well as differing aerosol mass loadings for each experiment. Unitless aerosol mass yields (Y) are defined as the aerosol mass produced per hydrocarbon mass consumed (Y =1M/1HC). Since the hydrocarbon was not measured online during experiments, 1HC values were determined using the gas-phase kinetics model described in detail in the Supplement. The modeled cumulative concentration of monoterpene reacted was converted to 1HC in µg m−3 us-ing the molecular weight of monoterpenes (136.23 g mol−1).
In the model,1HC is calculated based on how much of each oxidant reacts with the monoterpene. However, NO3can also
react with subsequent RO2radicals, thus depleting the
con-centration available to react directly with BVOC. The rate constant used for RO2+NO3(2×10⁻¹²cm3molec−1s−1)
is reasonably well known and constant over a range of RO2
structures (1.8±1.5×10⁻¹²cm3molec−1s−1 for C2 - C6
RO2) (Vaughan et al., 2006). The rate constant for RO2 +
RO2, the main competing RO2sink, is far more variable over
RO2structures, though, so the “best estimate” employed in
this study spans 3 orders of magnitude (described further in
Supplement). Therefore,kRO2+RO2 is the largest source of uncertainty in1HC, and aerosol yield ranges are calculated spanning the minimum (10−15cm3molec−1s−1) and max-imum (10−12cm3molec−1s−1) values used. Because O3is
not expected to react with RO2(whereas NO3does),1HC
from the O3-only experiments does not vary in response to
shiftingkRO2+RO2values.
1Mwas determined by converting the wall-loss-corrected aerosol total volume data to mass, assuming a SOA density of 1.4 g mL−1(Hoyle et al., 2011). Uncertainty in1Mwas estimated using replicate measurements ofα-pinene +O3
β-α"pinene!! β"pinene(( Δ"carene( limonene(
101 102 103 104 105
T
ot
a
l
P
a
rt
ic
le
s
(
#
c
m
-3 )
107 108 109 1010 1011
T
ot
a
l
Vol
u
me
(
n
m
3 cm -3 )
1.2 0.8 0.4 0.0
Hours From Start
1.2 0.8 0.4 0.0
Hours From Start
1.2 0.8 0.4 0.0
Hours From Start
1.2 0.8 0.4 0.0
Hours From Start O3only low NO2 med NO2 high NO2
Figure 3.Raw total number concentrations (Ntot) and total volume concentrations (Vtot) at each NO2concentration for each monoterpene studied, not corrected for wall losses.
pinene+O3+NO2experiments, the aerosol growth rapidly
exceeded the size range of the SEMS (20–800 nm). Aerosol data presented here are truncated as soon as the size distri-bution begins to exceed the range of the SEMS instrument resulting in these experiments “ending” at quite low mass loadings before the yield curves have flattened.
A variety of factors may contribute to the absolute numer-ical values of these yields differing from yields reported in the literature. For example, vapor-phase wall losses were not accounted for (Zhang et al., 2014), and the chamber size, mixing, and conditioning of walls differ from other studies. Since these experiments were conducted without seed parti-cles, rather than having a constant particle distribution for va-pors to condense onto, size distributions emerged as freshly nucleated particles that proceeded through full growth curves until they exceeded the range of the SEMS and eventually were removed through the constant outflow of the chamber. This combination of growth and dilution led to an oscilla-tory behavior of periodic full growth curves as the conden-sational sink was changing, thus preventing a true steady state from ever being achieved. The yield curves shown in Fig. 4 highlight a single growth curve for each experiment, but these yields may be more indicative of kinetically limited growth than thermodynamic partitioning, causing them to differ from other studies. Additionally, and perhaps most im-portantly, the chemistry itself (including both first-generation oxidation and peroxy radical fate) is expected to differ sub-stantially in these mixed oxidant conditions compared to sin-gle oxidant studies in the literature. With all of those factors in mind, the precision reflected in the error ranges in Fig. 4 gives us confidence that the relative yield comparisons be-tween individual experiments in this study are robust.
Figure 4 enables yield comparisons at comparable mass loadings and also accounts for the fact that each experiment began with somewhat variable BVOC concentrations. We still see similar trends as were observed in theVtotpanels of
Fig. 3. Figure 4 illustrates that increasing [NO2] substantially
depletes aerosol formation fromα-pinene, whereasβ-pinene and13-carene have comparable yields over the full range of oxidant conditions, and limonene exhibits enhancement of aerosol formation at higher [NO2]. It should be noted that
yield calculations were only performed on the O3-only and
lowest two [NO2] studied for each monoterpene due to
diffi-culties in reliably reproducing1HC in the kinetics model for the highest [NO2] experiments. The model is constrained
us-ing the observed O3decay, but these high NO2experiments
react nearly all the BVOC by way of NO3, leaving the O3
de-cay nearly unaffected. Furthermore, we expect the full dura-tion of these experiments to be kinetically dominated by the RO2+NO2reservoir (peroxy nitrates), thus hindering SOA
production. For these reasons, the high NO2experiments are
not included in yield comparisons.
3.3 Individual oxidant contributions
Gas-phase kinetics modeling of the steady-state conditions in the chamber yielded the time series of relative O3 and
NO3(and OH) contributions to BVOC oxidation. Since each
experiment starts with O3, NO2, NO3, and N2O5 at their
equilibrium concentrations, initial BVOC oxidation will be dominated by NO3, which reacts orders of magnitude faster
than O3 (Table 1). Eventually, as concentrations of
precur-sors change over time, rates to each oxidant change and O3
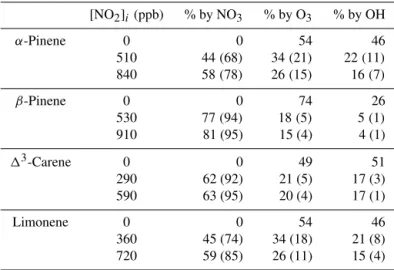
sta-Table 3.Percentage of total BVOC reacted by each oxidant at 2 h into each experiment. In the model, OH is produced from stabilized Criegee intermediates from ozonolysis at the following ratios: α-pinene =0.85; β-pinene=0.35; 13-carene=1.06; limonene = 0.86 (Atkinson et al., 1992). Values from NO2-containing experiments include two values expressed as low/high where “low” denotes the lower RO2+RO2rate constant limit (10−15cm3molec−1s−1) and “high” denotes the upper limit (10−12cm3molec−1s−1) as described in the Supplement.
[NO2]i (ppb) % by NO3 % by O3 % by OH
α-Pinene 0 0 54 46
510 44(68) 34(21) 22(11)
840 58(78) 26(15) 16(7)
β-Pinene 0 0 74 26
530 77(94) 18(5) 5(1)
910 81 (95) 15 (4) 4 (1)
13-Carene 0 0 49 51
290 62 (92) 21 (5) 17 (3)
590 63 (95) 20 (4) 17 (1)
Limonene 0 0 54 46
360 45 (74) 34 (18) 21 (8)
720 59 (85) 26 (11) 15 (4)
bilized Criegee intermediates from ozonolysis according to the monoterpene-dependent yields found in Atkinson et al. (1992) and described in the Supplement. The timing and rel-ative contribution of O3depends on the relative rate constants
of O3and NO3with each monoterpene and thus the influence
of each oxidant varies for all conditions tested.
This feature of staggered oxidant contributions is con-venient to test the hypothesis that observed yield differ-ences between different oxidant conditions applied to a sin-gle monoterpene can be attributed to distinct contributions from NO3 and O3 oxidation. For β-pinene (Fig. 5), 13
-carene (Fig. S8), and limonene (Fig. S8), the fact that any aerosol mass is observed during the beginning of the NO2
experiments when oxidation exclusively goes by way of NO3
indicates that qualitative yield differences relative to the O3
experiment can be attributed at least in part to NO3
oxida-tion products. In contrast, Fig. 5 shows that neither of the α-pinene experiments with NO2 produce any aerosol mass
until O3 starts to contribute. This observation is consistent
with the hypothesis that the observed suppression of aerosol formation from α-pinene with increasing concentrations of NO2can be attributed to its (near) 0 % yield with NO3
ob-served in other studies (Hallquist et al., 1999; Spittler et al., 2006; Fry et al., 2014).
Forβ-pinene,13-carene, and limonene, while it is clear that aerosol mass forms from NO3 oxidation products in
the NO2 experiments, a time lag becomes apparent during
which BVOC is reacting but no aerosol is formed. As soon as aerosol formation is initiated, however, the mass rapidly increases. The kinetics model used in this study assumes three options for RO2fate: reaction with RO2, NO3, or NO2.
In Sect. 3.1, we propose that high NO2 experiments yield
low mass concentrations due to the formation of less
sta-ble peroxy nitrates. This explanation likely accounts for the lag time observed in each NO2experiment before aerosol is
able to form. Indeed, from the model we can calculate a ra-tio of RO2+NO2products relative to the sum of RO2+RO2,
RO2+NO3, and RO2+NO2products present in the chamber
at each time in the experiment. When this ratio time series is overlaid onto the plots in Fig. 5, a minimum in RO2+NO2
products appears at approximately the same time that aerosol formation is initiated. This timing, shown in Fig. 5 and Fig. S8, indicates that even the low NO2experiments have
enough NO2present that formation of relatively volatile
per-oxy nitrates may kinetically dominate experiments at early times until RO2+RO2and RO2+NO3products start to
com-pete.
The percentage of BVOC reacted by each of the three oxidants was modeled and is shown in Table 3. Compar-isons were made 2 h into the reaction after the initial buildup of NO3 and N2O5 was depleted and chemical production
of NO3 more realistically competes with O3 oxidation of
BVOCs. Even at this point in time, NO3dominates the
ini-tial oxidation pathway for all NO2 concentrations and all
monoterpenes, further indicating that if NO3oxidation
con-tributes to SOA mass, as is certainly the case forβ-pinene, 13-carene, and limonene, these NO3oxidation products are
plentiful enough throughout the full experiment to contribute significantly to observed yield differences between those ex-periments relative to the O3-only experiments.
3.4 Bulk SOA composition
1.0
0.8
0.6
0.4
0.2
0.0
Yield
O3 only low NO2 med NO2
α"pinene'' β"pinene''
Δ"carene' limonene'
1.0
0.8
0.6
0.4
0.2
0.0
Yield
1.0
0.8
0.6
0.4
0.2
0.0
Yield
1.0
0.8
0.6
0.4
0.2
0.0
Yield
400 300
200 100
0
∆M (µg m-3) 1.0
0.8
0.6
0.4
0.2
0.0
Yield
400 300
200 100
0
∆M (µg m-3) 1.0
0.8
0.6
0.4
0.2
0.0
Yield
400 300
200 100
0
∆M (µg m-3)
400 300
200 100
0
∆M (µg m-3)
400 300
200 100
0
∆M (µg m-3)
400 300
200 100
0
∆M (µg m-3)
Figure 4.Yield vs.1M for each experiment.1M is corrected for wall losses (described in Supplement). Uncertainty ranges on yields arise from a constant 15 % relative error on1M calculated based on two replicate experiments, propagated with modeled1HC values using the range of 10−15to 10−12cm3molec−1s−1forkRO2+RO2 for the low and medium NO2experiments for each monoterpene. O3
-only experiments do not have an analogous1HC uncertainty range since all O3was assumed to react with the monoterpene directly, so uncertainty range on these traces is based exclusively on1M.
Colorado State University. Because electrospray ionization is a soft ionization technique, this method has been shown to be especially useful for detecting a wide range ofm/z prod-ucts – including oligomer species that are likely to be sig-nificant SOA constituents (Walser et al., 2008; Surratt et al., 2006; Doezema et al., 2012). Although quantitative compar-isons of products are not possible due to differences in mass loadings and a lack of calibration standards, qualitative dif-ferences in product distributions were readily apparent and consistent with observed aerosol yield trends.
Introducing NO2 into ozonolysis of monoterpenes
influ-ences the composition of resulting SOA in two different ways: first, by forming NO3that can either oxidize BVOC
directly or react with NO3- or O3-initiated RO2, or second,
by directly reacting with RO2or other products and reaction
intermediates as NO2. A visual comparison of the total ion
chromatograms from ozonolysis of β-pinene with no NO2
and the two lowest concentrations of NO2 (Fig. 6) shows
that several new products form once NO2is added, and that
in general increasing [NO2] simply increases the intensity of
those products rather than changing product identities sub-stantially. For ease of interpretation, results from all of the NO2-containing experiments were combined into a single
product distribution from “NO3-influenced oxidation.” We
can then compare those product distributions to those of the O3-only experiments. A complete list of compound
formu-lae detected (>1.5 % relative intensity, see Supplement) in the O3 and NO3dominated oxidation of each monoterpene
is compiled in Table S2.
To best highlight qualitative differences in the identity of molecules that make SOA for each set of precursors, every unique compound (distinct either in mass, retention time, or both) was accounted for once, not normalized by peak inten-sity. A variety of average bulk composition parameters were calculated for each experiment, highlighted in Table 4, in-cluding average number of C, O, and N atoms per compound, molecular weight, and total number of products. Some ar-tifacts may remain in this data set, such as impurities not captured by the background subtraction or product fragments that do not reflect the original identity of the SOA product. The former should affect all samples uniformly in this anal-ysis and thus will not influence qualitative comparisons, and the latter will either affect multiple samples and thus be irrel-evant in comparisons or only affect single samples and thus still provide interesting qualitative differences.
A direct correlation between any of the average param-eters (MWavg, Cavg, Oavg, Navg) in Table 4 and absolute
aerosol yields is not obvious.α-Pinene ozonolysis, for exam-ple, produced the highest aerosol mass of all the conditions tested, and while its average MW and number of C atoms are higher than ozonolysis from all the other monoterpenes, those same values are comparable to each of the NO3
experi-ments and substantially lower than those values for limonene +NO3. However, the difference in average values, defined
as the difference in each average parameter between O3and
NO3dominated oxidation for each monoterpene (1avg), are
consistent with O3vs. NO3yield comparisons.β-Pinene and
4000 3000 2000 1000 0 100 80 60 40 20 0
Minutes From Start
40 30 20 10 0 1.0 0.5 0.0 4000 3000 2000 1000 0 100 80 60 40 20 0
Minutes From Start
120 80 40 0 1.0 0.5 0.0 4000 3000 2000 1000 0 ∆ HC ( µ g m -3 ) 100 80 60 40 20 0 ∆ M (µg m -3 ) 1.0 0.5 0.0 4000 3000 2000 1000 0 160 120 80 40 0 1000 800 600 400 200 0 4000 3000 2000 1000 0 4000 3000 2000 1000 0 ∆ HC ( µ g m
-3 ) 150
100 50 0 ∆ M (µg m -3 ) 1.0 0.5 0.0 α‐pinene
O3 only
low NO2
med NO2
β‐pinene
O3 only
low NO2
med NO2
VOC consumed by (Modeled):
NO3 OH O3 TOTAL
peroxynitrate ratio
Total Aerosol Mass (Measured)
Figure 5.Time series of wall-loss-corrected aerosol mass (right axis) and VOC consumed by each oxidant (left axis) forα-pinene andβ -pinene at 0 (“O3-only”), low, and medium NO2concentrations, highlighting how much aerosol is produced at times dominated by NO3 oxida-tion (shaded regions).1HC values shown are the lower limits calculated using the lowest RO2+RO2rate constant (10−15cm3molec−1s−1), which gives the low limit on how much NO3 reacts with VOC directly. Dashed grey traces (inner left grey axis) represent the ratio of RO2+NO2products that are present in the chamber (instantaneous concentration) relative to the sum of the instantaneous concentrations of RO2+RO2, RO2+NO3, and RO2+NO2products. This ratio is a representation of the time dependence of peroxy nitrate formation in the chamber.
well as similar absolute values for each oxidant condition), suggesting that the addition of NO3affects the product
dis-tribution of these two monoterpenes similarly. The1avg
val-ues for limonene are much higher than any other monoter-pene in this study, consistent with it having the highest NO3
aerosol yields. Again, perhaps most notably, the1avg
param-eters hover near 0 forα-pinene, suggesting that the aerosol composition does not differ much between the two oxidants – consistent with all ofα-pinene’s aerosol production coming exclusively from O3oxidation.
To illustrate some of the finer detail of these product dis-tributions, Fig. 7 shows histograms where each observed product is binned by compound mass in 50 amu intervals. Every experiment shows some contribution from oligomer products (m/z >246 according to Perraud et al. (2010); >300 according to Walser et al., 2008), but this contribu-tion is most pronounced from NO3 oxidation of β-pinene,
13-carene, and limonene. In particular, we observe substan-tially more distinct products>400 amu fromβ-pinene,13 -carene, and limonene with the O3/NO2/NO3mixture than
from O3 alone. In this region, the mass distributions for
α-pinene in both oxidant conditions are identical. Since mass is an important contributing factor to volatility (e.g., Donahue et al., 2011), these high-mass products are likely important in aerosol formation and growth and thus may be
explana-tory of the observed yield differences from NO3oxidation. If
oligomerization is an important pathway leading to SOA for-mation and growth from NO3-initiated chemistry,α-pinene’s
lack of oligomer products with NO3may be responsible for
its 0 % aerosol yield. In contrast, comparison of the four O3
-only histograms shows relatively small contributions of high MW oligomers for any monoterpene, in spite of quite high aerosol yields in some cases, indicating that aerosol forma-tion by ozonolysis may not require oligomerizaforma-tion.
Recent studies of SOA nucleation and growth from ozonolysis of α-pinene have shown that highly oxidized and/or oligomeric species are likely important in nucleation and early growth, but that growth beginning around 20 nm is dominated by lower MW products (140–380 amu) (Zhao et al., 2013; Winkler et al., 2012). This latter MW range is consistent with the ozonolysis products we observe for all four monoterpenes, indicating that high MW products may dominate only early stages of growth and are thus not de-tectable at the high-mass loadings in this study. NO3
oxi-dation, however, seems to provide a weaker source of low volatility compounds contributing to nucleation and early growth, as seen in the decrease ofNtotwith increasing [NO2]
ozonol-800x103
700
600
500
400
300
200
100
0
C
ou
n
ts
20 18 16 14 12 10 8 6 4 2 0
Retention Time (min)
impuri&es)
O O
ONO
2
ONO
2
OH
O O
OH O
O
O
ONO
2 OH
O2NO OH
HO
OH O2NO O
&)isomers) O
OH ONO2
O
O O2NO ONO2
impuri&es) &)isomers)
OH) O)
O) O)
OH)
O)
O)
O) ONO2)
O2NO) OH)
O2NO) ONO2)
HO) OH)
O2NO)
O2NO)
OH) O)
O) O)
O) O)
O2NO) ONO2)
HO)
O3)only)
low)NO2) med)NO2)
Figure 6.Comparison of chromatograms from HPLC-ESI-MS samples of SOA derived fromβ-pinene ozonolysis with 0 (bottom), 530 (middle), and 910 ppb NO2(top). Chromatograms are annotated with speculative structures corresponding to the assigned molecular formulae of the most intense peaks. Proposed structures are listed in Table S3 based on products observed in other studies.
α"pinene'' β"pinene''
Δ"carene' limonene'
20
15
10
N
u
mbe
r
of
A
s
s
ig
n
e
d
F
or
mu
la
e
20
15
10
5
0
O3 only
O3 + NO2
20
15
10
5
0
400 300 200 100
Mass
400 300 200 100
Mass
Figure 7.Histograms of each O3vs. NO3(O3+NO2) regime for each monoterpene showing the number of compounds (left axis) in each 50 amu mass bin (bottom axis).
ysis (with the exception ofα-pinene), as seen in Fig. 4. Fur-ther supporting this observed difference in products from ozonolysis compared to NO3 oxidation is the difference in
the reaction rate of each process. O3+BVOC is much slower
than NO3 + BVOC, which means that RO2 is produced
more slowly from ozonolysis and thus the RO2 lifetime is
much longer with respect to other radical species. Longer RO2lifetimes are more conducive to isomerization processes
like autoxidation (Crounse et al., 2013; Jokinen et al., 2014), which may be responsible for the initial high MW nucleat-ing species observed in other ozonolysis studies. In contrast, NO3oxidation produces RO2 much more rapidly, therefore
increasing the likelihood of RO2+RO2oligomerization.
Mass spectra alone provide limited compositional infor-mation since they do not distinguish between different func-tional groups. However, in this system, one funcfunc-tional group that can be easily parsed out of the data is the nitrate group. From the NO3initiated oxidation chemistry, we expect that
any nitrogen present in a molecule is a part of a nitrate func-tional group. (Some instances of−NO and−ONO have been found in the compound list, causing relatively highNavg
val-ues forα-pinene+O3, for example, where we expect any
nitrogen is due to impurities.) The1avgvalues in Table 4 for
Navgprovide an approximate estimate of relative aerosol
or-ganic nitrate yield.β-Pinene, 13-carene, and limonene all exhibit a substantial increase in average number of N per molecule with the addition of NO2, consistent with the
rela-tively high organic nitrate yields observed from NO3
oxida-tion of those species in other studies (Fry et al., 2014; Hal-lquist et al., 1999).α-Pinene produces comparatively fewer nitrogen-containing SOA products in the presence of NO2.
While the organic nitrate products from α-pinene may be relatively volatile and thus not partition appreciably into the aerosol phase, it is clear that this is not a universal charac-teristic of C10organic nitrates, as many do partition into the
aerosol phase for all three other monoterpenes studied – even those with relatively low total aerosol mass loading.
We note that the products observed here from ozonolysis vs. NO3oxidation are consistent with proposed mechanisms
Table 4.Average (±1 standard deviation) molecular weight, number of C, O, and N atoms, O/C, and total number of products identified by HPLC-ESI-MS analysis of aerosol collected from O3and NO3(O3+NO2+ NO3) oxidation of each monoterpene studied. The difference in average value for each parameter (1avg) from each oxidation scheme was also tabulated for each monoterpene.
α-Pinene β-Pinene
O3 NO3 1avg O3 NO3 1avg
MWavg 237.6±86.9 233.9±81.0 −3.7 212.0±88.9 249.3±104.3 37.3
Cavg 13.8±5.4 13.2±5.0 −0.6 12.0±4.5 12.7±4.7 0.7
Oavg 2.9±1.6 3.1±1.7 0.2 2.9±2.1 4.2±2.6 1.3
Navg 0.29±0.53 0.40±0.58 0.11 0.14±0.36 0.74±0.73 0.60
O/C 0.22±0.11 0.25±0.14 0.03 0.23±0.12 0.32±0.16 0.09
# ID’d 28 43 15 29 66 37
1-Carene Limonene
MWavg 191.7±56.9 232.1±111.5 40.4 216.9±81.2 306.5±128.6 89.6
Cavg 11.0±3.1 12.4±4.7 1.4 12.3±4.2 14.7±4.8 2.4
Oavg 2.4±1.2 3.6±3.0 1.2 2.9±1.8 5.9±4.0 3.0
Navg 0.09±0.30 0.41±0.67 0.32 0.18±0.46 0.94±1.06 0.76
O/C 0.22±0.11 0.27±0.14 0.05 0.23±0.13 0.39±0.23 0.16
# ID’d 32 70 38 34 85 51
2.5
2.0
1.5
1.0
0.5
0.0
ppb
2.5
2.0
1.5
1.0
0.5
0.0
ppb
NO2
Total Monoterpenes
[NO2]/[a-pinene]
[NO2]/[b-pinene]
[NO2]/[d-carene]
[NO2]/[limonene]
a-pinene threshold [
[ [ [ a
[NO2]/[limonene]
a-pinene threshold b-pinene threshold d-carene threshold limonene threshold
BEACHON(RoMBAS-(2011)-
SOAS-(2013)-24 20 16 12 8 4 0
Hour of Day 16
12
8
4
0
[N
O2
]/[BVOC
]i
i
=
a
pin
or
bpin
or
dc
a
r
10
8
6
4
2
0
[N
O2
]/[BVOC
]i
i
=
a
pin
or
bpin
24 20 16 12 8 4 0
Hour of Day
50
40
30
20
10
0
-10
[N
O
2
]/[BVOC
]
limo
Figure 8.Diurnal average NO2and monoterpene concentrations (top panels) are shown for two field campaigns: BEACHON-RoMBAS 2011 (left panels) and SOAS 2013 (right panels) which both occurred at heavily biogenically influenced sites. The bottom panels show the diurnally averaged [NO2]/[BVOC] ratios for the speciated monoterpenes used in this study. The speciated monoterpenes for BEACHON-RoMBAS are estimated as being 1:1:1α-pinene:β-pinene:13-carene; hence, each BVOC concentration is assumed to be a third of total measured [BVOC]. Shaded regions indicate nighttime hours.
(Wangberg et al., 1997; Perraud et al., 2010), some of which have been included in Fig. 6 to highlight relative intensities across different NO2 conditions. Several more speculative
structures are shown in the Supplement to indicate that ob-served oligomeric masses can be reasonably achieved from dimers of first-generation oxidation products.
4 Implications: determination of dominant nighttime oxidant using NO2to BVOC ratio
Using literature rate constant data (Table 1), we can approx-imate the NO2/BVOC regime where NO3 will dominate
nighttime oxidation for each monoterpene. Since O3
Table 5. Minimum [NO2]/[BVOC] value reported for each monoterpene studied at which NO3is expected to dominate night-time oxidation.
BVOC [NO2]/[BVOC]
α-Pinene 2.6
β-Pinene 0.47
13-Carene 1.2
Limonene 6.6
for all monoterpenes NO3oxidation is much faster than O3
oxidation, we assume that once NO3 production becomes
faster than O3oxidation of BVOC (Eq. 1), NO3becomes the
dominant oxidant. The ratio of NO2/BVOC at which this
crossover occurs, defined in Eq. (2), is calculated for each monoterpene and reported in Table 5.
k(O3+NO2)[O3][NO2]> k(O3+BVOC)[O3][BVOC], (1) [NO2]
[BVOC]>
k(O3+BVOC) k(O3+NO2)
. (2)
This calculation leaves out factors like competing sinks for NO3and is thus a very crude approximation. Nevertheless, it
is noteworthy how small the magnitude of these ratios are. Figure 8 shows diurnally averaged NO2 and bulk
monoter-pene concentrations from two field campaigns: BEACHON-RoMBAS in 2011, which took place in a remote montane forested location in the Rocky Mountain front range (Fry et al., 2013), and SOAS in 2013, which took place in a rural subtropical forest region in central Alabama (Ayres et al., 2015). Across both of these campaigns, NO2and total
monoterpene diurnal concentrations were qualitatively and quantitatively similar. For the BEACHON-RoMBAS cam-paign, we assume that the average monoterpene distribu-tion was 1:1:1 α-pinene:β-pinene:13-carene (Fry et al., 2013), whereas at SOAS we have explicit speciated monoter-pene measurements. For each campaign, we calculated the average diurnal cycle of [NO2]/[BVOC] using speciated
monoterpene concentrations. The dashed lines indicate the minimum calculated threshold from Table 5, above which NO3 oxidation is expected to dominate over O3 oxidation.
The shaded nighttime portions of Fig. 8 show measured aver-age [NO2]/[BVOC] ratios exceeding the minimum
thresh-old at all times during the BEACHON-RoMBAS campaign and at all times forβ-pinene and limonene at SOAS as well as part of the night forα-pinene at SOAS.
These ratios are expected to be even higher in regions with stronger anthropogenic influences. This analysis sug-gests that NO3 is not only a relevant contributor to
night-time oxidation chemistry, it may actually dominate oxidation pathways in many regions. The consequence of this NO3
-dominant oxidation chemistry for SOA formation downwind of large NOxpoint sources (coal-fired power plants) has been
recently investigated (Fry et al., 2015), showing spatial
pat-terns of predicted SOA production that depend substantially on the forest surrounding the point source. The present study expands on this thinking to include further downwind regions where O3and NO3begin to compete. If NO3contributes
sig-nificantly to oxidation pathways in ambient air over a wide range of NO2concentrations, the fact that each monoterpene
displays vastly different aerosol yields from NO3vs. O3
ox-idation and that this difference differs among monoterpenes becomes essential to accurately predicting aerosol formation in different regions.
5 Conclusions
This work adds to the growing body of monoterpene aerosol yield comparison literature suggesting that monoterpene ox-idation has widely varying aerosol yields depending on the specific monoterpene and oxidant combination (Fry et al., 2014; Griffin et al., 1999; Hallquist et al., 1999; Ng et al., 2006; Glasius et al., 2000; Yu et al., 1999; Lee et al., 2006). We therefore conclude, first and foremost, that there is no single “representative” monoterpene. Furthermore, the monoterpene most often considered representative of BVOC oxidation, α-pinene, presents here as the greatest anomaly with respect to aerosol formation, showing higher ozonoly-sis aerosol mass yields than even limonene, and behaving in a way consistent with 0 % aerosol yields from reaction with NO3.
We show that under the influence of NO3,α-pinene
pro-duces comparatively few condensed-phase organic nitrates and oligomers with respect to the other three monoterpenes studied. This finding is consistent withα-pinene’s negligible aerosol yield with NO3and also suggests more generally that
oligomers and multifunctional organic nitrates are important products leading to SOA formation from NO3. Additionally,
the difference in product distributions between O3and NO3
oxidation for all monoterpenes studied (exceptα-pinene) in-dicates that each oxidant broadly employs a different mecha-nism toward condensable products – O3likely nucleates and
grows enough aerosol mass early in the reaction that sub-sequent condensation is governed by comparatively small molecular weight species, whereas NO3 produces less
ex-tremely low-volatility material early but produces oligomers consistently throughout the period of condensation such that they constitute an observable fraction of the bulk aerosol.
Careful treatment of the first-generation kinetics of this at-mospherically relevant nighttime oxidant mixture also served to contextualize the relative importance of each observed aerosol precursor in different regions. We propose using NO2/BVOC ratios for each monoterpene to predict the
dom-inant nighttime oxidation pathway for each (Table 5). For ex-ample, forβ-pinene at NO2/BVOC ratios greater than 0.47,
NO3oxidation will begin to out-compete O3oxidation,
sug-gesting thatβ-pinene oxidation by O3is likely to be minor at
dis-plays a rather extreme manifestation of this observation, but all four monoterpenes studied have NO2/BVOC ratios such
that NO3 oxidation is likely to dominate even in relatively
remote regions.
The complexity shown by just these four BVOCs reacting with two different oxidants suggests that bulk parameters in global and regional models need to be very carefully consid-ered if they are going to accurately match observed ambient organic aerosol loadings. These models use one or two, typ-ically daytime, aerosol yield parameters for bulk monoter-penes – often consideringα-pinene orβ-pinene yields to be representative (e.g., Lane et al., 2008). To the knowledge of the authors, the modeling approaches of Hoyle et al. (2007) and Pye et al. (2010) are the only global-scale models that pa-rameterize NO3chemistry. Future challenges in constraining
the global aerosol budget will likely require creating more nuanced approaches to modeling different regions with os-tensibly similar chemistry that has been shown to have di-verse effects on aerosol formation.
The Supplement related to this article is available online at doi:10.5194/acp-15-12267-2015-supplement.
Acknowledgements. J. L. Fry and D. C. Draper gratefully
acknowl-edge funding from the National Center for Environmental Research (NCER) STAR Program, EPA no. RD-83539901, as well as the Reed College Class of ’21 Award. We thank Rhiana Meade for the development of the RECv1.0 as well as Dean Atkinson for his donation of PFA film to build the RECv2.0 used in this study. D. K. Farmer acknowledges the National Science Foundation (AGS 1240611) for its support.
Edited by: A. Virtanen
References
Atkinson, R. and Arey, J.: Atmospheric Degradation of Volatile Organic Compounds, Chem. Rev., 103, 4605–4638, doi:10.1021/cr0206420, 2003.
Atkinson, R., Aschmann, S. M., Arey, J., and Shorees, B.: For-mation of OH radicals in the gas phase reactions of O3 with a series of terpenes, J. Geophys. Res.-Atmos., 97, 6065–6073, doi:10.1029/92JD00062, 1992.
Ayres, B. R., Allen, H. M., Draper, D. C., Brown, S. S., Wild, R. J., Jimenez, J. L., Day, D. A., Campuzano-Jost, P., Hu, W., de Gouw, J., Koss, A., Cohen, R. C., Duffey, K. C., Romer, P., Baumann, K., Edgerton, E., Takahama, S., Thornton, J. A., Lee, B. H., Lopez-Hilfiker, F. D., Mohr, C., Goldstein, A. H., Olson, K., and Fry, J. L.: Organic nitrate aerosol formation via NO3+ BVOC in the Southeastern US, Atmos. Chem. Phys. Discuss., 15, 16235–16272, doi:10.5194/acpd-15-16235-2015, 2015. Barthelmie, R. J. and Pryor, S. C.: A model mechanism to describe
oxidation of monoterpenes leading to secondary organic aerosol:
1.α-pinene andβ-pinene, J. Geophys. Res.-Atmos., 104, 23657– 23699, doi:10.1029/1999JD900382, 1999.
Bateman, A. P., Walser, M. L., Desyaterik, Y., Laskin, J., Laskin, A., and Nizkorodov, S. A.: The Effect of Solvent on the Anal-ysis of Secondary Organic Aerosol Using Electrospray Ioniza-tion Mass Spectrometry, Environ. Sci. Technol., 42, 7341–7346, doi:10.1021/es801226w, 2008.
Bateman, A. P., Laskin, J., Laskin, A., and Nizkorodov, S. A.: Applications of High-Resolution Electrospray Ionization Mass Spectrometry to Measurements of Average Oxygen to Carbon Ratios in Secondary Organic Aerosols, Environ. Sci. Technol., 46, 8315–8324, doi:10.1021/es3017254, 2012.
Boyd, C. M., Sanchez, J., Xu, L., Eugene, A. J., Nah, T., Tuet, W. Y., Guzman, M. I., and Ng, N. L.: Secondary organic aerosol formation from theβ-pinene+NO3 system: effect of humidity and peroxy radical fate, Atmos. Chem. Phys., 15, 7497–7522, doi:10.5194/acp-15-7497-2015, 2015.
Carlton, A. G., Pinder, R. W., Bhave, P. V., and Pouliot, G. A.: To What Extent Can Biogenic SOA be Controlled?, Environ. Sci. Technol., 44, 3376–3380, doi:10.1021/es903506b, 2010. Crounse, J. D., Nielsen, L. B., Jørgensen, S., Kjaergaard, H. G.,
and Wennberg, P. O.: Autoxidation of Organic Compounds in the Atmosphere, J. Phys. Chem. Lett., 4, 3513–3520, doi:10.1021/jz4019207, 2013.
Davidson, C. I., Phalen, R. F., and Solomon, P. A.: Airborne Particu-late Matter and Human Health: A Review, Aerosol Sci. Techno., 39, 737–749, doi:10.1080/02786820500191348, 2005.
Desyaterik, Y., Sun, Y., Shen, X., Lee, T., Wang, X., Wang, T., and Collett, J. L.: Speciation of “brown” carbon in cloud water im-pacted by agricultural biomass burning in eastern China, J. Geo-phys. Res.-Atmos., 118, 7389–7399, doi:10.1002/jgrd.50561, 2013.
Doezema, L. A., Longin, T., Cody, W., Perraud, V., Dawson, M. L., Ezell, M. J., Greaves, J., Johnson, K. R., and Finlayson-Pitts, B. J.: Analysis of secondary organic aerosols in air using extrac-tive electrospray ionization mass spectrometry (EESI-MS), RSC Adv., 2, 2930–2938, doi:10.1039/C2RA00961G, 2012. Donahue, N. M., Epstein, S. A., Pandis, S. N., and Robinson, A.
L.: A two-dimensional volatility basis set: 1. organic-aerosol mixing thermodynamics, Atmos. Chem. Phys., 11, 3303–3318, doi:10.5194/acp-11-3303-2011, 2011.
Ehn, M., Thornton, J. A., Kleist, E., Sipila, M., Junninen, H., Pulli-nen, I., Springer, M., Rubach, F., Tillmann, R., Lee, B., Lopez-Hilfiker, F., Andres, S., Acir, I.-H., Rissanen, M., Jokinen, T., Schobesberger, S., Kangasluoma, J., Kontkanen, J., Nieminen, T., Kurten, T., Nielsen, L. B., Jorgensen, S., Kjaergaard, H. G., Canagaratna, M., Maso, M. D., Berndt, T., Petaja, T., Wahner, A., Kerminen, V.-M., Kulmala, M., Worsnop, D. R., Wildt, J., and Mentel, T. F.: A large source of low-volatility secondary or-ganic aerosol, Nature, 506, 476–479, doi:10.1038/nature13032, 2014.
Fry, J. L., Kiendler-Scharr, A., Rollins, A. W., Brauers, T., Brown, S. S., Dorn, H.-P., Dubé, W. P., Fuchs, H., Mensah, A., Rohrer, F., Tillmann, R., Wahner, A., Wooldridge, P. J., and Cohen, R. C.: SOA from limonene: role of NO3in its generation and degrada-tion, Atmos. Chem. Phys., 11, 3879–3894, doi:10.5194/acp-11-3879-2011, 2011.
Fry, J. L., Draper, D. C., Zarzana, K. J., Campuzano-Jost, P., Day, D. A., Jimenez, J. L., Brown, S. S., Cohen, R. C., Kaser, L., Hansel, A., Cappellin, L., Karl, T., Hodzic Roux, A., Turnipseed, A., Cantrell, C., Lefer, B. L., and Grossberg, N.: Observations of gas- and aerosol-phase organic nitrates at BEACHON-RoMBAS 2011, Atmos. Chem. Phys., 13, 8585–8605, doi:10.5194/acp-13-8585-2013, 2013.
Fry, J. L., Draper, D. C., Barsanti, K. C., Smith, J. N., Ortega, J., Winkler, P. M., Lawler, M. J., Brown, S. S., Edwards, P. M., Cohen, R. C., and Lee, L.: Secondary Organic Aerosol Forma-tion and Organic Nitrate Yield from NO3 Oxidation of Bio-genic Hydrocarbons, Environ. Sci. Technol., 48, 11944–11953, doi:10.1021/es502204x, 2014.
Fry, J. L., Koski, C., Bott, K., Hsu-Flanders, R., and Hazell, M.: Downwind particulate matters: Regulatory implications of sec-ondary aerosol formation from the interaction of nitrogen ox-ides and tree emissions, Environ. Sci. Policy, 50, 180–190, doi:10.1016/j.envsci.2015.02.017, 2015.
Geron, C., Rasmussen, R., Arnts, R. R., and Guenther, A.: A review and synthesis of monoterpene speciation from forests in the United States, Atmos. Environ., 34, 1761–1781, doi:10.1016/S1352-2310(99)00364-7, 2000.
Glasius, M., Lahaniati, M., Calogirou, A., Di Bella, D., Jensen, N. R., Hjorth, J., Kotzias, D., and Larsen, B. R.: Carboxylic Acids in Secondary Aerosols from Oxidation of Cyclic Monoter-penes by Ozone, Environ. Sci. Technol., 34, 1001–1010, doi:10.1021/es990445r, 2000.
Goldstein, A. H. and Galbally, I. E.: Known and Unexplored Or-ganic Constituents in the Earth’s Atmosphere, Environ. Sci. Technol., 41, 1514–1521, doi:10.1021/es072476p, 2007. Griffin, R. J., Cocker, D. R., Flagan, R. C., and Seinfeld,
J. H.: Organic aerosol formation from the oxidation of bio-genic hydrocarbons, J. Geophys. Res.-Atmos., 104, 3555–3567, doi:10.1029/1998JD100049, 1999.
Grosjean, D. and Harrison, J.: Response of chemilumines-cence NOx analyzers and ultraviolet ozone analyzers to or-ganic air pollutants, Environ. Sci. Technol., 19, 862–865, doi:10.1021/es00139a016, 1985.
Guenther, A., Hewitt, C. N., Erickson, D., Fall, R., Geron, C., Graedel, T., Harley, P., Klinger, L., Lerdau, M., Mckay, W. A., Pierce, T., Scholes, B., Steinbrecher, R., Tallamraju, R., Taylor, J., and Zimmerman, P.: A global model of natural volatile organic compound emissions, J. Geophys. Res.-Atmos., 100, 8873–8892, doi:10.1029/94JD02950, 1995.
Hallquist, M., Wängberg, I., Ljungström, E., Barnes, I., and Becker, K.-H.: Aerosol and Product Yields from NO3Radical-Initiated Oxidation of Selected Monoterpenes, Environ. Sci. Technol., 33, 553–559, doi:10.1021/es980292s, 1999.
Hallquist, M., Wenger, J. C., Baltensperger, U., Rudich, Y., Simp-son, D., Claeys, M., Dommen, J., Donahue, N. M., George, C., Goldstein, A. H., Hamilton, J. F., Herrmann, H., Hoff-mann, T., Iinuma, Y., Jang, M., Jenkin, M. E., Jimenez, J. L., Kiendler-Scharr, A., Maenhaut, W., McFiggans, G., Mentel, Th.
F., Monod, A., Prévôt, A. S. H., Seinfeld, J. H., Surratt, J. D., Szmigielski, R., and Wildt, J.: The formation, properties and im-pact of secondary organic aerosol: current and emerging issues, Atmos. Chem. Phys., 9, 5155–5236, doi:10.5194/acp-9-5155-2009, 2009.
Haynes, W., Bruno, T. J., and Lide, D. R. (Eds.): CRC Handbook of Chemistry and Physics, 93rd Edn. (Internet Version), CRC Press/Taylor and Francis, 2012.
Heald, C. L., Jacob, D. J., Park, R. J., Russell, L. M., Huebert, B. J., Seinfeld, J. H., Liao, H., and Weber, R. J.: A large organic aerosol source in the free troposphere missing from current models, Geo-phys. Res. Lett., 32, L18809, doi:10.1029/2005GL023831, 2005. Heald, C. L., Coe, H., Jimenez, J. L., Weber, R. J., Bahreini, R., Middlebrook, A. M., Russell, L. M., Jolleys, M., Fu, T.-M., Al-lan, J. D., Bower, K. N., Capes, G., Crosier, J., Morgan, W. T., Robinson, N. H., Williams, P. I., Cubison, M. J., DeCarlo, P. F., and Dunlea, E. J.: Exploring the vertical profile of atmo-spheric organic aerosol: comparing 17 aircraft field campaigns with a global model, Atmos. Chem. Phys., 11, 12673–12696, doi:10.5194/acp-11-12673-2011, 2011.
Hoffmann, T., Odum, J., Bowman, F., Collins, D., Klockow, D., Fla-gan, R., and Seinfeld, J.: Formation of organic aerosols from the oxidation of biogenic hydrocarbons, J. Atmos. Chem., 26, 189– 222, 1997.
Hoyle, C. R., Berntsen, T., Myhre, G., and Isaksen, I. S. A.: Sec-ondary organic aerosol in the global aerosol – chemical trans-port model Oslo CTM2, Atmos. Chem. Phys., 7, 5675–5694, doi:10.5194/acp-7-5675-2007, 2007.
Hoyle, C. R., Boy, M., Donahue, N. M., Fry, J. L., Glasius, M., Guenther, A., Hallar, A. G., Huff Hartz, K., Petters, M. D., Petäjä, T., Rosenoern, T., and Sullivan, A. P.: A review of the anthro-pogenic influence on biogenic secondary organic aerosol, Atmos. Chem. Phys., 11, 321–343, doi:10.5194/acp-11-321-2011, 2011. IPCC: Climate Change 2013: The Physical Science Basis. Contri-bution of Working Group I to the Fifth Assessment Report of the Intergovernmental Panel on Climate Change, Cambridge Uni-versity Press, Cambridge, United Kingdom and New York, NY, USA, doi:10.1017/CBO9781107415324, 2013.
Jokinen, T., Sipilä, M., Richters, S., Kerminen, V.-M., Paasonen, P., Stratmann, F., Worsnop, D., Kulmala, M., Ehn, M., Herrmann, H., and Berndt, T.: Rapid Autoxidation Forms Highly Oxidized RO2 Radicals in the Atmosphere, Angew. Chem. Int. Edit., 53, 14596–14600, doi:10.1002/anie.201408566, 2014.
Kroll, J. H. and Seinfeld, J. H.: Chemistry of secondary ganic aerosol: Formation and evolution of low-volatility or-ganics in the atmosphere, Atmos. Environ., 42, 3593–3624, doi:10.1016/j.atmosenv.2008.01.003, 2008.
Lane, T. E., Donahue, N. M., and Pandis, S. N.: Effect of NOx on Secondary Organic Aerosol Concentrations, Environ. Sci. Tech-nol., 42, 6022–6027, doi:10.1021/es703225a, 2008.
Lee, A., Goldstein, A. H., Kroll, J. H., Ng, N. L., Varutbangkul, V., Flagan, R. C., and Seinfeld, J. H.: Gas-phase products and secondary aerosol yields from the photooxidation of 16 different terpenes, J. Geophys. Res.-Atmos., 111, D17305, doi:10.1029/2006JD007050, 2006.
Middleton, P.: Sources of air pollutants, in: Composition, Chem-istry, and Climate of the Atmosphere, edited by: Singh, H. B., Van Nostrand Reinhold, New York, 1995.
Moldanova, J. and Ljungström, E.: Modelling of particle formation from NO3oxidation of selected monoterpenes, J. Aerosol Sci., 21, 1317–1333, doi:10.1016/S0021-8502(00)00041-0, 2000. Ng, N. L., Kroll, J. H., Keywood, M. D., Bahreini, R.,
Varut-bangkul, V., Flagan, R. C., Seinfeld, J. H., Lee, A., and Goldstein, A. H.: Contribution of First- versus Second-Generation Prod-ucts to Secondary Organic Aerosols Formed in the Oxidation of Biogenic Hydrocarbons, Environ. Sci. Technol., 40, 2283–2297, doi:10.1021/es052269u, 2006.
Perraud, V., Bruns, E. A., Ezell, M. J., Johnson, S. N., Greaves, J., and Finlayson-Pitts, B. J.: Identification of Organic Nitrates in the NO3Radical Initiated Oxidation ofα-Pinene by Atmospheric Pressure Chemical Ionization Mass Spectrometry, Environ. Sci. Technol., 44, 5887–5893, doi:10.1021/es1005658, 2010. Perraud, V., Bruns, E. A., Ezell, M. J., Johnson, S. N.,
Yu, Y., Alexander, M. L., Zelenyuk, A., Imre, D., Chang, W. L., Dabdub, D., Pankow, J. F., and Finlayson-Pitts, B. J.: Nonequilibrium atmospheric secondary organic aerosol for-mation and growth, Proc. Natl. Aca. Sci., 109, 2836–2841, doi:10.1073/pnas.1119909109, 2012.
Pope III, C. A., Bates, D. V., and Raizenne, M. E.: Health Effects of Particulate Air Pollution: Time for Reassessment?, Environ. Health Perspect., 103, 472–480, doi:10.2307/3432586, 1995. Presto, A. A., Huff Hartz, K. E., and Donahue, N. M.: Secondary
Organic Aerosol Production from Terpene Ozonolysis. 2. Effect of NOx Concentration, Environ. Sci. Technol., 39, 7046–7054, 2005.
Pye, H. O. T., Chan, A. W. H., Barkley, M. P., and Seinfeld, J. H.: Global modeling of organic aerosol: the importance of reac-tive nitrogen (NOxand NO3), Atmos. Chem. Phys., 10, 11261– 11276, doi:10.5194/acp-10-11261-2010, 2010.
Reis, S., Pinder, R. W., Zhang, M., Lijie, G., and Sutton, M. A.: Reactive nitrogen in atmospheric emission inventories, At-mos. Chem. Phys., 9, 7657–7677, doi:10.5194/acp-9-7657-2009, 2009.
Rollins, A. W., Browne, E. C., Min, K.-E., Pusede, S. E., Wooldridge, P. J., Gentner, D. R., Goldstein, A. H., Liu, S., Day, D. A., Russell, L. M., and Cohen, R. C.: Evidence for NOx Con-trol over Nighttime SOA Formation, Science, 337, 1210–1212, doi:10.1126/science.1221520, 2012.
Sakulyanontvittaya, T., Duhl, T., Wiedinmyer, C., Helmig, D., Matsunaga, S., Potosnak, M., Milford, J., and Guenther, A.: Monoterpene and Sesquiterpene Emission Estimates for the United States, Environ. Sci. Technol., 42, 1623–1629, doi:10.1021/es702274e, 2008.
Sander, S., Abbatt, J., Barker, J. R., Burkholder, J. B., Friedl, R. R., Golden, D. M., Huie, R. E., Kolb, C. E., Kurylo, M. J., Moort-gat, G. K., Orkin, V. L., and Wine, P. H.: Chemical Kinetics and Photochemical Data for Use in Atmospheric Studies, Evaluation Number 17, JPL Publication, 10, 1–11, 2011.
Spittler, M., Barnes, I., Bejan, I., Brockmann, K., Benter, T., and Wirtz, K.: Reactions of NO3 radicals with limonene and α -pinene: Product and SOA formation, Atmos. Environ., 40, 116– 127, doi:10.1016/j.atmosenv.2005.09.093, 2006.
Surratt, J. D., Murphy, S. M., Kroll, J. H., Ng, N. L., Hildebrandt, L., Sorooshian, A., Szmigielski, R., Vermeylen, R., Maenhaut, W., Claeys, M., Flagan, R. C., and Seinfeld, J. H.: Chemical Composition of Secondary Organic Aerosol Formed from the Photooxidation of Isoprene, J. Phys. Chem. A, 110, 9665–9690, doi:10.1021/jp061734m, 2006.
VanReken, T. M., Greenberg, J. P., Harley, P. C., Guenther, A. B., and Smith, J. N.: Direct measurement of particle formation and growth from the oxidation of biogenic emissions, Atmos. Chem. Phys., 6, 4403–4413, doi:10.5194/acp-6-4403-2006, 2006. Vaughan, S., Canosa-Mas, C. E., Pfrang, C., Shallcross, D. E.,
Wat-son, L., and Wayne, R. P.: Kinetic studies of reactions of the nitrate radical (NO3) with peroxy radicals (RO2): an indirect source of OH at night?, Phys. Chem. Chem. Phys., 8, 3749–3760, doi:10.1039/B605569A, 2006.
Walser, M. L., Desyaterik, Y., Laskin, J., Laskin, A., and Nizkorodov, S. A.: High-resolution mass spectrometric anal-ysis of secondary organic aerosol produced by ozonation of limonene, Phys. Chem. Chem. Phys., 10, 1009–1022, doi:10.1039/B712620D, 2008.
Wangberg, I., Barnes, I., and Becker, K. H.: Product and Mech-anistic Study of the Reaction of NO3Radicals withα-Pinene, Environ. Sci. Technol., 31, 2130–2135, doi:10.1021/es960958n, 1997.
Winer, A. M., Peters, J. W., Smith, J. P., and Pitts, J. N.: Response of commercial chemiluminescent nitric oxide-nitrogen dioxide analyzers to other nitrogen-containing compounds, Environ. Sci. Technol., 8, 1118–1121, doi:10.1021/es60098a004, 1974. Winkler, P. M., Ortega, J., Karl, T., Cappellin, L., Friedli,
H. R., Barsanti, K., McMurry, P. H., and Smith, J. N.: Iden-tification of the biogenic compounds responsible for size-dependent nanoparticle growth, Geophys. Res. Lett., 39, L20815, doi:10.1029/2012GL053253, 2012.
Xu, L., Guo, H., Boyd, C. M., Klein, M., Bougiatioti, A., Cerully, K. M., Hite, J. R., Isaacman-VanWertz, G., Kreisberg, N. M., Knote, C., Olson, K., Koss, A., Goldstein, A. H., Hering, S. V., de Gouw, J., Baumann, K., Lee, S.-H., Nenes, A., We-ber, R. J., and Ng, N. L.: Effects of anthropogenic emissions on aerosol formation from isoprene and monoterpenes in the southeastern United States, Proc. Natl. Acad. Sci., 112, 37–42, doi:10.1073/pnas.1417609112, 2015.
Yu, J., Cocker, D., Griffin, R., Flagan, R., and Seinfeld, J.: Gas-phase ozone oxidation of monoterpenes: Gaseous and particulate products, J. Atmos. Chem., 34, 207–258, 1999.
Zhang, X., Cappa, C. D., Jathar, S. H., McVay, R. C., Ensberg, J. J., Kleeman, M. J., and Seinfeld, J. H.: Influence of vapor wall loss in laboratory chambers on yields of secondary organic aerosol, Proc. Natl. Aca. Sci., 111, 5802–5807, 2014.


![Table 5. Minimum [NO 2 ] / [BVOC] value reported for each monoterpene studied at which NO 3 is expected to dominate night-time oxidation.](https://thumb-eu.123doks.com/thumbv2/123dok_br/18271471.344557/12.918.163.356.161.269/table-minimum-reported-monoterpene-studied-expected-dominate-oxidation.webp)
