www.nat-hazards-earth-syst-sci.net/14/2975/2014/ doi:10.5194/nhess-14-2975-2014
© Author(s) 2014. CC Attribution 3.0 License.
Variable population exposure and distributed travel speeds
in least-cost tsunami evacuation modelling
S. A. Fraser1, N. J. Wood2, D. M. Johnston1,3, G. S. Leonard3, P. D. Greening4, and T. Rossetto4,5
1GNS Science/Massey University Joint Centre for Disaster Research, Massey University (Wellington Campus), P.O. Box 756, 6140 Wellington, New Zealand
2United States Geological Survey, 2130 SW 5th Avenue, Portland, OR 97201, USA 3GNS Science, P.O. Box 30 368, 5010 Lower Hutt, New Zealand
4Department of Civil, Environmental and Geomatic Engineering, University College London, Gower Street, London, WC1E 6BT, UK
5The Earthquake and People Interaction Centre (EPICentre), University College London, Gower Street, London, WC1E 6BT, UK
Correspondence to:S. A. Fraser ([email protected])
Received: 23 April 2014 – Published in Nat. Hazards Earth Syst. Sci. Discuss.: 10 June 2014 Revised: – – Accepted: 6 October 2014 – Published: 17 November 2014
Abstract. Evacuation of the population from a tsunami hazard zone is vital to reduce life-loss due to inundation. Geospatial least-cost distance modelling provides one ap-proach to assessing tsunami evacuation potential. Previous models have generally used two static exposure scenarios and fixed travel speeds to represent population movement. Some analyses have assumed immediate departure or a com-mon evacuation departure time for all exposed population. Here, a method is proposed to incorporate time-variable ex-posure, distributed travel speeds, and uncertain evacuation departure time into an existing anisotropic least-cost path dis-tance framework. The method is demonstrated for hypotheti-cal lohypotheti-cal-source tsunami evacuation in Napier City, Hawke’s Bay, New Zealand. There is significant diurnal variation in pedestrian evacuation potential at the suburb level, although the total number of people unable to evacuate is stable across all scenarios. Whilst some fixed travel speeds approximate a distributed speed approach, others may overestimate evacu-ation potential. The impact of evacuevacu-ation departure time is a significant contributor to total evacuation time. This method improves least-cost modelling of evacuation dynamics for evacuation planning, casualty modelling, and development of emergency response training scenarios. However, it requires detailed exposure data, which may preclude its use in many situations.
1 Introduction
Local-source (or near-field) tsunami can cause loss of life due to onshore inundation within minutes after a source event. Prompt evacuation of the hazard zone maximises a person’s chance of surviving tsunami inundation. Well-planned routes and refuges facilitate evacuation by minimising travel time to safety and maximising the number of people reaching safe refuge. Evacuation modelling is an important tool for esti-mating exposure to the hazard and the time required to evac-uate the hazard zone.
Figure 1. (a)Study area topography and locations of suburbs in Napier Territorial Authority.(b)Simulated flow depth due to the maximum
credible local-source subduction earthquake and inundation extent at 60 min after rupture (Fraser et al., 2014). Inset shows the position of Napier in the national context.(c)Meshblock boundaries and 2013 estimate of URP density for each meshblock (for clarity, smaller
meshblocks are shown without boundaries). URP density is classified using Natural Breaks (Jenks).
before wave arrival. Combining travel time and population exposure data gives an indication of the number of people potentially unable to evacuate in the available time, which facilitates planning of additional evacuation and emergency response solutions.
In order to simulate evacuation processes at the commu-nity scale, a model must represent the physical environment, spatial extent and timing of the hazard, population exposure, and human behaviour with respect to evacuation decisions and timing. To date, LCD models have been tested for sensi-tivity to elevation and landcover data: Wood and Schmidtlein (2012) concluded that the use of anisotropic path distance provides a more realistic cost distance estimate than the pre-vious use of isotropic cost distance. Post et al. (2009) ap-plied increased complexity to LCD analysis by including net-work capacity and evacuee density as modifiers of travel cost. Three other evacuation factors – population exposure, depar-ture time and travel speed – have been consistently applied as static values in previous LCD approaches, which may not represent the potential variability in these factors.
The objective of this paper is to demonstrate a method for introducing variability in population exposure scenar-ios, evacuation departure times and travel speeds into an anisotropic, least-cost, path distance model of pedestrian evacuation potential. The importance of traffic modelling, network capacity issues, evacuee interactions and disruption to evacuation routes due to earthquake damage are recog-nised; however, in order to focus on modelling the variability
in exposure, departure and travel phases, these aspects have not be incorporated into the demonstrated process. Popula-tion–time profiles are developed to model the distribution of residents and visitors at any time of day, for a weekday or weekend, in any month of the year. Incorporating distribu-tions to model departure time and evacuation travel speed better reflects evacuee behaviour in a real-world evacuation than current GIS-based approaches to mapping evacuation potential. The ability to model temporally variable expo-sure facilitates derivation of hazard expoexpo-sure, evacuation de-mands and optimal evacuation routes and refuges for specific scenarios. Emergency managers can use multiple exposure scenarios to develop evacuation training exercises, evacua-tion planning and casualty estimaevacua-tion.
2 Study area
Hikurangi subduction zone (Fraser et al., 2014). Simulated wave arrival at shore occurs 38 min after rupture and inun-dation reaches its maximum extent (>4 km inland) 32 min later. Flow depths exceed 8 m in the first 100 m onshore and generally up to 3 m further than 1 km inland (Fig. 1b). The simulated maximum credible inundation zone is taken to be the tsunami hazard zone and is referred to as such in the rest of this paper.
Bluff Hill (maximum elevation>100 m) provides the only area of high ground at the coast for refuge, although other ar-eas of high ground exist further inland of the hazard zone (Fig. 1a). The existing building stock is overwhelmingly 1–2 storey light timber (92 %), with a small proportion of 1–2 storey reinforced concrete (RC; 3 %) and 1–2 storey concrete masonry (3 %) (Cousins, 2009). Approximately 60 buildings (0.05 %) are three storeys or more in height, 40 % of which are of RC construction. The second storey may provide sufficient height for safe refuge in inland ar-eas of the city but this is less likely in the 1 km closest to shore. The probability of moderate to major structural dam-age due to tsunami loading in the maximum credible tsunami is greater than 80 % for RC and greater than 90 % for timber structures in the maximum credible tsunami (Fraser et al., 2014). Structural assessments are yet to confirm the tsunami-resistance of multi-storey buildings in the city. Therefore, this study does not include any existing buildings as potential refuges when considering pedestrian evacuation potential.
3 Methodology: least-cost path distance approach to determining pedestrian evacuation potential
The steps implemented in this methodology are described in this section. First, an anisotropic least-cost path distance analysis is set up, using physical data and hazard data for a chosen area. Second, several time-variable population ex-posure scenarios are created using building locations and various population statistics. Third, estimates of evacua-tion departure time and pedestrian travel speed are com-bined with the two prior components, to produce an overall view of pedestrian evacuation potential for the population in question.
3.1 Anisotropic least-cost path distance analysis LCD analysis is conducted in ESRI ArcGIS 10.1 following theanisotropic least-cost path distancemethod of Wood and
Schmidtlein (2012). Least-cost path distance determines the minimum path distance from every cell in the hazard zone to the nearest point of safety outside the hazard zone. The haz-ard zone and tsunami arrival time are identified by numerical inundation modelling (Fraser et al., 2014, Fig. 1b). Use of ar-rival time at shore provides a conservative estimate of arar-rival time for most locations in the hazard zone because there is
additional time before inundation reaches its maximum in-land extent.
The anisotropic approach accounts for the cost associated with direction of travel over sloping terrain of different sur-face type. High-resolution ground sursur-face Light Detection and Ranging (LiDAR) data are used to generate a digital elevation model (DEM) at 2 m horizontal resolution. Most short-span bridges in Napier are represented in the LiDAR data but manual augmentation is required to include the deck elevation of longer span bridges. These would otherwise be omitted, resulting in a road being erroneously intersected by steep terrain, artificially increasing the path distance value on that route. Tobler’s hiking functions (Tobler, 1993) are used to convert directional slope (derived from the DEM) into a travel speed cost, interpreting travel in a downhill direction as a benefit and uphill travel as an additional travel cost.
Land cover data are compiled from aggregated poly-gon data (Ministry for the Environment, 2009) represent-ing ground surface cover. The aggregated data do not in-clude roads, waterways or buildings, so additional polygon and polyline data are combined into a single comprehen-sive land cover raster. Land cover is represented in the LCD analysis by using a Speed Conservation Value (SCV), which is a speed-reduction factor representing the ease of travel over that land cover (Wood and Schmidtlein, 2012). Any cell representing a road is assigned SCV=1.0 (having no
impedance on travel speed) and any cell representing a water body or building is defined as impassable, to ensure evac-uation routing around these features. Other land cover cat-egories in the study included: Dirt road (SCV=0.9091),
Light brush (0.8333), Heavy brush (0.6667), Hard sand and Swampy bog (both 0.5556).
3.2 Time-variable population exposure
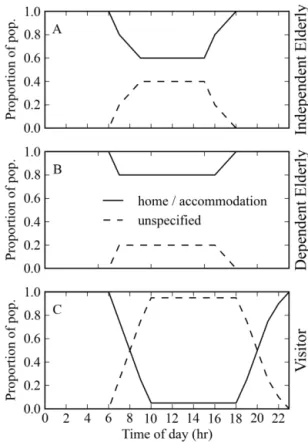
Figure 2.Population–time profiles to distribute working-age adults(a, b)and children(c, d)to home, work/school and unspecified locations.
Profiles are shown for a weekday(a, c)and weekend(b, d).
made in modellingpopulation dynamics by assigning popu-lation–time profiles to different types of locations (Cockings et al., 2010) and by using transport data in short time-slices to estimate diurnal changes in spatio-temporal population dis-tribution (Kobayashi et al., 2011). However, such time pro-files have yet to be applied in tsunami evacuation modelling. In this study, total night-time population is obtained from 2006 census Usually Resident Population (URP) data at meshblock-resolution and adjusted to 2013 values based on local population projections (Ministry of Education, 2012a; Statistics New Zealand, 2006). A meshblock is a New Zealand cadastral entity, generally covering less than 1.0–4.4 km2in Napier (Fig. 1c). Five population groups are defined on the basis of predominant diurnal activity and age:
school/childcare, working-age adults, independent elderly, dependent elderly andvisitors. Whilst it is recognised that
physical and intellectual disabilities can affect evacuation decision-making and mobility in evacuation, resulting in an increase in required evacuation time, it is not possible to de-termine the magnitude of impact of each type of disability registered. By using age to determine mobility impairment, we have captured the majority of mobility impairment in the population. However, this represents an important area of fur-ther study.
The groups are used in the model to assign exposure loca-tions and travel speed distribuloca-tions. Employment data, edu-cation rolls and care facility capacities are used to define the proportion of URP in each population group. These data are
site specific; data relevant to the local area should be sought for analyses of other areas.
Population–time profiles are used to define the certain pro-portion of each group at different types of location according to the month, day and time of the chosen exposure scenario (Fig. 2). The profiles define three types of location as: home or temporary accommodation (also includes elderly care fa-cilities), work or school/childcare, and unspecified location to represent people in transit or outdoors. Time profiles are developed using employment shift patterns (Statistics New Zealand, 2006), regional commuting patterns1, US diurnal activity patterns (Klepeis et al., 2001), and local knowledge of school hours and peak commuting hours. Building loca-tions and occupancy type are obtained from a regional expo-sure model developed for the national asset and loss model,
RiskScape (Cousins, 2009). Two population–time profiles
are developed for each group, one for a weekday and one for a weekend, to account for differing diurnal activity on working and non-working days. To include seasonal distri-bution of tourists in the exposed population, regional and lo-cal monthly visitor data are converted to an average daily number of visitors for each month. A description of the de-velopment of each population group and the respective pop-ulation–time profile follows in Sects. 3.2.2–3.2.5.
1Source: Statistics New Zealand, customised report and licensed
Twelve exposure scenarios are generated using the time-variable exposure model, then analysed for evacuation de-mand. The scenarios (all given in local time) comprise: 02:00 weekday, 12:00 weekday and 12:00 weekend, repeated for February, May and November (high-, low- and mid-tourist season, respectively). February weekday 08:00 and 17:00 scenarios are generated to represent peak commuting times and January weekend 12:00 to demonstrate peak tourist num-bers. This range of scenarios demonstrates the flexibility of the time-variable exposure model and assesses the influence of changing exposure on evacuation demand.
3.2.1 Exposure distribution – methods applicable to all population groups
The proportion of each population group assigned as being at home is combined into a single “residential population group”. Each meshblock is assigned a residential population for that exposure scenario, according to the proportional con-tribution of the meshblock to total URP. The derived pop-ulation of each meshblock is then distributed to randomly selected buildings in that meshblock, in a household group of variable size. Household group size is sampled from a weighted distribution of “number of household occupants”: 36 % of households in Hawke’s Bay comprise two people, 25 % have one person, 15 % have three people and 13 % have four (Statistics New Zealand, 2006). Distribution in a group enables a single travel speed to be assigned to the group, to represent the effect of household evacuation as a group.
To distribute the proportion of each population group as-signed to an unspecified location, a spatially-weighted distri-bution is developed using a GIS weighted overlay algorithm. In a mixed-density mixed-use urban area, population distri-bution is unlikely to be entirely random because people spend a significant majority of their time in residential buildings (Klepeis et al., 2001; Leech et al., 2002) and are likely to oth-erwise congregate around commercial services and commu-nity facilities. Therefore, building density is used as a proxy to determine the locations of population who are not defined as being at a residence, workplace, school/childcare centre or carehome. Raster surfaces of (a) commercial-use building density and (b) non-commercial building density are calcu-lated using the Kernel Point Density tool in ArcGIS 10.1. The two surfaces are combined using importance-weights of 70 and 30 %, respectively, subjectively defined to represent the relatively greater importance of commercial buildings for congregation of population, then reclassified to a combined weighting. In the combined raster, highly weighted cells re-flect areas of highest building density, based on building foot-print. The population is then distributed according to the weighted surface using a spatial analysis platform (Geospa-tial Modelling Environment; Beyer, 2012). This approach ensures that while each individual’s location is random, the model contains realistic aggregations of population around commercial and public services and facilities in the city.
3.2.2 Distribution of working-age adults
Population assigned to a workplace is distributed to ran-domly selected commercial, industrial, or community-use buildings until the maximum person-capacity of the build-ing is satisfied. Capacity is determined usbuild-ing the buildbuild-ing floor area (m2) and required floor area per person (Cousins, 2009). The proportion of this group assigned to residences and to unspecified locations is distributed according to the method in Sect. 3.2.1. The number of working-age adults (aged 18–65 years) is derived from census data (Statistics New Zealand, 2012a). All members of this group are as-signed anadult unimpairedtravel speed.
Employment statistics (Statistics New Zealand, see note 1) show that approximately 80 % of this group are in em-ployment (Napier City Council, 2013). Regional employ-ment shift data show that 89 % of working-age adults are in day-time employment (Statistics New Zealand). There-fore on a weekday, 60 % of working-age adults are assigned to commercial or industrial buildings between 10:00–16:00 and 20 % to unspecified locations to represent people work-ing in outdoor locations or in transit while workwork-ing (Fig. 2a). The remaining 20 % are distributed to randomly selected residential buildings to represent those at home during the day (working and non-working population). In the hours 08:00–10:00 and 16:00–18:00, the proportion of people at unspecified locations peaks to represent commuting between residences and workplaces. There are no data available to in-form the rate of movement of people at these times, so the population–time profiles curves are developed using expert judgement to assume movement to residential buildings dur-ing this time. Regional commutdur-ing data shows a net reduc-tion of c. 7000 people in the working-age populareduc-tion during weekdays (assumed to be 08:00–17:00) due to the dispar-ity in numbers of incoming and outgoing commuters. The net balance of commuters is expected to be much less on weekends, so the effect of commuters is only included on weekday. The weekend population–time profile assumes, us-ing expert judgement, that 40 % of workus-ing-age adults are at workplaces during the day, with 40 % at home and 20 % at unspecified locations (Fig. 2b). To account for night-shift workers in buildings, 2.5 % of working-age adults are as-signed to workplaces during evening hours and 0.5 % of them are assigned to unspecified locations. The distribution of peo-ple working in evenings (8 %) and overnight (3 %) is based on employment shift data (Statistics New Zealand).
3.2.3 Distribution of children to schools and childcare centres
other centres is applied. The weekday distribution of children places 100 % of children as assumed to be in school or child-care during 08:00–14:00, and at home during 21:00–07:00 (Fig. 2c). No data are available to inform the distribution of children between school or childcare centre, home and unspecified locations in the intervening hours, so this is subjectively assigned. The combined school and childcare roll (21 200) is greater than the 2013 adjusted population for age group 2–18 years (13 933). The surplus is assumed to be schoolchildren commuting in from other territorial authori-ties and they are not included in exposure scenarios between 17:00–07:00.
To account for the total number of people on site, staff numbers are included in the exposure estimates of childcare facilities using a ratio of one staff member per ten children (Napier Kindergartens, 2012). In schools, the number of staff are not added to the school roll due to the large school pop-ulation and lower ratio of staff to students. All people dis-tributed to education sites are assignedchildtravel speed, due
to the expectation that schools will evacuate in class groups, therefore have reduced speed. Currently, data are not avail-able to elaborate on the effect of group evacuation on travel speed.
3.2.4 Distribution of dependent and independent elderly
The population at 17 elderly care facilities and retirement vil-lages (1000 people) is defined asdependent elderlyand as-signed to the slowest travel speed group (elderly). There are
an estimated 10 000 people above 65 years who are consid-ered for this analysis to reside at home, defined in this model asindependent elderly. This group are considered to be more
mobile than dependent elderly, so are assigned to theadult impairedtravel speed group.
Both groups are part of the non-working population, as-sumed based on expert judgement to be located at home or care facility between 18:00–06:00 (Fig. 3a and b). Day-time location is assumed to be 60 % at home/facility between 10:00–14:00 and 40 % at unspecified locations. The distri-bution in the intermediate periods of time (07:00–09:00 and 15:00–17:00) assumes a linear trend to represent travel pat-terns between home and unspecified locations.
3.2.5 Distribution of visitors
The daily number and seasonal variation of overnight and day-trip visitors to Napier are derived from local and regional tourist data (Ministry of Economic Development, 2013a, b; Statistics New Zealand, 2012b, c). Overnight visitors are dis-tinguished by accommodation type (commercial or private) and distributed to the appropriate building type in night-time exposure scenarios. Between 23:00–06:00, visitors in private accommodation are distributed in groups of two (mean number of guests per stay night=1.67) to randomly
Figure 3.Population–time profiles to distribute visitors(a),
inde-pendent elderly(b)and dependent elderly(c)to home or
accommo-dation, and unspecified locations. Profiles for these groups are the same for weekdays and weekends.
selected residential buildings in Napier (Fig. 3c). Those in commercial accommodation are distributed in groups of two to randomly selected tourist accommodation (ho-tel/motel/backpacker/holiday park) according to facility ca-pacity as a proportion of total commercial accommodation capacity. Based on expert judgement, 95 % of visitors are distributed to unspecified locations between 10:00–18:00 us-ing the spatially weighted approach, and 5 % are assumed to be at their accommodation. The estimated number of daytrip visitors is distributed with the spatially weighted random dis-tribution for exposure scenarios between 08:00–20:00.
3.3 Estimation of evacuation time
A person’s total evacuation time is represented by a series of discrete time components that include event detection, warn-ing transmission and reception, evacuation preparation and evacuation travel (e.g. Urbanik et al., 1980; Post et al., 2009; Purser, 2010; González-Riancho et al., 2013). An evacuation time sequence for an individual or group can be defined as: ETt=EAt+ADt+WDt+IDt+EPt+TTtwhere Etis total
to issue a warning and warning receipt by the public; IDt is individual decision-making time on whether to evacuate or to seek further information; EPt is individual preparation time between an evacuation decision and initiating move-ment; and TTtis evacuation travel time that is spent in transit between location at the time of warning and safe destination. An individual is considered to have the potential to evacuate successfully if ETtis less than wave arrival time.
In local-source tsunami, short wave arrival times and tech-nological limitations mean that the detection and warning phases may not be completed fast enough to provide warn-ing with sufficient time for the subsequent evacuation phases. Instead, tsunami education encourages immediate evacua-tion on recognievacua-tion of natural warnings such as earthquake ground shaking or observations of unusual marine phenom-ena. Therefore, total evacuation time in the case of local-source tsunami is a function of the time for individuals to recognise a threat and decide to evacuate (IDt), the time it takes them to prepare to evacuate (EPt), and their travel time (TTt) so that: ETt=IDt+EPt+TTt.
In this proposed method, evacuation preparation time (Sect. 3.3.1) and travel time (Sect. 3.3.2) are estimated sep-arately and summed to yield total evacuation time for each individual (ETt). To account for uncertainty in evacuation time for each exposure scenario, 500 simulations of evacu-ation time are conducted for each individual in the popula-tion to generate mean ETt. From these 500 simulapopula-tions, the 95 % confidence interval is less than 2 % of the mean popula-tion at 20–30 min, and less than 11 % in the tail of the curve (Fig. 4a, which shows the distribution of population for ETt in the range 0–90 min). The 95 % confidence interval range based on 1000 simulations is less than 1–7 %. Five hundred simulations were therefore conducted because they provide comparably accurate view of the evacuation time curve for a 50 % reduction in computational expense. Individuals whose mean ETt exceeds wave arrival time are subject to further spatial analysis to calculate the population unable to evac-uate the hazard zone before wave arrival (PVE).PVE repre-sents the demand for additional evacuation capacity, such as vertical evacuation refuges in the hazard zone.
3.3.1 Evacuation departure time (IDt+EPt)
Modelling evacuation departure time is complex and uncer-tain. Activities in this phase may include gathering posses-sions, warning/helping others, confirming warnings, seek-ing additional information, and re-unitseek-ing or makseek-ing con-tact with family before evacuating together (Drabek, 1986; Lindell and Perry, 1992, 2012). These types of behaviour have been reported in local-source tsunami (Fraser et al., 2012; Yun and Hamada, 2012), but literature concern-ing tsunami evacuation behaviour remains relatively lim-ited (Dash and Gladwin, 2007; Lindell and Prater, 2010). Quantitative data available to constrain tsunami evacuation
departure to specific time ranges are limited to very few stud-ies (Suzuki and Imamura, 2005; Mas et al., 2012).
Substantial numbers of people choose not to, or are un-able to evacuate upon receiving hazard warnings (Lindell and Perry, 1992; Johnston et al., 2005; Lindell et al., 2011; Lin-dell and Perry, 2012), resulting in a compliance rate much less than 100 %. Earthquake ground shaking is often not in-terpreted by people as a tsunami warning (Gregg et al., 2006), therefore not all people evacuate the hazard zone. Compli-ance rate is little-studied for local-source tsunami, but may be influenced by proximity to the shoreline, property owner-ship, age and preparation of household plans (Charnkol and Tanaboriboon, 2006; Murakami and Kashiwabara, 2011). Tsunami evacuation intention surveys in our study area sug-gest relatively high but location-dependent compliance rate based on a natural warning: 84 % for respondents on the street at the time of an earthquake, 56 % when at home (Fraser et al., 2013). A spatially variable compliance rate is supported in the proposed method but due to the focus on travel speeds in this analysis, compliance rate is assumed to be 100 %.
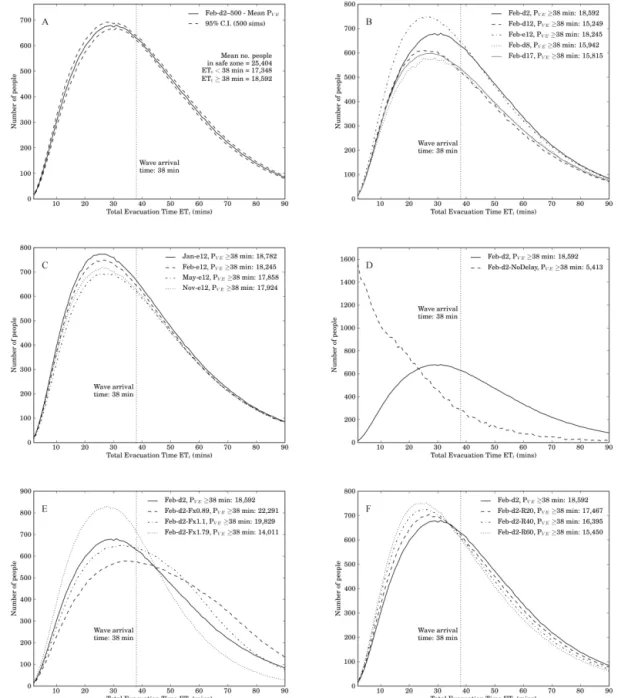
Figure 4.Evacuation time curves in the range 0–90 min, showing wave arrival time andPVEvalues for each curve.PVErepresents the
demand for additional evacuation capacity, such as vertical evacuation refuges in the hazard zone. (a)MeanPVEand 95 % confidence
intervals based on 500 simulations for the February weekday 02:00 (Feb-d2) exposure scenario;(b)diurnal variation in evacuation time for February weekday (Feb-d∗) and weekend (Feb-e∗) scenarios;
(c)seasonal variation in evacuation time for weekend 12:00 (∗-e12) scenario; (d)comparison of evacuation time curves for February weekday 02:00 (Feb-d2) scenario, with and without delayed evacuation departure
time;(e)comparison of analysis with distributed travel speeds compared to fixed speeds for February weekday 02:00 (Feb-d2) scenario; and (f)the impact of applying different probabilities that unimpaired adults and children run to evacuate.
3.3.2 Evacuation travel time (TTt)
Evacuation travel mode, generally pedestrian or vehicular, determines the speed and density at which people can travel through a transport network. Travel mode is influenced by distance to destination (Lamb and Walton, 2011), starting lo-cation (Fraser et al., 2013), and local context such as regular
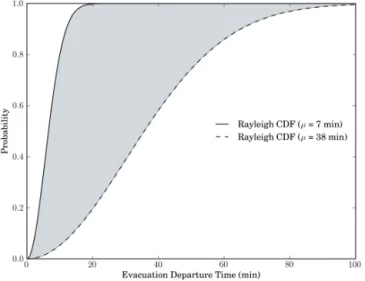
Figure 5. Minimum and maximum bounds of evacuation
depar-ture time, represented by Rayleigh functions with µ=7 min and µ=38 min. In each simulation, mean evacuation departure time is
sampled from the range 7–38 min, and a new Rayleigh function gen-erated. Each individual’s evacuation departure time is then sampled from that curve, which falls in the shaded area.
demographic groups, representing the impact of age and rel-ative mobility (Table 1).
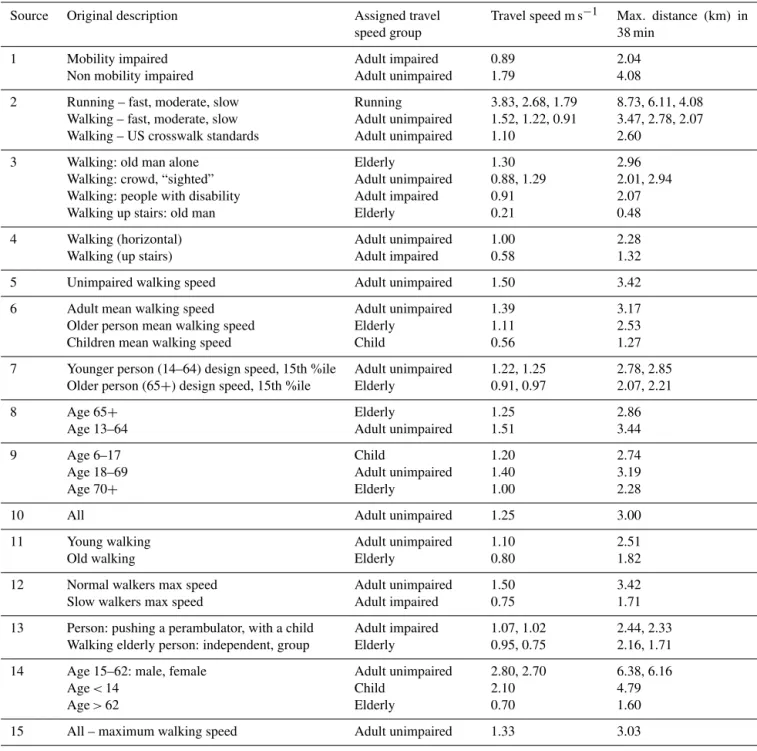
Variability in travel speed is included in this study by sam-pling from a speed distribution that is developed using pre-viously published speeds. To assign distributed travel speeds to the modelled population, walking speeds identified in the literature are grouped into one of five travel speed groups:
Elderly,Child,Adult impaired,Adult unimpaired, and Run-ning(Table 1). The five travel speed groups are based on the
categories given in the originating studies. The travel speeds found in the literature range between 0.21 and 3.83 m s−1. There is a range of 1.92 m s−1in the adult unimpaired group, 1.54 m s−1 for children, and 1.09 m s−1 for elderly. These ranges represent variability in walking speeds that has not been captured by previous studies that apply a fixed speed to each category.
The mean speed and standard deviation for each travel speed group (Table 2) are used to generate normal distri-butions of travel speed (Fig. 6). For each individual, a new travel speed is sampled from the corresponding travel speed distribution in each of the 500 simulations. The inverse of sampled travel speed is multiplied by the least-cost path dis-tance value at the individual’s location, to calculate travel time to safety (TTt).
Whilst 65 years (the nominal retirement age in New Zealand) is used in this modelling as a threshold to con-sider people as non-working, this is arbitrary as a thresh-old for implementing slower evacuation speeds. Assigning a very slow travel speed to everyone above 65 years is un-warranted, as deterioration in mobility is gradual and highly variable. Therefore, different minimum-age thresholds (65,
Figure 6.Normally distributed travel speed for each population group based on statistics presented in Table 2. Distributions are de-rived from the range of travel speeds identified for different groups in the evacuation literature (Table 1).
70, 75, 80 and 85 years) for assigning theelderlytravel speed
are tested in this analysis.
The proposed method for allocating travel speeds allows for the definition of a probability that an unimpaired adult or child will run in the evacuation, reducing their travel time. The probability of any child or unimpaired adult running is set to 20, 40 and 60 % in three tests. For each child or unimpaired adult in the exposure model, a randomly sampled value between 0 and 1 determines whether that individual is assigned to therunningtravel speed group, or to their original
travel speed group. The proportion of individuals and groups who might run rather than walk in an evacuation is not empir-ically known. To minimise this uncertainty when investigat-ing temporally variable exposure, runninvestigat-ing speeds are omitted from the diurnal and seasonal scenarios. This also makes the travel speed model more conservative. Sensitivity tests are conducted during this analysis to test the impact of people running on evacuation potential (Sect. 4.4).
4 Results
Table 1.Pedestrian travel speeds used in previous evacuation analyses; these speeds are used in this study to generate travel speed distri-butions. Sources – 1: FEMA (2008); 2: Wood and Schmidtlein (2012); 3: Cabinet Office Government of Japan (2005); 4: Yagi and Hasemi (2010); 5: Chooramun et al. (2012); 6: Revi and Singh (2006); 7: Knoblauch et al. (1996); 8: Park et al. (2012); 9: Liu et al. (2009); 10: Johnstone (2012); 11: Liu et al. (2006); 12: Goto et al. (2012); 13: Sugimoto et al. (2003); 14: Post et al. (2009); 15: Mas et al. (2012).
Source Original description Assigned travel speed group
Travel speed m s−1 Max. distance (km) in
38 min 1 Mobility impaired Adult impaired 0.89 2.04
Non mobility impaired Adult unimpaired 1.79 4.08
2 Running – fast, moderate, slow Running 3.83, 2.68, 1.79 8.73, 6.11, 4.08 Walking – fast, moderate, slow Adult unimpaired 1.52, 1.22, 0.91 3.47, 2.78, 2.07 Walking – US crosswalk standards Adult unimpaired 1.10 2.60
3 Walking: old man alone Elderly 1.30 2.96 Walking: crowd, “sighted” Adult unimpaired 0.88, 1.29 2.01, 2.94 Walking: people with disability Adult impaired 0.91 2.07 Walking up stairs: old man Elderly 0.21 0.48 4 Walking (horizontal) Adult unimpaired 1.00 2.28 Walking (up stairs) Adult impaired 0.58 1.32 5 Unimpaired walking speed Adult unimpaired 1.50 3.42 6 Adult mean walking speed Adult unimpaired 1.39 3.17 Older person mean walking speed Elderly 1.11 2.53 Children mean walking speed Child 0.56 1.27 7 Younger person (14–64) design speed, 15th %ile Adult unimpaired 1.22, 1.25 2.78, 2.85
Older person (65+) design speed, 15th %ile Elderly 0.91, 0.97 2.07, 2.21
8 Age 65+ Elderly 1.25 2.86
Age 13–64 Adult unimpaired 1.51 3.44
9 Age 6–17 Child 1.20 2.74
Age 18–69 Adult unimpaired 1.40 3.19
Age 70+ Elderly 1.00 2.28
10 All Adult unimpaired 1.25 3.00
11 Young walking Adult unimpaired 1.10 2.51
Old walking Elderly 0.80 1.82
12 Normal walkers max speed Adult unimpaired 1.50 3.42 Slow walkers max speed Adult impaired 0.75 1.71 13 Person: pushing a perambulator, with a child Adult impaired 1.07, 1.02 2.44, 2.33
Walking elderly person: independent, group Elderly 0.95, 0.75 2.16, 1.71 14 Age 15–62: male, female Adult unimpaired 2.80, 2.70 6.38, 6.16
Age<14 Child 2.10 4.79
Age>62 Elderly 0.70 1.60
15 All – maximum walking speed Adult unimpaired 1.33 3.03
of introducing vertical evacuation facilities, and comparison of evacuation in different exposure scenarios. They also en-able a rapid assessment of the evacuation potential in inunda-tion scenarios for which tsunami arrival has been estimated, which can provide benefit in actual events rather than plan-ning situations. The second product – maps showing density of populations who cannot evacuate successfully (e.g. Fig. 7) – demonstrates the spatial density of population who cannot
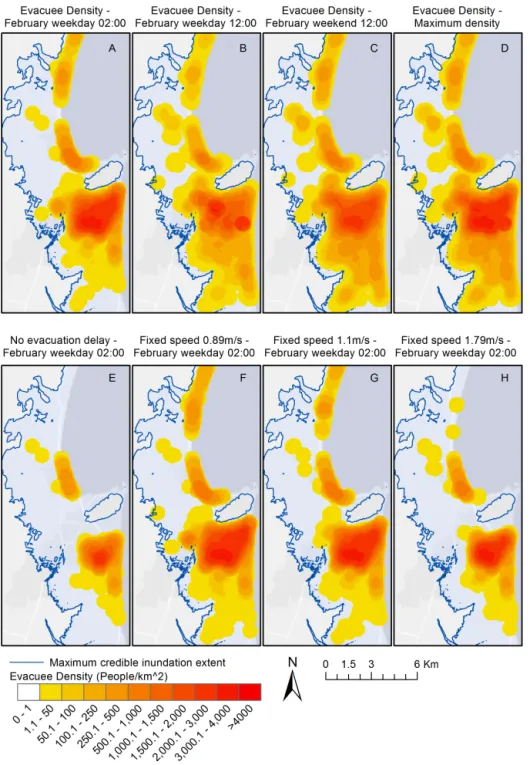
Figure 7.Point density maps showing the density of population with an evacuation time greater than wave arrival timePVE. Generated using
the distributed travel speed approach, these maps indicate the variation due to diurnal changes in population distribution.(a)February
week-day 02:00;(b)February weekday 12:00;(c)February weekend 12:00;(d)maximum density from all tested exposure scenarios;(e)February
weekday 02:00 with evacuation delay omitted (evacuation travel time only);(f)February weekday 02:00 using fixed speed of 0.89 m s−1; (g)February weekday 02:00 using fixed speed of 1.1 m s−1;(h)February weekday 02:00 using fixed speed of 1.79 m s−1.
4.1 Spatio-temporal variation in evacuation demand The results reported in this section use consistent assump-tions to demonstrate the influence of exposure changes: 38 min wave arrival time, elderly age threshold of 80 years (Sect. 3.2.4), and 100 % compliance rate.
Table 2.Travel speed statistics (m s−1) for each travel speed group,
compiled from travel speeds in the literature (Table 1).
Adult Adult Child Elderly Running impaired unimpaired
n 6 20 3 11 3
Min 0.58 0.88 0.56 0.21 1.79 Max 1.07 2.80 2.10 1.30 3.83 Mean 0.87 1.43 1.29 0.90 2.77 SD 0.18 0.50 0.78 0.30 1.02
resident commuters and an additional 4000 day-trip visitors. There is substantial diurnal variation in exposure distribution on weekdays. Individual suburbs show population change of
−55 to 150 % when comparing exposure at 02:00 to exposure
at 12:00, as residential population is re-distributed to schools and commercial/industrial areas during the day. Variation be-tween suburbs is also significant when comparing weekday and weekend exposure (−54 to 75 %), but seasonal variation
in all suburbs is relatively limited (generally<11 %). For this case study, there is some diurnal variation inPVE (Fig. 4b) but little seasonal variation (Fig. 4c). It is esti-mated that 15 200–18 800 people (25–30 % of the total pop-ulation) are unable to evacuate before wave arrival at 38 min and require additional evacuation options. HighestPVE oc-curs on a weekday at 02:00 (29–30 %) and weekend at 12:00 (28–29 %). The weekday 12:00 scenario shows the lowest PVE (25–26 %). Peak commuting scenarios have PVE of 26 % for 08:00 and 29 % for 17:00.
Although absolutePVE shows minor fluctuations (5 % of the total population) between each exposure scenario, this masks the significant localised variation in PVE at suburb level between exposure scenarios (Fig. 7a–c). The darker shades in Fig. 7 indicate high concentrations ofPVE. These locations have the greatest requirement for additional evac-uation capacity and could potentially have the highest num-ber of casualties or people trapped in a tsunami. The 02:00 scenario shows a large area of peakPVEdensity in the res-idential suburbs, which have high concentrations of URP at residential locations overnight.PVEon a weekday at 12:00 is strongly influenced by the large population concentrations at several schools, which show as two distinct areas of peak density. Otherwise, thePVEdensity evident at 02:00 is more evenly distributed in the 12:00 scenario.
Maximum PVE density occurs in a weekday 02:00 sce-nario (2800 people km−2) and is 33–41 % lower for all other scenarios. In the weekend 12:00 scenarios, a smaller pro-portion of the city has high PVE density (greater than 1500 people km−2) compared to weekday 02:00. However, density increases along the coastline and commercial-use ar-eas in weekend day-time scenarios, to a moderatePVE den-sity of 200–1000 people km−2. P
VE in the top three sub-urbs (in terms of PVE at 02:00) decreases in all diurnal
comparison scenarios compared to a weekday 02:00. These decreases are of the order of 29–52 % (1000–1900 people). Conversely, other suburbs show increases of up to 1600 peo-ple (500 %).
It is important to represent the local variation inPVE and influence of the weekend/peak-commute scenarios to inform appropriate siting choices when planning evacuation. Mul-tiple exposure scenarios can be combined into a maximum exposure surface for a single analysis to provide maximum potentialPVEat every location (Fig. 7d). MaximumPVE oc-curs at weekday 02:00 for seven of the 14 suburbs in the study area. The other 50 % of suburbs experience their max-imumPVE at weekday 08:00 or at weekend 12:00. There-fore, consideration of only the weekday 02:00 and weekday 12:00 scenarios (i.e. night-time and day-time using employ-ment records) would not, for this study location, accurately represent the maximumPVE.
In addition to changes inPVE distribution, composition ofPVE also varies between exposure scenarios. In a week-day 02:00 scenario at Napier, 91 % ofPVE are people lo-cated at home, so the majority of evacuees will be with their household group. At 12:00 on a weekday the distribution is more diverse, posing different challenges for evacuation and emergency response than a night-time scenario. Twenty-five percent of the population are at home, 31 % are children at school, 20 % are people at work, and 21 % are tourists, res-ident adults and elderly people at unspecified locations. In these scenarios, evacuation of large groups becomes more prevalent and immediate actions are likely to include con-necting with family and travelling to schools before evacuat-ing. At 12:00 on a weekend,PVE comprises 47 % at home, 14 % work and 31 % of people at unspecified locations (an equal composition of resident adults, children, and tourists). One of the most vulnerable groups, people in elderly care facilities, comprises<1 % of PVE (<200 people) in each scenario.
4.2 Evacuation departure time
To demonstrate the importance of including evacuation de-parture time in evacuation modelling, analysis was con-ducted with the decision-making and preparation time phases (IDt+EPt) omitted. When evacuation departure time is
the significant reduction in ETtthat can be achieved through minimising evacuation delays.
4.3 Impact of distributed travel speed
The impact of simulating evacuation with distributed travel speeds in a LCD framework has been tested against three fixed travel speeds: 0.89, 1.1 and 1.79 m s−1. These represent fixed speeds for a mobility-impaired adult (FEMA, 2008), unimpaired adult based on US crosswalk standards (Wood and Schmidtlein, 2012), and an unimpaired adult (FEMA, 2008) (Table 1).
The use of fixed speeds can produce comparable results to distributed travel speeds. This is dependent on the fixed speed corresponding with the mean of travel speed distri-butions. In this case study, a fixed speed of 0.89 m s−1 es-timates that 37 % of the exposed population cannot evacu-ate in time. Simulation with 1.1 m s−1estimates 33 %, and 1.79 m s−1estimates 23 %. This compares to 38 % for analy-sis with distributed travel speeds. This corresponds to aPVE range of 4600 people across the three fixed speed estimates, which is a significant variation in the estimate of required ad-ditional evacuation capacity. The use of 1.1 m s−1 provides a reasonable assumption to estimate total PVE where travel speed distributions cannot be modelled (Fig. 4e). However, the 1.1 m s−1fixed speed curve results in a greater number of people with ETtof 38–80 min than a distributed speed analy-sis, which contains more people with ETt>90 min. There-fore, PVE is more sensitive to changes in evacuation time when a fixed speed of 1.1 m s−1is used. If this fixed speed is used to assess the impact of education to reduce evacuation delays, it is likely to show greater reductions in evacuation demand than analyses with distributed speed. A fixed speed of 0.89 m s−1provides a conservative estimate of
PVE, which is generally desirable for evacuation planning, but is less suit-able for estimating evacuation demand when designing evac-uation refuge capacity and informing investment decisions. A fixed speed of 1.79 m s−1 underestimatesP
VE compared to the distributed speed approach.
The application of fixed speeds also affects spatial dis-tribution of PVE, which can influence casualty estimation and decisions on where to site evacuation refuges. The first locations to be affected by altering travel speed are those located closest to the safety zone, because a small change in travel speed determines whether ETt exceeds wave ar-rival time or not. Distribution of PVE density for a fixed speed of 0.89 m s−1 corresponds closely to that of the dis-tributed speed analysis, although the extent of high density (>1500 people km2) is greater than for distributed speeds (Fig. 7f). At 1.1 m s−1, the spatial extent of high den-sity begins to reduce, with no reduction in peak PVE den-sity (Fig. 7g). For 1.79 m s−1 several suburbs are estimated to have no requirement for additional evacuation capacity (Fig. 7h); use of this speed could lead to locations that
require vertical evacuation being overlooked in decision-making processes.
Due to the similarity of mean travel speed in the distri-butions compiled for elderly and impaired adults(Fig. 6),
application of different minimum-age thresholds (65, 70, 75, 80 and 85 years) for theelderlytravel speed causes less than
1 % variation in population unable to evacuate before wave arrival. In their current form, and for this exposure case study, the two current travel speed distributions could be combined with minimal impact on results, but in order to demonstrate the functionality of the proposed method, both curves were retained in this study. In other case studies, a proportionally larger elderly population, or concentrations of elderly pop-ulations in areas with great travel distances may result in this group having a larger impact. Improved data on evac-uation walking speeds of the elderly, and age-related decline in walking speeds, would enable validation and adjustment of this threshold if required.
4.4 Application of running speeds
The proposed method enables application of faster travel speeds to proportions of unimpaired adults or children, to test the effect onPVEof the probability that people may run to evacuate. In three different tests, probability of an unim-paired adult or child being assigned a travel speed sampled from the Runningspeed distribution (Fig. 6) is set to 20,
40 and 60 %. With a 20 % probability of running, PVE is reduced by 6 %. A 12 % decrease inPVE is achieved with 40 % probability and 17 % reduction with a 60 % probability (Fig. 4f). These results show the tangible impact (reduction in number of casualties) that is possible due to an increase in travel speeds, and demonstrates the utility of this method in testing the impact of faster evacuation due to education and evacuation training. This approach could also be used to quantify the potential benefits of increased bicycle use in evacuations, to determine whether it is worthwhile trying to increase the use of bicycles in evacuation.
5 Conclusions
are collated into travel speed distributions for different pop-ulation groups based on age and relative mobility.
Modelling multiple exposure scenarios facilitates visuali-sation of the temporal dimension, in addition to spatial dis-tribution, of evacuation demand. This enables emergency managers and planners to understand how the time of an event can affect hazard exposure and potential casualties. Pre-calculatedPVEmaps and statistics, derived from a large enough range of exposure scenarios, could assist in: real-time decision making to expedite emergency response to ar-eas with greatest PVE; casualty estimation; public educa-tion; and evacuation planning. Robust evacuation planning requires knowledge of maximum potentialPVEat any loca-tion to ensure that routes and refuges have sufficient capacity in any event. Whilst this approach displays several benefits, the large amount of detailed data required to develop a de-tailed temporally variable exposure model poses a significant challenge to its wider application.
In this case study location, PVE varies little due to diur-nal changes in exposure; however, significant temporal vari-ations inPVE are apparent when comparing individual sub-urbs. A typical analysis using two scenarios (day-time/night-time) has the potential to overlook the full range of diur-nal variation in evacuation demand, particularly in areas that have large exposure of transitional populations at peak com-muting times and on weekends. Seasonal variation is found to be less important for this case study but should not be ruled out for other locations with a higher ratio of visitors to res-idents. Maximum potential PVE can be calculated in a sin-gle ETt analysis, but the estimation of maximum exposure should be based on multiple exposure scenarios, including peak commuting hours and weekends, rather than just two scenarios covering night-time and day-time.
Development of population–time profiles for Napier re-quired several assumptions due to the limited amount of data on diurnal activity patterns in New Zealand and internation-ally. There remains some disparity in diurnal patterns be-tween the population–time profiles developed for this study and those determined from large samples in the US and Canada. The improvement of diurnal activity data and tem-porally variable exposure data sets would benefit future risk assessments and evacuation modelling for all hazards. This analysis applied 500 simulations of evacuation time to a pop-ulation distribution that was unchanged in each exposure sce-nario. Future analyses should aim to use probabilistic expo-sure distribution in each simulation to better represent uncer-tainty in exposure.
Results of evacuation modelling are highly sensitive to the travel speeds applied. The use of fixed speeds c. 1.1 m s−1 results in PVE that is consistent with distributed speeds, demonstrating that this demonstrating that this fixed-speed assumption is suitable for use in aggregate analyses. How-ever, the slowest speeds used in previous analyses would over-estimate evacuation demand, and the fastest would sig-nificantly under-estimate demand. There is a requirement
to constrain travel speeds in community-scale evacuations. Collection of travel speed data for a range of demographic groups in monitored evacuation exercises could improve dis-tributed travel speed models. This is particularly important for schools and other institutions where group dynamics are likely to affect evacuation speeds. Evacuation decision-making and travel time are likely to be affected by physical and intellectual disability (omitted in this analysis), and fur-ther research should focus on the impact of this on evacuation time.
There are currently insufficient data on the time required to conduct preparation activities, to quantify preparation time according to personal characteristics and situational con-text. Quantification of departure time according to differ-ent preparation activities would benefit evacuation modelling and planning, and enable validation of Rayleigh functions. It has been demonstrated that a reduction in departure time can significantly reduce evacuation time and increase the propor-tion of the populapropor-tion able to reach safety. It is important that models incorporate departure time, and that reduction of this phase is a central aim of tsunami education.
Finally, the proposed method provides spatio-temporal variation in evacuation demand for the maximum credible local-source tsunami in the case study location. This high-lights the locations in which emergency managers should fo-cus on increasing evacuation potential – for example, through installation of vertical evacuation refuges. While this analy-sis focuses on pedestrian evacuation potential, this represents only one part of a robust evacuation plan. Complementary agent-based evacuation simulation should be used to validate the results of this least-cost distance method and to elaborate on traffic modelling, network capacity issues and evacuee interactions. The potential disruption to evacuation routes, damage to buildings and infrastructure as a result of earth-quake ground shaking, and the effect of aftershocks on evac-uation should be considered in future analyses.
Acknowledgements. We would like to thank Jim Cousins (GNS
Science) for valuable discussion of exposure models; Megan Harris (Hawke’s Bay Tourism) for provision of tourism data; Lisa Pearse (Hawke’s Bay Civil Defence Emergency Management Group) and Craig Goodier (Hawke’s Bay Regional Council) for provision of topography data; Robyn Tuohy (Massey University) for discussion of age-dependent mobility; and Jeanne Jones (USGS) for providing information on application of ArcGIS anisotropic least-cost path distance module. We would also like to thank two anonymous reviewers and Sergio Freire (European Commission – Joint Research Centre (JRC)) for their review comments, which have helped to improve this paper. This research was supported by public research funding from the Government of New Zealand and the US Geological Survey (USGS) Land Change Science Program. Any use of trade, product, or firm names is for descriptive pur-poses only and does not imply endorsement by the US Government. Edited by: M. Gonzalez Rodríguez
References
Beyer, H.: Geospatial Modelling Environment (Version 0.7.2.0), available at: http://www.spatialecology.com/gme (last access: 8 February 2014), 2012.
Cabinet Office Government of Japan: Guideline for Tsunami Evac-uation Buildings, Tsunami evacEvac-uation building guideline com-mittee, Government of Japan Cabinet Office, Tokyo, available at: http://www.bousai.go.jp/jishin/tsunami/hinan/hinanbiru.html (last access: 23 March 2014), 2005.
Charnkol, T. and Tanaboriboon, Y.: Evacuee behaviors and fac-tors affecting the tsunami trip generation model: a case study in Phang-Nga, Thailand, J. Adv. Transport, 40, 313–330, doi:10.1002/atr.5670400306, 2006.
Chooramun, N., Lawrence, P. J., and Galea, E. R.: An agent based evacuation model utilising hybrid space discretisation, Safety Sci., 50, 1685–1694, doi:10.1016/j.ssci.2011.12.022, 2012. Cockings, S., Martin, D., and Leung, S.: Population 24/7:
build-ing space-time specific population surface models, in: Proceed-ings of the GIS Research UK 18th Annual Conference GIS-RUK 2010, edited by: Haklay, M. M., Morley, J., and Rahem-tulla, H., 14–16 April 2010, London, UK, 41–47, 2010. Cousins, W. J.: RiskScape – development of a default assets model
for Hawke’s Bay, Science Report 2009/50, GNS Science, Lower Hutt, New Zealand, 2009.
Dash, N. and Gladwin, H.: Evacuation decision making and behav-ioral responses: individual and household, Nat. Hazards Rev., 8, 69–77, 2007.
Drabek, T.: Human System Responses to Disaster: an inventory of Sociological Findings, Springer Verlag, New York, 1986. FEMA: Guidelines for Design of Structures for Vertical
Evacua-tion from Tsunamis, FEMA Report P646, Prepared by the Ap-plied Technology Council for the Federal Emergency Manage-ment Agency, Redwood City, California, 2008.
Fraser, S. A., Leonard, G. S., Murakami, H., and Matsuo, I.: Tsunami vertical evacuation buildings – lessons for international preparedness following the 2011 great east Japan tsunami, J. Dis-aster Res., 7, 446–457, 2012.
Fraser, S. A., Johnston, D. M., and Leonard, G. S.: Intended evacua-tion behaviour in a local earthquake and tsunami at Napier, New Zealand, Science Report 2013/26, GNS Science, Lower Hutt, New Zealand, 2013.
Fraser, S. A., Power, W. L., Wang, X., Wallace, L. M., Mueller, C., and Johnston, D. M.: Tsunami inundation in Napier, New Zealand, due to local earthquake sources, Nat. Hazards, 70, 415–445, doi:10.1007/s11069-013-0820-x, 2014.
González-Riancho, P., Aguirre-Ayerbe, I., Aniel-Quiroga, I., Abad, S., González, M., Larreynaga, J., Gavidia, F., Gutiérrez, O. Q., Álvarez-Gómez, J. A., and Medina, R.: Tsunami evacua-tion modelling as a tool for risk reducevacua-tion: applicaevacua-tion to the coastal area of El Salvador, Nat. Hazards Earth Syst. Sci., 13, 3249–3270, doi:10.5194/nhess-13-3249-2013, 2013.
Goto, Y., Affan, M., Nurdin, Y., and Yuliana, D. K.: Tsunami evacu-ation simulevacu-ation for disaster educevacu-ation and city planning, J. Dis-aster Res., 7, 92–101, 2012.
Graehl, N. and Dengler, L.: Using a GIS to Model Tsunami Evac-uation Times for the Community of Fairhaven, California, AGU Fall Meeting Abstracts D1324, San Francisco, California, USA, 2008.
Gregg, C. E., Houghton, B. F., Paton, D., Lachman, R., Lach-man, J., Johnston, D. M., and Wongbusarakum, S.: Natural Warn-ing Signs of Tsunamis: Human Sensory Experience and Re-sponse to the 2004 Great Sumatra Earthquake and Tsunami in Thailand, Earthq. Spectra, 22, 671–691, doi:10.1193/1.2206791, 2006.
Imamura, F., Muhari, A., Mas, E., Pradono, M. H., Post, J., and Sugimoto, M.: Tsunami disaster mitigation by integrating com-prehensive countermeasures in Padang City, Indonesia, Disaster Res., 7, 48–64, 2012.
Johnston, D. M., Paton, D., Crawford, G. L., Ronan, K. R., Houghton, B. F., and Borgelt, P.: Measuring tsunami prepared-ness in coastal Washington, United States, Nat. Hazards, 35, 173–184, doi:10.1007/s11069-004-2419-8, 2005.
Johnstone, W. M.: Life Safety Modelling Framework and Perfor-mance Measures to Assess Community Systems: Application to Tsunami Emergency Preparedness and Dam Safety Manage-ment, Ph.D. thesis, University of British Columbia, Vancouver, Canada, 2012.
Klepeis, N. E., Nelson, W. C., Ott, W. R., Robinson, J. P., Tsang, A. M., Switzer, P., Behar, J. V., Hern, S. C., and En-gelmann, W. H.: The National Human Activity Pattern Sur-vey (NHAPS): a resource for assessing exposure to environ-mental pollutants, J. Expo. Anal. Env. Epid., 11, 231–252, doi:10.1038/sj.jea.7500165, 2001.
Knoblauch, R. L., Pietrucha, M. T., and Nitzburg, M.: Field studies of pedestrian walking speed and start-up time, Transport. Res. Rec., 1538, 27–38, doi:10.3141/1538-04, 1996.
Kobayashi, T., Medina, R. M., and Cova, T. J.: Visualizing diurnal population change in urban areas for emergency management, Prof. Geogr., 63, 113–130, doi:10.1080/00330124.2010.533565, 2011.
Lamb, S. M. and Walton, D. K.: Travel behaviours following the 2007 Gisborne earthquake: evidence for the use of simulation in earthquake research, Int. J. Emergency Manage., 8, 42–59, doi:10.1504/IJEM.2011.040397, 2011.
Leech, J. A., Nelson, W. C., Burnett, R. T., Aaron, S., and Raizenne, M. E.: It’s about time: a comparison of Canadian and American time-activity patterns, J. Expo. Anal. Env. Epid., 12, 427–432, doi:10.1038/sj.jea.7500244, 2002.
Lindell, M. K. and Perry, R. W.: Behavioral Foundations of Com-munity Emergency Planning, Hemisphere Publishing Corpora-tion, Washington, D.C., USA, 1992.
Lindell, M. K. and Perry, R. W.: The protective action decision model: theoretical modifications and additional evidence, Risk Anal., 32, 616–632, doi:10.1111/j.1539-6924.2011.01647.x, 2012.
Lindell, M. K. and Prater, C. S.: Tsunami Preparedness on the Oregon and Washington Coast: recommendations for re-search, Nat. Hazards Rev., 11, 69–81, doi:10.1061/(ASCE)1527-6988(2010)11:2(69), 2010.
Lindell, M. K., Prater, C. S., Perry, R. W., and Wu, J. Y.: EM-BLEM: An Empirically Based Large-Scale Evacuation Time Estimate Model, Report, Hazard Reduction & Recovery Center, Texas A & M University, College Station, Texas, 2002.
Liu, Y., Hatayama, M., and Okada, N.: Development of an Adaptive Evacuation Route Algorithm under Flood Disaster, Annuals of the Disaster Prevention Research Institute., 49, 189–195, 2006. Liu, Y., Okada, N., Shen, D., and Li, S.: Agent-based flood
evacua-tion simulaevacua-tion of life – threatening condievacua-tions using vitae system model, J. Nat. Disaster Sci., 31, 33–41, 2009.
Mas, E., Suppasri, A., Imamura, F., and Koshimura, S.: Agent-based Simulation of the 2011 great east Japan earthquake/tsunami evac-uation: an integrated model of tsunami inundation and evacua-tion, J. Nat. Disaster Sci., 34, 41–57, 2012.
Ministry for the Environment: New Zealand Land Cover Database version 2, available at: https://lris.scinfo.org.nz/ layer/401-lcdb-v33-land-cover-database-version-33/ (last ac-cess: 17 March 2012), 2009.
Ministry of Economic Development: International Visitor Survey Online Database, available at: http://www.med. govt.nz/sectors-industries/tourism/tourism-research-data/ international-visitor-survey/online-database (last access: 18 Au-gust 2013), 2013a.
Ministry of Economic Development: Domestic Travel Sur-vey Online Database, available at: http://www.med. govt.nz/sectors-industries/tourism/tourism-research-data/ domestic-tourism/domestic-travel-survey-online-database (last access: 18 August 2013), 2013b.
Ministry of Education: Directory of Schools – as at 01/08/2012, available at: http://www.minedu.govt.nz/Parents/AllAges/ SchoolSearch.aspx (last access: 8 October 2013), 2012a. Ministry of Education: Early Childhood Education (ECE) Services
Listing (updated at 28 September 2012), available at: http://www. minedu.govt.nz/Parents/AllAges/ECEListing.aspx (last access: 8 October 2013), 2012b.
Murakami, H. and Kashiwabara, K.: Travel Means for Tsunami Evacuation in the 2011 Tohoku Pacific Ocean Earthquake – Questionnaire Survey in Natori City, in: Proceedings of the An-nual Conference of the Institute of Social Safety Science, 29, 11–12 November 2011, Shizuoka, Japan, 67–70, 2011.
Napier City Council: Statistics: Employment, available at: http:// www.napier.govt.nz/our-council/statistics/employment/, last ac-cess: 7 November 2013.
Napier Kindergartens: Our Kindergartens, available at: http:// www.napierkindergartens.co.nz/Our+Kindergartens, last access: 3 September 2012.
Okumura, Y., Harada, K., and Kawata, Y.: Evacuation Be-havior in the 29 September 2009 Samoa Islands Re-gion Earthquake Tsunami, J. Earthq. Tsunami, 05, 217–229, doi:10.1142/S179343111100108X, 2011.
Park, S., van de Lindt, J. W., Gupta, R., and Cox, D. T.: Method to determine the locations of tsunami vertical evacuation shel-ters, Nat. Hazards, 63, 891–908, doi:10.1007/s11069-012-0196-3, 2012.
Post, J., Wegscheider, S., Mück, M., Zosseder, K., Kiefl, R., Stein-metz, T., and Strunz, G.: Assessment of human immediate re-sponse capability related to tsunami threats in Indonesia at a sub-national scale, Nat. Hazards Earth Syst. Sci., 9, 1075–1086, doi:10.5194/nhess-9-1075-2009, 2009.
Power, W. L.: Review of Tsunami Hazard in New Zealand (2013 Update), Consultancy Report 2013/131, GNS Science, Lower Hutt, New Zealand, 2013.
Purser, D.: Comparisons of evacuation efficiency and pre-travel ac-tivity times in response to a sounder and two different voice alarms messages, in: Pedestrian and Evacuation Dynamics 2008, edited by: Klingsch, W. W. F., Rogsch, C., Schadschneider, A., and Schreckenberg, M., Springer-Verlag, Berlin, Heidelberg, 121–134, 2010.
Revi, A. and Singh, A. K.: Cyclone and storm surge, pedestrian evacuation and emergency response in India, in: Pedestrian and Evacuation Dynamics 2006, 1984, Springer-Verlag, Berlin, Hei-delberg, 2006.
Scheer, S. J., Gardi, A., Guillande, R., Eftichidis, G., Varela, V., De Vanssay, B., and Colbeau-Justin, L.: Handbook of Tsunami Evacuation Planning, SCHEMA Specific Targeted Research Project 030963, European Commission Joint Research Centre, Institute for the Protection and Security of the Citizen, Ispra, Italy, doi:10.2788/34292, 2011.
Southworth, F.: Regional Evacuation Modelling: a State-of-the-Art-Review, ORNL/TM 11740, Centre for Transportation Analysis, Oak Ridge National Laboratory, Oak Ridge, Tennessee, USA, 1991.
Statistics New Zealand: 2006 Census Data, available at: http:// www.stats.govt.nz/Census/2006CensusHomePage.aspx (last ac-cess: 3 September 2012), 2006.
Statistics New Zealand: Subnational Population Projec-tions: 2006 (base)–2031 (October 2012 update), available at: http://www.stats.govt.nz/browse_for_stats/population/ estimates_and_projections/SubnationalPopulationProjections_ MR0631UpdateOct12.aspx (last access: 24 November 2012), 2012a.
Statistics New Zealand: Territorial Authority (TA) by To-tal Accommodation: April 2012, available at: http: //www.stats.govt.nz/browse_for_stats/industry_sectors/ accommodation/accommodation-pivot-tables.aspx (last ac-cess: 10 August 2012), 2012b.
Statistics New Zealand: Accommodation pivot tables, available at: http://www.stats.govt.nz/browse_for_stats/industry_sectors/ accommodation/accommodation-pivot-tables.aspx (last access: 10 August 2012), 2012c.
Sugimoto, T., Murakami, H., Kozuki, Y., and Nishikawa, K.: A hu-man damage prediction method for tsunami disasters incorporat-ing evacuation activities, Nat. Hazards, 29, 585–600, 2003. Suzuki, T. and Imamura, F.: Simulation model of the evacuation
from a tsunami in consdieration of the resident consciousness and behaviour, Japan Soc. Nat. Disaster Sci., 23, 521–538, 2005. Tobler, W.: Three presentations on geographical analysis and mod-elling, Technical Report 93-1, National Center for Geographic Information and Analysis, University of California, Santa Bar-bara, 1993.
Tweedie, S. W., Rowland, J. R., Walsh, S. J., Rhoten, R. P., and Hagle, P. I.: A methodology for estimating emergency evacuation times, Soc. Sci. J., 23, 189–204, 1986.
Urbanik, T., Desrosiers, A., Lindell, M. K., and Schuller, C.: An Analysis of Techniques for Estimating Evacuation Times for Emergency Planning Zones, NUREG CR-1745, US Nuclear Regulatory Commission, Washington, D.C., 1980.
Wood, N. J. and Schmidtlein, M. C.: Community variations in pop-ulation exposure to near-field tsunami hazards as a function of pedestrian travel time to safety, Nat. Hazards, 65, 1603–1628, doi:10.1007/s11069-012-0434-8, 2013.
Yagi, S. and Hasemi, Y.: Requirements and verification methodol-ogy for the design performance of tsunami-hinan buildings (tem-porary tsunami refuge building), J. Disaster Res., 5, 591–600, 2010.