C. Falck1, M. Ramatschi1, C. Subarya2, M. Bartsch1, A. Merx1, J. Hoeberechts1, and G. Schmidt1
1GFZ German Research Centre for Geosciences, 14473 Potsdam, Germany
2Bakosurtanal, National Coordinating Agency for Surveys and Mapping, Cibinong 16911, Indonesia
Received: 13 October 2009 – Revised: 22 December 2009 – Accepted: 5 January 2010 – Published: 2 February 2010
Abstract. GPS (Global Positioning System) technology is widely used for positioning applications. Many of them have high requirements with respect to precision, reliability or fast product delivery, but usually not all at the same time as it is the case for early warning applications. The tasks for the GPS-based components within the GITEWS project (Ger-man Indonesian Tsunami Early Warning System, Rudloff et al., 2009) are to support the determination of sea levels (measured onshore and offshore) and to detect co-seismic land mass displacements with the lowest possible latency (design goal: first reliable results after 5 min). The com-pleted system was designed to fulfil these tasks in near real-time, rather than for scientific research requirements. The obtained data products (movements of GPS antennas) are supporting the warning process in different ways. The mea-surements from GPS instruments on buoys allow the earli-est possible detection or confirmation of tsunami waves on the ocean. Onshore GPS measurements are made collocated with tide gauges or seismological stations and give infor-mation about co-seismic land mass movements as recorded, e.g., during the great Sumatra-Andaman earthquake of 2004 (Subarya et al., 2006). This information is important to sepa-rate tsunami-caused sea height movements from apparent sea height changes at tide gauge locations (sensor station move-ment) and also as additional information about earthquakes’ mechanisms, as this is an essential information to predict a tsunami (Sobolev et al., 2007).
This article gives an end-to-end overview of the GITEWS GPS-component system, from the GPS sensors (GPS re-ceiver with GPS antenna and auxiliary systems, either on-shore or offon-shore) to the early warning centre displays. We describe how the GPS sensors have been installed, how they are operated and the methods used to collect, transfer and
Correspondence to: C. Falck ([email protected])
process the GPS data in near real-time. This includes the sensor system design, the communication system layout with real-time data streaming, the data processing strategy and the final products of the GPS-based early warning system com-ponents.
1 Introduction
In 2005 the German government initiated the GITEWS project as a reaction to the disastrous Indian Ocean tsunami of 26 December 2004. After the final handover all GITEWS system components will be operated by Indonesian partner institutions. Some components of the early warning system are based on GNSS-technology (Global Navigation Satel-lite System) using signals from Global Positioning System GPS. The geodetic branch of the GFZ, German Research Centre for Geosciences has a strong background in the op-eration of geodetic sensor networks including data process-ing and the development of task and environment adapted sensor stations. Many GPS measurement campaigns, with site surveys in Indonesia, were undertaken by GFZ for the GEODYSSEA project until 1998 (Wilson and Michel, 1998). All these points were important for GITEWS and resulted in newly designed GPS sensor networks covering landsides, coastal areas and open sea locations and a new near real-time data processing and monitoring system. Other tsunami early warning concepts as, e.g., at the PTWC (Pa-cific Tsunami Warning Center) use partly similar sensors like the DART buoys (Deep-ocean Assessment and Report-ing of Tsunamis, Meinig et al., 2005), but without GPS-based components. The implementation of GPS-GPS-based com-ponents (among other innovations) into InaTEWS (Indone-sian Tsunami Early Warning System) makes an important difference to earlier tsunami warning concepts.
Fig. 1. GITEWS GPS locations in Indonesia [numbers in squared brackets indicate installation status of December 2009]: 9 [7] GPS real-time
reference stations (green triangles), 9 [9] GPS at tide gauges (yellow squares), 10 [8] buoys with GPS (red circles).
2 GPS sensor systems for early warning systems
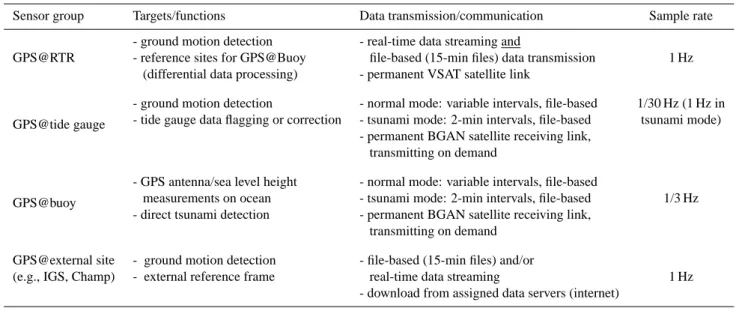
There are four groups of GPS sensor systems utilised by GITEWS. Three of the groups have been developed within GITEWS for their special tasks (real-time reference, tide gauge collocated, offshore measurement). The locations in Indonesia equipped with GITEWS GPS instrumentation are shown in Fig. 1. The fourth group of sensors contains ex-ternal GPS stations, e.g., as being part of the global IGS (International GNSS Service) network. The latter group is not necessary for the early warning tasks but provides a tie to a global reference frame. The first group of stations is the GPS real-time reference stations (GPS RTR), which are distributed over the main islands of Indonesia, mostly in the inland and collocated with seismological installations. They detect ground movements and provide an internal reference frame for other GITEWS GPS sensors. The second group of GPS sensors are collocated at tide gauge stations along coast lines. The third GPS sensor group is installed on buoys, which are anchored at open sea locations. All GITEWS GPS sensor stations utilise geodetic type dual frequency GPS/GNSS receivers (e.g., Septentrio PolaRx2 and PolaRx3, Topcon Net-G3) with choke ring antennas, meteo-sensors (Vaisala) and low power consumption computers (PC 104 standard). The types of GPS receiver and antenna are consid-ered to be of minor importance (within the indicated class of equipment). All sensor stations use VSAT (Very Small
Aper-ture Terminal) or BGAN (Broadband Global Area Network) as primary satellite communication system, which proved to perform well when properly installed. Most stations have a BGAN or IRIDIUM (low Earth orbit satellite system for mo-bile phone communication) system for backup or to allow failure recovery. The differences between the sensor station designs are due to the different fields of operation with sub-sequent different power supply, primary communication and operation concepts (see Table 1). One difference is the data transfer concept. Buoys and tide gauge stations operate with file-based data collection (one file per 10 min) and data trans-fer in intervals of some hours. Real-time retrans-ference stations permanently stream data with 1 Hz and collect the data in backup files, which are only used to fill gaps after temporary communication outages. GPS observations of all sensor sta-tion types are collected and transferred as raw observasta-tion data in binary format.
2.1 GPS RTR (Real-Time Reference) stations
The GPS RTR network provides reference stations for base-line mode processing of GPS sensor data from buoys and at tide gauges. Each GPS RTR station sends a GPS data stream in real-time at a data rate of 1 Hz, meteorological (5 min) and housekeeping data (1 min). The data are transmitted via a permanent VSAT satellite link and received through the VSAT hub at the warning centre in Jakarta. Coordinate time
GPS@buoy
- GPS antenna/sea level height - normal mode: variable intervals, file-based
measurements on ocean - tsunami mode: 2-min intervals, file-based 1/3 Hz - direct tsunami detection - permanent BGAN satellite receiving link,
transmitting on demand
GPS@external site - ground motion detection - file-based (15-min files) and/or
(e.g., IGS, Champ) - external reference frame real-time data streaming 1 Hz
- download from assigned data servers (internet)
series from these stations are updated at the warning centre in 5-min (normal mode) or 2-min intervals (tsunami mode) while coordinate time series from other GITEWS GPS sen-sors (see Sects. 2.2 and 2.3) can be updated in hourly in-tervals only. This allows a continuous ground motion track-ing for GPS RTR locations and continuous information about the GPS RTR stations’ availability. Strong incidents due to earthquakes and technical problems at the station or with the communication link should become visible very early.
The GPS RTR station design is based on a 19-inch rack mount construction housed in either a regular indoor rack (Fig. 2a) or weatherproof outdoor rack (Fig. 2b). Both rack-types have been tested in a climate chamber for proper oper-ation in the expected range of ambient temperature and hu-midity. The outdoor rack is a double case construction that allows passive cooling (no fans) without ventilation holes in the inner walls (convection between inner and outer walls). The outdoor box was selected for installations where no building was available to shelter the electronics. It gives suf-ficient protection against the different weather conditions in Indonesia and also against small animals and insects. Elec-tronic components are installed in service-friendly modules, connected through front side cables. Even off-the-shelf com-ponents have their own extra cases to allow easy replacement in case of a malfunction. A set of batteries is placed next to the rack and allows the system to operate for more than 2 days in the case of mains power failure. The outdoor rack is larger than the indoor rack since it also includes the batter-ies inside.
The GPS RTR stations are distributed over the main is-lands of Indonesia, mostly away from the coast. Most are collocated with seismological stations sharing a VSAT com-munication terminal. All station locations are hosted by
(a) (b)
Fig. 2. Left: front of GPS RTR station; right: outdoor box with
double walls and passive cooling.
BMKG (Indonesian Agency for Meteorology, Climatology and Geophysics), providing the locations with infrastructure and local support. The installation itself is supported by BAKOSURTANAL (National Coordinating Agency for Sur-veys and Mapping) which also maintains the GPS sensor sta-tion health monitoring and maintenance. A typical, deployed station setup is shown in Fig. 3 (installation at Maumere, Flo-res Island, Indonesia). The station is equipped with a VSAT antenna, a meteo sensor system, solar cell arrays for seis-mological power supply, a GPS choke ring antenna and a subsurface bunker (right side, only entrance lid visible below the chair) for the seismological equipment and the GPS re-ceiver rack. The GPS antenna and the VSAT communication antenna are installed on separate steel masts moulded in rein-forced concrete basements (1 m×1 m×1 m each), which are
expected to give sufficient (mm level) stability.
4 Fig. 3. GPS RTR station at Maumere, collocated with seismological instrumentation.
2.2 GPS sensor stations at tide gauges
These GPS sensors are collocated with tide gauge stations at coast line locations. The system design is similar to the GPS RTR station design using modular components (Sch¨one et al., 2008). GPS data are collected (beside tide gauge data) and locally stored at a rate of 1 Hz. In normal mode the data are sent in configurable time intervals (e.g., some hours) over a BGAN satellite link, sampled down to 1/30 Hz. There is a permanent BGAN receiving link at the station, in order to enable the reception of messages from the warning centre. If the tide gauge station receives a tsunami mode message from the warning centre, or detects a tsunami-like change of the local sea level, it immediately starts to send the most recent 1-Hz data to the warning centre and enters a near real-time data transmission mode to transfer actual measurements. The near real-time data processing system at the warning centre then provides information on possible ground movements. This information can either be used to flag the collocated tide gauge measurements as being not useable (due to a ver-tical sensor station movement) or to correct the tide gauge data measurements with the detected sensor station move-ment values. If not being corrected or flagged invalid a ver-tical tide gauge station movement of a certain value may be misinterpreted as a sea level change of the same value (but in opposite direction).
2.3 GPS sensors on buoys
All GITEWS buoys (up to 10 buoys south off Sumatra and Java) carry a GPS sensor system. The idea is to detect, as soon as possible, a passing tsunami wave that causes a tem-porary sea level anomaly. Such an anomaly has a long period signature that allows the separation from normal sea waves with short period signatures as described in earlier works and demonstrated through experiments (Kato et al., 2000). The GITEWS buoys are anchored at deep sea locations and show changing coordinates and variable elevations. However, only the vertical component of the coordinates is of interest.
Aux-iliary sensors for dipping and tilting are installed to apply corresponding corrections to the vertical component of the processed GPS data. Due to power supply constraints (so-lar cells), data from buoys are regu(so-larly sent via a BGAN satellite link in intervals of several hours only. The GPS data time resolution is 1/3 Hz. After being switched to tsunami mode operation data still missing at the warning centre are sent immediately, followed by a period of near real-time data delivery. The GPS data are then processed at the warning centre in baseline mode, with at least one RTR station as ref-erence. The buoy systems are switched to tsunami mode op-eration either by reception of a tsunami mode message from the warning centre (same principle as at the tide gauges) or by one of some special sensors on the ocean bottom. These special sensors, OBU (Ocean Bottom Unit) and PACT (Pres-sure based Acoustically Coupled Tsunami detector) mea(Pres-sure, e.g., the hydrostatic pressure and send their data via an acous-tic communication link to the buoy.
3 Automatic near real-time GPS data processing
4 Fig. 4. GPS data processing in normal mode and tsunami mode.
centres (e.g., IGS) are not available with low latencies, the predicted part of ultra rapid orbits is used instead. In addi-tion, GPS broadcast ephemeris data (transmitted by the GPS satellites) are received through the GPS RTR network sta-tions. This less accurate orbit information is used only in case that ultra rapid orbit information is not accessible for any reason. There are different processing jobs for land sta-tion data and buoy data, which can be executed at the same time. The GPS processing system can be operated in two modes, the normal mode and the tsunami mode (as shown in Fig. 4).
3.1 Normal mode GPS data processing
In normal mode, all new data of all sensors are pro-cessed to allow a continuous sensor performance monitor-ing. As a result the system delivers processed data to the GPS GUI (Graphical User Interface) in order to display the GITEWS GPS network status. This task is not time critical and can be fulfilled, e.g., in 5-min intervals. Data from tide gauges and buoys are processed less often as these sensors send the data in flexible intervals (several hours) depending on local battery power and other constraints. At all times the GPS data processing system listens for a possible tsunami mode (pre-alert) message. These messages are generated by
the DSS (Decision Support System) when a strong earth-quake or another tsunami-relevant event has been detected. The messages are distributed over the TSB (Tsunami Ser-vice Bus), which supports the exchange of data and informa-tion between the warning centre system components (internal communication). If such a message is received by the GPS processing system, it cancels all normal processing activities and switches the GPS system to tsunami mode. There is no function to set a tsunami mode or alert by GPS-based com-ponents themselves. Such functionality could be added at a later time, triggered, e.g., by automatic detection of a sudden change of station coordinates.
3.2 Tsunami mode GPS data processing
The first step in tsunami mode, after immediate terminating all processes of the normal mode, is the processing of data from GPS real-time reference (RTR) stations. The raw data of these sensors are received continuously (1 Hz) in real-time and are therefore available without significant delay due to data transfers. Meanwhile GPS sensors at buoys and tide gauges are switched to near real-time data transmission and all available data retrieved. Then the system processes data of the 10 most relevant sensors, but in a 2-min interval. The corresponding list of most relevant sensors is determined by
5
Fig. 5. Displacement determination from coordinate time series (up component only).
5 Fig. 6. Coordinate time series with seismic signal signatures, before and after filtering.
the DSS (e.g., stations located nearest to the earthquake fo-cus) and provided over the TSB. The shorter time interval of 2 min is needed to keep the latency of the early warning re-sults small while maintaining a high time resolution. The rea-son for having two processing modes is the limited computer capacity. It is not possible to process the high rate GPS data for all sensors over short time intervals.
3.3 GPS data from onshore locations (ground tracking system)
The mean coordinates based on the last processed GPS data (2-min windows of 1 Hz data) are compared with the mean coordinates of the same location over a 30-min time window, ending right before the earthquake occurrence time. This procedure is illustrated in Fig. 5 using a synthetic coordi-nate trace of unfiltered data (blue line, up component only). At about 07:10 h the blue line changes its mean level due to the simulated earthquake, being modulated with a seismic signal during the next minutes. Each green bar represents
the difference between a 2-min processing interval and the initial coordinate component prior to the earthquake (zero level). These differences correspond to the observed land mass movements, also called displacements. The red bars at the bottom of the green bars show the calculated errors (cal-culated with variance propagation law) of the displacements (being higher when seismic signals are present). The mean error values are used as a measure of reliability and prevent the automatic product delivery (earthquake displacement val-ues) if too high.
and without any operator interpretation to the warning centre GTS (Ground Tracking System) display and decision sup-porting systems, e.g., to flag tide gauge data as described in Sect. 2.2. The displacement values are also and most advantageous used by the GITEWS SIM (simulation) mod-ule. This module selects the most probable tsunami scenario from some thousands of pre-calculated scenarios, based on a matching process with all available, different sensor system measurements (Behrens et al., 2008).
3.4 GPS data from offshore locations
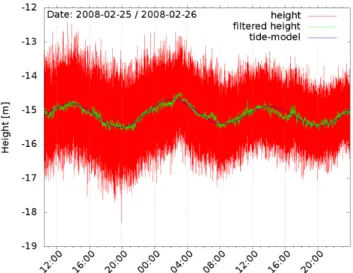
GPS data sets from buoys are processed in baseline mode with GPS RTR stations as reference. Figure 7 is an example covering approximately 1.5 days of processed GPS data from a buoy. The red line (coordinate time series of vertical com-ponent, values between –12.5 m and –17.5 m) represents the final product of the GPS processing. It is the instant height of the GPS antenna, which does not yet fully correspond to the sea level height. Some corrections provided by dedicated sensors, e.g., due to tilting and dipping of the buoy still need to be applied. The processing from antenna height to sea level height is not part of the GPS data processing system. It is part of the oceanographic (buoy) data processing system and not subject of this paper.
However, an estimation of the GPS data processing quality (without corrections as mentioned above) can be achieved through the use of a low pass filter in order to suppress the high frequency signals coming from normal ocean waves and buoy movements. The green line represents the same data as the red line, but low pass filtered. The tidal frequency is clearly visible. A comparison with data from a normal tide model as reference (blue line) shows a good agreement.
4 GPS data processing system GUI (graphical user interface)
A new graphical user interface for the GPS processing and network monitoring was developed and installed at the tsunami warning centre in Jakarta. The GUI supports both, a quick view for all staff members at the warning centre (24 h/7 d operation) as well as more thorough analysis. It is web-based and allows a flexible and user selectable
arrange-6
Fig. 7. Processed data from a GPS sensor on a buoy (red), filtered
(green) and a tide model (blue).
ment of individual frames as well as being viewed at remote locations outside the warning centre. This part of the concept supports the dialogue between warning centre staff on duty or on standby and sensor station maintenance staff. Figure 8 shows a screenshot (taken from the developing system at the GFZ in Potsdam) of the “processing view” screen as one ex-ample of the new GUI pages. It shows details about the sta-tus (e.g., which types of orbit information are available) and the progress of the GPS data processing (current processing steps etc.) and if there were any problems during previous processing times. Although not needed for the processing it-self, this view is important for operators to confirm a proper system function, especially in case of a tsunami pre-alert.
Another view gives a network status overview on a move-able map (similar to Fig. 1) with zoom functions. Symbols indicate the different sensor station types and states (GPS real-time reference, GPS at tide gauge or buoy and other stations). The health status of each GPS station is colour-coded (green, yellow and red). Special symbols are displayed if there is no connection to a station due to communication problems or if a sensor power supply or battery voltage has dropped below a critical level. The status over time (24 h) is displayed by a GUI page with one horizontal bar for each station. It has an automatic update function, but can also be shifted on the time scale, which allows inspection of network station performance in the past. A mouse click on a particular station performance bar at a particular point of time opens a popup window displaying the corresponding station data for detailed analysis. There are more views available, e.g., for coordinate time series traces and quality check parameters and with individual station information, such as local con-tacts and infrastructure including pictures of the sites.
Fig. 8. Screenshot of GPS data processing view.
5 Summary and outlook
A GPS-based tsunami early warning component, developed by GFZ within the GITEWS project, was installed in Indone-sia. The system provides measurements of land mass move-ments due to earthquakes and coordinates of GPS sensors on buoys, corresponding to sea levels. It supports the prediction of a tsunami using GPS data from land and the detection and confirmation of a tsunami with offshore-measured data at the earliest possible time. In addition, the data can be used to improve the reliability of tide gauge data by confirming that a tide gauge location has not moved during an earthquake. The provision of all this information is expected to signif-icantly increase the reliability of tsunami early warnings. Test installations of single frequency receivers close to 2 fre-quency receiver locations are planned as well as the
instal-lation of more BGAN modems (less tight antenna pointing requirements than for VSAT). This will further increase the system reliability, which is most important for early warning applications. A function for a tsunami pre-alert, released due to automatically detected displacements measured by GPS, may be added at a later time.
Acknowledgements. The GITEWS project (German Indonesian
Tsunami Early Warning System) is carried out through a large group of scientists and engineers from different German research institutes under the leadership of the GFZ, German Research Centre for Geosciences. Funding is provided by the German Federal Ministry for Education and Research (BMBF), Grant 03TSU01.
Edited by: U. M¨unch
Reviewed by: P. H. Denys and two other anonymous referees
2000.
Meinig, C., Stalin, S. E., Nakamura, A. I., and Milburn, H. B.: Real-Time Deep-Ocean Tsunami Measuring, Monitoring, and Report-ing System: The NOAA DART II Description and Disclosure, 2005.
Rudloff, A., Lauterjung, J., M¨unch, U., and Tinti, S.: Preface “The GITEWS Project (German-Indonesian Tsunami Early Warning System)”, Nat. Hazards Earth Syst. Sci., 9, 1381–1382, 2009, http://www.nat-hazards-earth-syst-sci.net/9/1381/2009/.
Andaman earthquake, Nature, 440, 46–51, 2006.
Wilson, P. and Michel, G. W. (Eds.): The GEODYnamics of S and SE Asia (GEODYSSEA) Project, Scientific Technical Report STR 98/14, Geoforschungszentrum Potsdam, Commission of the European Community, EC contract CI1*CT93-0337, 1998.
![Fig. 1. GITEWS GPS locations in Indonesia [numbers in squared brackets indicate installation status of December 2009]: 9 [7] GPS real-time reference stations (green triangles), 9 [9] GPS at tide gauges (yellow squares), 10 [8] buoys with GPS (red circles).](https://thumb-eu.123doks.com/thumbv2/123dok_br/16321577.187539/2.892.72.826.95.506/locations-indonesia-brackets-indicate-installation-december-reference-triangles.webp)