www.hydrol-earth-syst-sci.net/16/2703/2012/ doi:10.5194/hess-16-2703-2012
© Author(s) 2012. CC Attribution 3.0 License.
Earth System
Sciences
Use of laser-scan technology to analyse topography and flow in a
weir pool
P. E. Dresel1, P. Hekmeijer1, J. F. Dean2, W. Harvey1, J. A. Webb2, and P. Cook1
1Department of Primary Industries, Bendigo, Victoria, Australia 2La Trobe University, Melbourne, Victoria, Australia
Correspondence to:P. E. Dresel (evan.dresel@dpi.vic.gov.au)
Received: 10 January 2012 – Published in Hydrol. Earth Syst. Sci. Discuss.: 20 March 2012 Revised: 25 June 2012 – Accepted: 10 July 2012 – Published: 13 August 2012
Abstract. The development of laser-scan techniques
pro-vides opportunity for detailed terrain analysis in hydrologic studies. Ground based scans were used to model the ground surface elevation in the area of a stream gauge weir over an area of 240 m2at a resolution of 0.05 m. The terrain model was used to assess the possibility of flow bypassing the weir and to calculate stream flow during filling of the weir pool, prior to flow through the weir notch. The mapped surface shows a subtle low-lying area at the south end of the struc-ture where flow could bypass the weir. The flow calculations quantify low-flows that do not reach the weir notch during small rain events and flow at the beginning of larger events in the ephemeral stream.
1 Introduction
Low-flow hydrology is a research area concerned with flow periods of seasonally-low perennial flow, ongoing flow dur-ing drought periods, and intermittent to ephemeral flow peri-ods not directly supported by precipitation. Smakhtin (2001) reviewed low-flow hydrology with a focus on perennial flow systems. Low-flow periods are important in water resource allocation (Gustard and Demuth, 2008) and the duration of low flow periods has ecological consequences for aquatic biota and riparian vegetation (Stubbington et al., 2009; Katz et al., 2012). Water quality may be affected during times of low flow, including impacts on water temperature, oxy-gen levels, salinity, and development of inland acid sulfate soils (Fitzpatrick et al., 2008; Hladyz et al., 2011; Devito and Hill, 1997; Hart et al., 2008; Austin et al., 2010). Wooldridge et al. (2003) discuss the difficulties in hydrologic model
parameter estimation for low-yielding ephemeral catchments due to the limited information content of the low flow peri-ods. In this study we present a terrestrial laser scan method to extend the low-flow measurement range of a V-notch knife edge weir gauge, which can provide additional information on the flow regime during weather cycles.
Light detection and ranging (lidar) technology or laser scan technology, provides a powerful method for terrain and vegetation analysis that is beginning to have widespread ap-plication in hydrology. Wehr and Lohr (1999) reviewed the design and use of airborne systems. Lidar and terrestrial laser scan methods provide extremely detailed information on ground surface elevation that has been applied to improv-ing inundation and flood assessment (Schumann et al., 2008; Cobby et al., 2001; Frazier et al., 2012) and assessed for reservoir gauging (Tamari et al., 2011). A distinction can be made between airborne lidar deployment and terrestrial laser scanning with airborne systems more suited to wide area measurements approximately normal to the land surface and terrestrial systems generally suited to detailed studies and to studies where the vertical plane is imaged. Quite complete 3-D images can be developed by combining multiple terres-trial scans although dense vegetation can obscure the actual ground surface (Coveney and Stewart Fotheringham, 2011).
2 Study location
2
7
0
280
260
290
3
0
0
31
0
30 0
2 80
260
270
30 0
Melbourne
0 450 Meters
Victoria
Plantation Catchment
Pasture Catchment Weir Site
Plantations
Catchment Boundary
Study Location
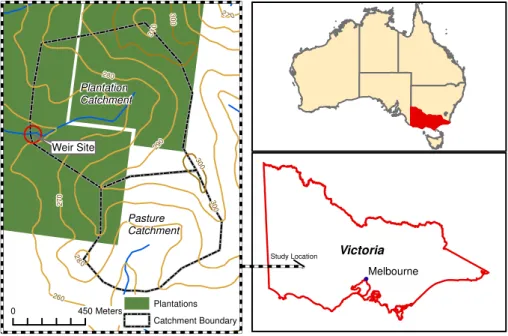
Fig. 1.Weir site location.
flow and a preponderance of intermittent streams. In recent years, southwestern Victoria has seen an increase in planta-tion forestry, increase in cropping, and a shift from annual to perennial pasture (Department of Sustainability and En-vironment, 2011; Benyon et al., 2009). Increased annual ET from afforestation of grasslands or cropping areas is gener-ally observed (e.g. Zhang et al., 2001; Benyon, 2002; Benyon et al., 2006), resulting in decreased stream flow (Bosch and Hewlett, 1982; Bubb and Croton, 2002; Best et al., 2003). As pointed out by Lane et al. (2005), the impacts of chang-ing land use on the total flow regime and flow duration curves is less well understood with some of their studied catchments showing a greater increase in zero-flow days after afforesta-tion, while another group shows a more uniform reduction in flows across all flow duration percentiles. A review of paired catchment studies by Best et al. (2003) indicates vegetation changes have a greater effect on low flows than high flows in Australian studies.
The study area is located near Mirranatwa, 230 km west of Melbourne, in Victoria Australia (Fig. 1). The area is surrounded on three sides by sandstone ridges of the Grampians Range. Bedrock consists of weathered to con-solidated granitic rock. Surface colluvium is found in the lower part of the catchment, but granitic outcrop is seen even at the weir location. By the Australian Soil Classification (Isbell, 2002) soils are bleached-mottled, eutrophic, brown chromosols.
The catchment monitoring consists of a stream gauge at the bottom of the catchment, stream salinity monitor-ing, full weather stations (rainfall, humidity, solar radiation, wind speed and direction, evaporation pans, and groundwater monitoring at the weir location and through the catchments).
Sapflow and soil moisture are also being monitored. The weir area studied is in a plantation catchment where the blue gum
(Eucalyptus globulus) trees were planted in 2008. The
catch-ment area for the weir is 2265 ha and the elevation of the catchment divide is approximately 50 m above the weir ele-vation. Stream flow is intermittent.
The initiation of this project corresponded to the beginning of a year of higher than average rainfall (Australian Govern-ment Bureau of Meteorology, 2011). This produced a num-ber of challenges to the stream flow monitoring system in the plantation catchment, especially since a reliable baseline had not yet been established. In particular, at this study site (Fig. 1) under wet conditions, surface water leakage was ob-served at the southern wing of the weir and downstream of the structure. A sheet-pile extension was installed to extend the eastern wing but the continued presence of surface water suggested that at least some of the flow resulted from lateral inputs from interflow or groundwater discharge.
streamflow where minor flow events may be important un-der drier conditions, e.g. for maintaining ecologic refuges in downstream remnant pools.
3 Method
A V-notch knife edge weir was installed at the study catch-ment. Weir stage is measured with a stilling well-float sys-tem and logged with stream electrical conductivity and rain-fall. Water levels in the weir pool are logged at 30 min inter-vals. Rainfall is logged at 10 min intervals during precipita-tion events. The weir rating curve was provided by the instal-lation contractor. The minimum water level measured is ap-proximately−0.2 m in local coordinates, relative to the stick
gauge in the pool. The minimum level for flow through the weir is 0.1 m; the top of the knife edgeV is at 0.3 m.
The weir area was imaged in non-georeferenced local co-ordinates using a LeicaTMScanStation C10 laser scanner in units of meters. The instrument has a rotating scan head that covers a 360◦field of view in the horizontal plane by 270◦ in the vertical plane. The data are corrected with an internal dual-axis compensator. Scans were collected from 4 stations and included 4 reflective backsight targets for registration of the scans into a single point cloud. Instrument height above ground was measured with the GHM008 instrument height meter in conjunction with the GHT196 distance holder, in-cluded with the scanner. At each station the scanner was set up using the “resection” option for setup at an unknown lo-cation by scanning the fixed target lolo-cations. Scan resolu-tion was set at a predefined “medium” setting that provides a point spacing of 10×10 cm at a distance of 100 m. Actual
point spacing is lower because the distance across the area is less than 100 m and the points from all 4 stations were combined.
Scans were processed using Leica Cyclone software. The resulting point cloud combines the individual scans and de-fines “XYZ” and intensity values for each reflection in the local coordinates. The point clouds were not georeferenced but the y-axis was defined to correspond roughly to N–S for convenience. The instrument’s levelling process ensures that the z-direction is “up” – normal to a horizontal surface.
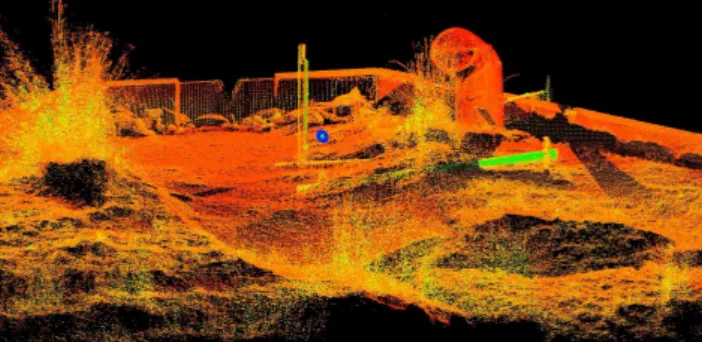
The scan of the weir area was clipped to 240 m2for visu-alisation so that the data points stand out against the empty background (e.g. Fig. 2) and for subsequent processing. No further editing of the point features was performed so the cloud includes vegetation and man-made structures such as the housing for sensors and the stilling well/data logger, within the pool area. Local coordinate elevations of the bot-tom of the V-notch and top of the stick gauge in the pool area were recorded from points at those locations.
The point cloud was exported as a text file for transfer to ESRI ArcMapTMfor analysis. The ArcMap analysis fol-lowed a work flow similar to one used for analysis of airborne lidar data: the points were imported in ArcMap “multipoint”
Fig. 2. Point-cloud image of weir area showing V-notch, stick gauge, and stilling well/logger housing. The bright blue point is a reference reflector used for combining scans from different loca-tions and the green angled tube is the housing for a conductivity sensor.
format designed for efficient storage of large point data sets. The point cloud contained 11 648 961 points with an average spacing of 0.005 m.
The point data were used to produce a 0.05 m resolution raster representing the topography, using the minimum point elevations within each cell. The minimum height value was used to reduce the effect of vegetation. This method is simi-lar to the “grid based elevation filter” of Coveney and Stew-art Fotheringham (2011). The pool volume and area of in-undation at different water levels were calculated by defin-ing polygons coverdefin-ing the pool area, set at different eleva-tions, then performing volume calculations of the difference between those and the raster surface.
4 Results
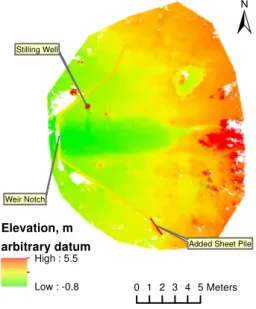
The gridded weir topography (digital terrain model) is shown in Fig. 3. Areas of no data, where the surface was hidden, are shown in white and mainly occur outside the pool area. Although it is possible to fill in estimated surface eleva-tions, the missing data were not considered significant for the calculations.
Figure 4 shows the calculated area of inundation for the pool at the height of the bottom of the weir V-notch (Fig. 4a) and the top of theV (Fig. 4b). The images show some low areas along the southern concrete structure where only the sheet piling prevents flow around the weir. The detailed to-pography determined from the laser scan would have im-proved the weir design, had it been available prior to instal-lation. Wet areas at the surface observed after installation of the sheet pile most likely represent lateral flow from the sides of the valley and thus flow from outside the measured catchment.
Elevation, m
arbitrary datum
High : 5.5
Low : -0.8 0 1 2 3 4 5 Meters
Added Sheet Pile Stilling Well
Weir Notch
Fig. 3.Digital terrain model of the weir area. Elevations are in me-ters above an arbitrary “scanner datum”.
the point cloud. The calculated stage vs. volume for the weir pool is shown in Fig. 5. The data are fit by a quadratic equa-tion (R2 of 0.9996). The flow across the weir is calculated from the weir rating curve. Prior to flow through the notch, the flow,Q, was calculated from the change in pool volume:
Q= dV
dt =
(Vt −Vt−1)
1t
where1tis the time step andVtandVt−1are the volumes of water in the pool at timetand at the previous time stept−1.
Water levels were recorded at 30 min time steps.
Calculation of the flow filling the pool assumes that the loss to evaporation or through the soil column is slow rela-tive to the stream flow. The method does not measure flow during recession – to do so would require determination of infiltration rates at different pool levels and correction for evaporation.
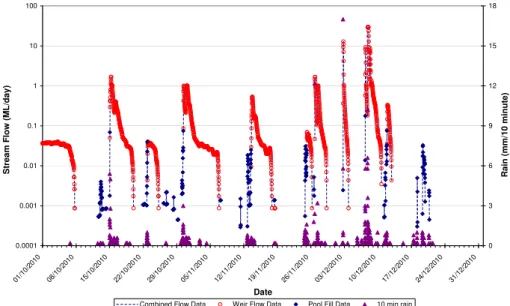
Stream response to precipitation is rapid, even for rain events of less than 10 mm (Fig. 6). For example, 8.4 mm of rain starting at 06:40 LST 19 December 2010 produced a measurable response in stream level by 07:30 LST. Flow did not reach the weir notch at any time for this event so the event would be missed by conventional gauging. Inclusion of the flow filling the weir pool provides a more complete picture of the surface water response to precipitation events. Overall the flow filling the pool is a minor component of the mea-sured stream flow. However, the pool filling is significant for those small rain events during periods of discontinuous sur-face water flow and would be more significant at other sites with greater pool volumes.
Pool Area
Water at bottom of V
Pool Area
Water at top of V
0 1 2 3 4 5 Meters A
B
Fig. 4.Calculated areal extent of weir-pool.(A)Water level at
bot-tom of V-notch in weir.(B)Water level at top of V-notch in weir.
y = 40.836x2 + 20.768x + 2.677 R2 = 0.9996
0 1 2 3 4 5 6
-0.3 -0.25 -0.2 -0.15 -0.1 -0.05 0 0.05 0.1 0.15
Water level relative to stick gauge, m
P
o
o
l
v
o
lu
m
e
,
m
3
Calculated pool volume
Fig. 5.Pool level vs. volume relationship for the weir pool at lev-els lower than exit flow, showing volumes calculated from the laser scan and the polynomial fit to the data. The bottom of the weir notch is at a height of 0.1 m on the stick gauge.
5 Discussion
Ground based laser scan data have distinct advantages and disadvantages compared to conventional surveys. Conven-tional transit surveys and differentially corrected GPS sur-veys do not provide as much spatial detail and are generally slower in open terrain. Integrated GPS location of laser scan-ner positions is an option that was not used for this work. It is also possible to set up the scanner on known benchmarks or to scan readily identifiable benchmark locations to tie the scan points to global coordinates. Local coordinates were suitable for this work but a more rigorous survey procedure would have simplified the analysis somewhat. In particular, survey accuracy is more difficult to assess in the absence of ties to benchmarks or other known points.
0.0001 0.001 0.01 0.1 1 10 100 01 /10 /20 10 08 /10 /20 10 15 /10 /20 10 22 /10 /20 10 29 /10 /20 10 05 /11 /20 10 12 /11 /20 10 19 /11 /20 10 26 /11 /20 10 03 /12 /20 10 10 /12 /20 10 17 /12 /20 10 24 /12 /20 10 31 /12 /20 10 Date S tr e a m F lo w ( M L /d a y ) 0 3 6 9 12 15 18 R a in ( m m /1 0 m in u te )
Combined Flow Data Weir Flow Data Pool Fill Data 10 min rain
Fig. 6.Stream flow (30 min intervals) and rainfall (10 min intervals) at the catchment weir site. Open red circles show stream flow from the weir rating curve. Solid blue diamonds show flow calculated from increases in pool volume at levels lower than the weir notch.
based scans. The weir pool was surveyed when empty and this would be difficult to coordinate with a lidar survey. How-ever, lidar data are generally post processed to attribute the return points as ground returns or other returns (e.g. from vegetation or structures), which would ease construction of the local digital terrain model. It should be noted that our terrain elevations from outside the weir pool were affected by the site infrastructure such as the communications tower. There may be a similar effect from dense vegetation within the pool, but inspection of the point cloud suggests that it is likely to be minor. Coveney and Fotheringham (2011) present a study of the errors introduced in digital terrain mod-els from dense vegetation depth/occlusion of the bare ground surface in terrestrial laser scanner measurements. A similar assessment was not possible here but there are several indi-cations that residual errors after developing the terrain model are considerably lower in our study. First, our 240 m2 scan area is considerably smaller than their 8.5 ha and we scanned most of the area from multiple directions, decreasing the like-lihood of occlusion by vegetation. In addition, the vegetation in our study area is almost certainly less dense. The simpli-fied gridding approach was suitable for our purpose.
Small flows into the weir pool without overflow through the notch may be important measures of the rewetting of ephemeral flow systems during drier months. That rewetting is hypothesised to be a positive effect for maintaining ecosys-tem health in downstream reaches. Although tree cover is known to increase evapotranspiration relative to annual pas-ture and is likely to decrease stream flow in most catchments, the effect of the land cover on the timing of flow is poorly understood. The laser scanner analysis is useful in evaluating the dynamics of flow in ephemeral systems.
6 Conclusions
The laser scanner data provide a convenient way to analyse flow at and around a weir gauge. The detailed terrain analysis would be helpful in designing weirs in areas of relatively flat topography and would have avoided the need to install sheet piling to extend the southern wing of the structure. Volume analysis allows calculations of flow into the weir at levels that do no overflow the weir notch. Weirs in ephemeral systems will always underestimate early flow while the pool fills up to the notch height. Whether that flow is significant depends on the nature of the study. Our study concerns the dynamics of surface water flows in response to precipitation under dif-ferent land uses as well as the total water budget, so the small flow events are of interest.
The laser scanner is a relatively fast and simple tool to use for detailed terrain analysis. From an end user perspective, the lack of defined ground returns, as typically supplied with lidar data, adds to the complexity of analysis although the simplifying assumption of using the minimum return height for ground elevation was suitable here. Future work will in-corporate protocols for georeferencing the scan data to ease integration with other survey products and to ease the use of the data in geographic information system software tools.
Acknowledgements. This project was funded by the State of Vic-toria. The study would not have been possible without the support of landholders, Iven, Iris and Marcia Field and the plantation management, McEwen’s Contracting Pty Ltd.
References
Austin, J., Zhang, L., Jones, R., Durack, P., Dawes, W., and Hair-sine, P.: Climate change impact on water and salt balances: an as-sessment of the impact of climate change on catchment salt and water balances in the Murray-Darling Basin, Australia, Climatic Change, 100, 607–631, 2010.
Australian Government Bureau of Meteorology: Climate Data On-line: http://www.bom.gov.au/climate/data/index.shtml, last ac-cess: 14 December 2011.
Benyon, R. G.: Water use by tree plantations in the Green Trian-gle: A review of current knowledge, Glenelg Hopkins Catchment Management Authority and CSIRO Forestry and Forest Prod-ucts, Hamilton, VIC, 2002.
Benyon, R. G., Theiveyanathan, S., and Doody, T. M.: Impacts of tree plantations on groundwater in south-eastern Australia, Aust. J. Bot., 54, 181–192, doi:10.1071/BT05046, 2006.
Benyon, R. G., Doody, T. M., Theiveyanathan, S., and Koul, V.: Plantation forest water use in southwest Victoria, Forest & Wood Products Australia, Melbourne, VIC, 2009.
Best, A., Zhang, L., McMahon, T., Western, A., and Vertessy, R.: A critical review of paired catchment studies with reference to seasonal flows and climatic variability, CSIRO, Canberra, ACT, 2003.
Bosch, J. M. and Hewlett, J. D.: A review of catchment experiments to determine the effect of vegetation changes on water yield and evapotranspiration, J. Hydrol., 55, 3–23, doi:10.1016/0022-1694(82)90117-2, 1982.
Bubb, K. A. and Croton, J. T.: Effects on catchment water balance
from the management ofPinusplantations on the coastal
low-lands of south-east Queensland, Australia, Hydrol. Process., 16, 105–117, doi:10.1002/hyp.310, 2002.
Cobby, D. M., Mason, D. C., and Davenport, I. J.: Image process-ing of airborne scannprocess-ing laser altimetry data for improved river flood modelling, ISPRS J. Photogramm. Remote S., 56, 121– 138, doi:10.1016/S0924-2716(01)00039-9, 2001.
Coveney, S. and Stewart Fotheringham, A.: Terrestrial laser scan error in the presence of dense ground vegetation, Photogramm.
Rec., 26, 307–324, doi:10.1111/j.1477-9730.2011.00647.x,
2011.
Department of Sustainability and Environment: Western Region Sustainable Water Strategy, Victoria Department of Sustainabil-ity and Environment, Melbourne, VIC, 2011.
Devito, K. J. and Hill, A. R.: Sulphate dynamics in relation to groundwater-surface water interactions in headwater wetlands of the southern Canadian Shield, Hydrol. Process., 11, 485–
500, doi:10.1002/(SICI)1099-1085(199704)11:5<
485::AID-HYP455>3.0.CO;2-F, 1997.
Fitzpatrick, R., Marvanek, S., Shand, P., Merry, R., and Thomas, M.: Acid Sulfate Soil Maps of the River Murray below Blanchetown (Lock 1) and Lakes Alexandrina and Albert when water lev-els were at pre-drought and current drought conditions, CSIRO, Canberra, ACT, 2008.
Frazier, P., Ryder, D., McIntyre, E., and Stewart, M.: Understand-ing Riverine Habitat Inundation Patterns: Remote SensUnderstand-ing Tools and Techniques, Wetlands, 32, 225–237, doi:10.1007/s13157-011-0229-9, 2012.
Gustard, A. and Demuth, S.: Manual on low-flow estimation and prediction, in: Operational Hydrology Report No. 50, World Me-teorological Organization, Geneva, 2008.
Hart, B. T., Hines, T., and Coller, B. A.: Geochemistry of Cu, Zn and Fe in the Tambo River, Australia, II. Field investiga-tion under low-flow condiinvestiga-tions, Mar. Freshwater Res., 59, 80–88, doi:10.1071/MF07057, 2008.
Hladyz, S., Watkins, S. C., Whitworth, K. L., and Bald-win, D. S.: Flows and hypoxic blackwater events in man-aged ephemeral river channels, J. Hydrol., 401, 117–125, doi:10.1016/j.jhydrol.2011.02.014, 2011.
Isbell, R. F.: The Australian Soil Classification. Revised Edition, CSIRO Publishing, Collingwood, VIC, 2002.
Katz, G. L., Denslow, M. W., and Stromberg, J. C.: The Goldilocks effect: intermittent streams sustain more plant species than those with perennial or ephemeral flow, Freshwater Biol., 57, 467–480, doi:10.1111/j.1365-2427.2011.02714.x, 2012.
Lane, P. N. J., Best, A. E., Hickel, K., and Zhang, L.: The response of flow duration curves to afforestation, J. Hydrol., 310, 253–265, doi:10.1016/j.jhydrol.2005.01.006, 2005.
Schumann, G., Matgen, P., Cutler, M. E. J., Black, A., Hoffmann, L., and Pfister, L.: Comparison of remotely sensed water stages from LiDAR, topographic contours and SRTM, ISPRS J. Photogramm. Remote S., 63, 283–296, doi:10.1016/j.isprsjprs.2007.09.004, 2008.
Smakhtin, V. U.: Low flow hydrology: a review, J. Hydrol., 240, 147–186, doi:10.1016/S0022-1694(00)00340-1, 2001.
Stubbington, R., Wood, P. J., and Boulton, A. J.: Low flow con-trols on benthic and hyporheic macroinvertebrate assemblages during supra-seasonal drought, Hydrol. Process., 23, 2252–2263, doi:10.1002/hyp.7290, 2009.
Tamari, S., Mory, J., and Guerrero-Meza, V.: Testing a near-infrared Lidar mounted with a large incidence angle to monitor the water level of turbid reservoirs, ISPRS J. Photogramm. Remote S., 66, S85–S91, doi:10.1016/j.isprsjprs.2011.01.009, 2011.
Wehr, A. and Lohr, U.: Airborne laser scanning – an introduction and overview, ISPRS J. Photogramm. Remote S., 54, 68–82, doi:10.1016/S0924-2716(99)00011-8, 1999.
Wooldridge, S. A., Kalma, J. D., and Walker, J. P.: Importance of soil moisture measurements for inferring parameters in hydro-logic models of low-yielding ephemeral catchments, Environ. Model. Softw., 18, 35–48, doi:10.1016/S1364-8152(02)00038-5, 2003.