Rising CO
2
Interacts with Growth Light and Growth Rate
to Alter Photosystem II Photoinactivation of the Coastal
Diatom
Thalassiosira pseudonana
Gang Li1,2, Douglas A. Campbell1*
1Biology Department, Mount Allison University, Sackville, New Brunswick, Canada,2Key Laboratory of Marine Bio-resources Sustainable Utilization, South China Sea Institute of Oceanology, CAS, Guangzhou, Guangdong, China
Abstract
We studied the interactive effects of pCO2and growth light on the coastal marine diatom Thalassiosira pseudonana CCMP
1335 growing under ambient and expected end-of-the-century pCO2(750 ppmv), and a range of growth light from 30 to
380mmol photons?m22?s21. Elevated pCO2 significantly stimulated the growth of T. pseudonana under sub-saturating
growth light, but not under saturating to super-saturating growth light. Under ambient pCO2 susceptibility to
photoinactivation of photosystem II (si) increased with increasing growth rate, but cells growing under elevated pCO2
showed no dependence between growth rate andsi, so under high growth light cells under elevated pCO2were less
susceptible to photoinactivation of photosystem II, and thus incurred a lower running cost to maintain photosystem II function. Growth light altered the contents of RbcL (RUBISCO) and PsaC (PSI) protein subunits, and the ratios among the subunits, but there were only limited effects on these and other protein pools between cells grown under ambient and elevated pCO2.
Citation:Li G, Campbell DA (2013) Rising CO2Interacts with Growth Light and Growth Rate to Alter Photosystem II Photoinactivation of the Coastal Diatom
Thalassiosira pseudonana. PLoS ONE 8(1): e55562. doi:10.1371/journal.pone.0055562
Editor:Rajagopal Subramanyam, University of Hyderabad, India
ReceivedOctober 15, 2012;AcceptedDecember 27, 2012;PublishedJanuary 31, 2013
Copyright:ß2013 Li, Campbell. This is an open-access article distributed under the terms of the Creative Commons Attribution License, which permits unrestricted use, distribution, and reproduction in any medium, provided the original author and source are credited.
Funding:This work was funded by the Natural Sciences and Engineering Research Council of Canada (http://www.nserc-crsng.gc.ca/index_eng.asp), the Canada Research Chairs program (http://www.chairs-chaires.gc.ca/home-accueil-eng.aspx) (DAC) and the National Natural Science Foundation of China (No. 41206132)(http://www.nsfc.gov.cn/e_nsfc/desktop/zn/0101.htm) (GL). The funders had no role in study design, data collection and analysis, decision to publish, or preparation of the manuscript.
Competing Interests:The authors have read the journal’s policy and have the following conflicts: D.A. Campbell is a minority shareholder in the company Environmental Proteomics NB, which provided the quantitation standards used to quantify key proteins in this study. This does not alter the authors9adherence to all the PLOS ONE policies on sharing data and materials.
* E-mail: [email protected]
Introduction
Atmospheric carbon dioxide (CO2) is expected to rise from current levels of,390 parts per million (ppm) to 700–1000 ppm by the end of this century, beyond the levels of the past 800 kyr of glacial-interglacial periods [1]. The dissolution of additional atmospheric CO2into seawater alters the inorganic carbon buffer system by increasing the pCO2 and decreasing the pH [1,2], potentially perturbing the physiological processes of marine phytoplankton including growth, photosynthesis and calcification [3,4]. The elevated CO2down-regulates the carbon concentrating mechanisms (CCMs) of phytoplankton, in particular in diatoms [5,6]. Savings from this down-regulation are likely to allow compensatory increases in other processes such as phytoplankton growth [7–9], productivity [10] or synthesis of N-containing enzymes or cofactors [11]. These metabolic re-allocations could drive alterations in competitive interactions and niche boundaries among phytoplankton [12] and ultimately changes in community species compositions [13–16]. Rising CO2caused decreases in the growth and productivity of monoculture or natural cell-assemblies under high solar irradiance, by increasing light stress and photorespiration [7,16,17]. Elevated pCO2 also decreased pro-ductivity of the diatom Thalassiosira pseudonana by increasing dark respiration [18]. In contrast, elevated CO2had insignificant
effects on the photophysiology of the marine diatom Chaetoceros brevis from the Antarctic Ocean [19], or on natural phytoplankton communities from the Derwent River estuary [20] or the Equatorial Pacific Ocean [21]. Such divergent responses to elevated CO2 complicate the implications of rising CO2 for marine phytoplankton.
In parallel with rising CO2, ocean temperature is increasing, which may increase stratification and decrease the upper-mixed-layer depth, thus exposing phytoplankton cells to higher mean light intensities [17]. Available light is a key factor for phytoplankton. Low light increases accessory pigmentation, which elevates the likelihood of photon capture [22]; it leads also to an increase in total proteins [23]. Concomitantly light drives photoinactivation of phytoplankton Photosystem II reaction centers through damaging key protein subunits, particularly PsbA, when can lead to photoinhibition or cell death if photoinactivation outruns counter-acting repair processes [24,25].
succeed under variable light through their high plasticity in photoacclimation capacity and quantum-to-biomass conversion rate [28] as well as their photoprotection mechanisms [29,30]. Diatoms as a group [31,32] have lower susceptibility to photoinactivation of PSII than do other phytoplankton [33–35]. This lowers the diatom cost-of-growth, particularly under fluctu-ating light, since they do not need to allocate as much protein metabolic capacity [25,36] to counter PSII photoinactivation. Irradiance and elevated CO2 have interactive influences on diatom physiology which may contribute to controlling future community structures [15–19,37].
In this paper we determined the interactive effects of elevated pCO2 and growth light on the photophysiology of the model diatom Thalassiosira pseudonana CCMP 1335 [38,39], which is derived from a coastal environment, where light [40] and pCO2 [41] already vary widely.
Materials and Methods
Culture protocol
The coastal centric diatom, Thalassiosira pseudonana (Hustedt) Halse et Heimdal obtained from the Provasoli-Guillard National Center of Marine Phytoplankton (CCMP 1335) was cultured in 2 cm thick cuvettes (450 ml volume) of FMT-150 photobioreac-tors (Photon Systems Instruments, Drasov, Czech Republic) at 18uC in enriched artificial seawater (EASW) prepared according to [42], except with 54.5mM Si and 0.82mM Sr to limit precipitation
during autoclaving. Cultures were gently mixed by a curtain of bubbles emitted from four apertures across the cuvette bottom with air at either ambient (,390 ppmv) or elevated (,750 ppmv) pCO2. Outdoor air was used for the ambient CO2 treatment whereas the elevated CO2 treatment was achieved by mixing 99.99% CO2 with zero-CO2air using mass flow controllers (16 series, Qubit Systems, Kingston, Canada). Before bubbling into the bioreactor culture cuvette, the air streams were filtered through a 0.2mm micro-filter and bubbled through sterile distilled
water for humidification. The growth of T. pseudonana was not notably disrupted by this bubbling [43] although we earlier noted disruption of growth and cell breakage of larger diatoms using similar bubbling streams in these bioreactors (A. McCarthy & D. Campbell, unpub.).
Continuous growth light was measured with a microspherical quantum sensor (US-SQS, Waltz, Germany). The light intensities in culture vessels filled with seawater were set to 30, 80, 160, 240 or 380mmol photons?m22?s21, provided by a panel of blue LED
that cover the entire rear face of the cuvette. These light levels approximate a range from near the bottom of the euphotic zone at 1.5% of surface sunlight, up to the upper 35% of the euphotic zone in marine ecosystems.
Carbon system analyses
During the growth period, we continuously monitored the pH in culture replicates in each of the three photobioreactors using an InPro 3256glass electrode (Mettler-Toledo) that was calibrated before setting up the culture systems with NBS buffers of pH 7.0 and 10.0 (Sigma-Aldrich). At the end of growth of each culture replicate, we measured dissolved inorganic carbon (DIC) with a CO2analyzer (S151, Qubit systems, Kingston, Canada) [44]. We calculated total alkalinity, bicarbonate (HCO32), carbonate (CO322) and pCO2 on the base of the measured temperature (18uC), salinity (35 g L21), pH, DIC and the phosphate (21mmol L21) or silica (52.5mmol L21) contents of the prepared EASW
using the CO2SYS program [45], with NIST scale constants from [46] and K1, K2 from [47] to calculate total alkalinity.
Growth rate
We obtained a preliminary growth curve by operating the bioreactors in batch mode to determine a cell density set-point for turbidostat mode that maintained a stable pH, indicating stable DIC status, and a detectable FO fluorescence signal from the diatoms, monitored continuously using the onboard sensor in the bioreactors. For each of the ten different combinations of light and pCO2, we then grew 3 or 4 replicate cultures by re-inoculating cells after cleaning and autoclaving the photobioreactor cuvettes. We grew each experimental replicate culture from initial inoculation for 3–4 generations without dilution until the culture density reached the set-point (Fig. 1A) of basal fluorescence value (FO= 280; 62630 ng Chl a mL21in this study). We then entered turbidostat mode to maintain this cell density by activating a peristaltic pump when the FOvalue reached the set-point (Fig. 1A) to dilute the 450 ml culture with a 10% volumetric addition of media delivered from a reservoir, which was continuously pre-bubbled with the air stream to pre-equilibrate the dissolved inorganic carbon system of the media before addition to the culture volume. 3.5 L of media in the reservoir supported about 9.5 cell generations of growth for each replicate culture under the set conditions of light and pCO2, before we harvested for the light-shift experiments and biochemical analyses described below. The temporal duration of each turbidostat run varied between 160 to 200 h, depending upon the achieved growth rate of the culture, which in turn varied with the applied growth light and pCO2. We calculated the specific growth rate for a given culture replicate (Fig. 1A; Fig. 2A) by using the onboard detector to monitor OD680, and then fitting the increase with time with an exponential growth function for the interval between each turbidostat 10% dilution cycle. We then averaged the exponential rates from the final 10 cycles of dilution to estimate the growth rate for the culture replicate. There were small variations in the light sources among the three bioreactor units we used, so we plotted specific growth rates and other parameters versus the actual light level applied to a given culture replicate, resulting in small offsets in data points along the X axes of plots (ex. Fig. 2A). Across the 10 combinations of growth light and pCO2 we grew a total of 33 separate turbidostat runs between December 2011 and August 2012, although experiment failures and volume limitations meant that not every analytical measurement was performed for every turbidostat run. At the end of the turbidostat growth period we measured the cell volume and cell suspension density with a Multisizer 3 Counter (Beckman Coulter Inc., USA).
Frustule thickess
Samples were harvested for scanning electron microscopy (SEM) by collecting cells from approximately 15 mL of culture using a Millipore vacuum filtration apparatus containing a 25 mm diameter, 1mm pore size polytetrafluoroethylene membrane
sputtering unit (Anatech USA, Union City, CA) and examined using a JEOL JSM-5600 SEM (JEOL USA, Peabody, MA) operating at 10 kV and 8 mm working distance. Six images of fractured valves oriented so that the fracture was facing upslope and parallel to the wall of the groove were collected for each treatment. Valve thickness was measured on magnification calibrated digital image files using the program dmfMeasure [49]. Thicknesses were blind measured by stripping identifying information from the images, renaming the files with a randomly generated file name, and mixing them with images from at least three other treatments. Measurements were made in the center-most part of the fracture in a region where the break appeared to be as perpendicular through the cell wall as possible. Measured thicknesses were corrected for tilt and coating thickness. Once measurements for all treatments were complete, 30 images were randomly selected and measured again. Test-retest variability was less than 2.3% in all cases.
Photoinactivation (si) determination
At the end of the turbidostat growth period we took a 280 mL culture sample from each replicate for determination of the functional absorption cross-section for photons driving PSII photoinactivation (si, A
2
quanta21) [31,34,50]. We divided the culture sample into two flasks, and supplemented one with a final concentration of 500mg mL21 lincomycin (Sigma-Aldrich) to
Figure 1. Measuring growth rate and Photosystem II Photoin-activation.A) Turbidostat culture cell density was maintained at set-point by automatic dilutions activated by a sensor tracking optical density at 680 nm. The last 10 cycles of dilution before starting the light-shift experiment were used to calculate the growth rate (m, d21) by fitting the increase in OD680versus time with an exponential curve for each dilution cycle. This example growth curve was taken from a culture growing at 240mmol photons?m22?s21, under bubbling with elevated
pCO2of 750 ppmv. B) PSII photochemical yield during and after an upward light shift. Cells were shifted from the culture growth light (240mmol photons?m22?s21 in this example; 30, 80, 160, 240 or
380mmol photons?m22?s21in other experiments) upward to 450mmol
photons?m22?s21 and then back to the culture growth light again. Susceptibility to photoinactivation (si, A2) was obtained by fitting an exponential decay curve to the decrease in FV/FM versus cumulative photons, in the sub-culture in which PSII repair was blocked by lincomycin.
doi:10.1371/journal.pone.0055562.g001
inhibit chloroplast ribosome function [8,31,51] to block PSII repair. We placed both the flasks in the dark for 10 min to allow the antibiotic (if present) to penetrate into cells and inhibit ribosome function. We then shifted the flasks to 450mmol photons
m22s21blue light (LEE#183, Panavision; peak transmission at 455–479 nm and 50% transmission at 406–529 nm, approximat-ing the growth light quality in the bioreactors). In this way, we aimed to assess the responses of cells acclimated to a range of light levels, to a shift to higher light simulating an upward mixing event to the upper region of the euphotic zone. After 15, 30, 60 and 90 min exposure to 450mmol photons m22s21, we took samples
from both flasks for chlorophyll fluorescence measurements (Fig. 1B). After 90 min we returned the cultures to their culture growth light level and tracked any recovery over 30 and 60 min. We estimated the susceptibility of PSII to photoinactivation (si, A2 quanta21) by fitting the exponential decrease of PSII photochem-ical yield (FV/FM) of the lincomycin-treated sample versus cumulative incident photons per area (Fig. 1B). To obtain FV/ FM, a 2 mL sample from each culture replicate at each time point was dark adapted for 5 min in a temperature-controlled cuvette holder (18uC). A blue-green modulated measuring light (4 Hz; Xenon-PAM, Waltz, Effeltrich, Germany) was applied to measure FO, followed by a saturating light pulse (4,000mmol photons m22s21, 600 ms) to measure the dark-adapted maximal fluores-cence (FM). FV/FMwas calculated as:
FV=FM~(FM{F0)=FM
During the growth light recovery period we continued to monitor FV/FM and if there was any increase in FV/FM in the lincomycin treated cells we attributed the increase to slow relaxation of non-photochemical quenching, and used the amplitude of any relaxation to correct for the influence of non-photochemical quenching on changes in the measured FV/FM. Such corrections were small to negligible and had no substantive effect on the results.
sPSIImeasurement
We measured the functional absorption cross-section for PSII photochemistry (sPSII, A2 quanta21) for blue light using a Fluorescence Induction and Relaxation fluorometer (FIRe, Satlantic, Halifax, Nova Scotia, Canada). Ahead of the light-shift experiment, we dark-acclimated a 2 mL sample from each culture replicate for 5 min. We then triggered an 80ms single turnover flash (blue LED 45562 nm) to saturate PSII photochemistry and drive fluorescence to a maximum. After this we exposed the sample to the relevant culture growth light (30, 80, 160, 240 or 380mmol m22s21) for 2 min. We then again triggered the single
turnover saturating flash to obtain the absorption cross-section for PSII centers remaining open under the culture light level (s9PSII). We then applied a high actinic light of 450mmol m22s21to the
samples for 2 min, followed by triggering the single turnover saturating flash again fors0PSII measurements of the absorption cross section for the remaining PSII centers still open under the high light treatment. The values ofsPSIIwere extracted from the fluorescence rise curves using the FIReWORX software [52] with the flash irradiance calibration factors provided by Satlantic (Halifax, Canada).
Photochemical quenching to track the fraction of PSII centers open and ready for photochemistry under the growth light level for a given culture, was calculated following van Kooten and Snel (1990) [53] as:
qP~(FM’{FS)=(FM’{F0’)
Protein, Chl a and malondialdehyde measurements
Just prior to the high light shift experiments (T0 samples) or after the 90 min of high light treatment, both with or without lincomycin (T90 samples) we vacuum-filtered 50 or 30 mL of culture onto a binder-free Whatman GF/F glass fiber filter (25 mm in diameter), which was immediately flash frozen in liquid nitrogen and stored at280uC until later analyses of protein and chlorophyll (50 mL filter) or malondialdehyde (30 mL filter).
Total protein was extracted from the frozen filters using the MPBio FastPrepH-24 with bead lysing matrix D (SKU 116913050) and 400mL of 16denaturing extraction buffer (0.1375 mol?L21
TRIS buffer, 0.075 mol?L21 LDS, 1.075 mol?L21 glycerol, 0.5 mmol?L21 EDTA, 0.1 mg?mL21 Pefabloc) [54] for three cycles of 60 seconds at 6.5 m?s21. Total protein concentration in the extracts was then determined using the Bio-Rad DC protein assay kit (500-0116) with known BGG standards. Molar levels of RbcL, PsbA, PsbD, PetC and PsaC in 1mg total protein were then
determined with quantitative immunoblotting [34,51,54]. For chlorophyll a (Chl a) measurement, 30mL of protein extract
was added to 470mL 90% acetone (v/v) saturated with
magnesium carbonate; after 15 min extraction in the dark at 4uC and 2 min centrifugation (13,000 g), we measured the absorbance of the supernatant at 664, 630 and 750 nm using a UV/VIS photospectrometer (UV-1800, Shimadzu, Japan). Chl a content was estimated following Jeffrey and Humphrey (1975) [55]:
½Chla~11:47|(A664{A750){0:4|(A630{A750)
Malondialdehyde (MDA) content, an index of cumulative ROS toxicity, was determined with the thiobarbituric acid-reactive substance method [56,57]. Cells on the filter were homogenized with 0.8 mL of 20% (w/v) trichloroacetic acid (TCA), followed by centrifugation at 13,000 g (10 min). After this, 0.35 mL of the supernatant and 0.35 mL of thiobarbituric acid reagent (0.5% in 20% TCA) was mixed, heated at 90uC for 30 min and cooled on ice. The absorbance of the mixture was measured at 532 and 600 nm with the extraction solvent as blank. Based on the A532– A600, MDA content was calculated by multiplying by the extinction coefficient of 6.45mM cm21.
Carbon and nitrogen analyses
Prior to the light-shift experiment, we filtered 20 mL of turbidostat culture onto a pre-combusted (5 h, 450uC) Whatman GF/F glass fiber filter (13 mm in diameter), rinsed with 10 mL of 50 mmol L21HCl to remove inorganic carbon, dried at 55uC for 12 h and stored in a desiccator for later analyses. Contents of carbon and nitrogen were measured with a Vario EL III Elemental Analyzer (Elementar, Hanau, Germany).
Data analysis
The response of growth rate and MDA content to culture growth light was fitted with the equation of Platt et al. (1980) [58]:
where:mis growth rate (d21) or MDA content (attomoles?cell21) at the particular light level;mmaxis the maximum growth rate (d21) or MDA content (attomoles?cell21) derived from the curve fit; e is the base of natural logarithm; a is the initial quantum yield of growth or MDA content; I is the growth light (mmol
photons?m22?s21) andbis an inhibition parameter.
We used ANOVA with Bonferroni post-tests (Prism 5, Graphpad Software) and comparisons of linear and non-linear curve fits to detect significant differences among the CO2 and culture-light treatments.
Results
Carbonate chemistry system
Carbonate chemistry parameters in our turbidostat cultures were representative of current ambient (,390 ppmv) and the end of this century (,750 ppmv), except that the estimated pCO2level for cultures under the lowest growth light and elevated pCO2 treatment was significantly lower than in the cultures under higher growth lights (Table 1). As expected, the elevated pCO2treatment increased DIC by 7.8%, HCO32by 13.6% and free CO2in the medium by 117%, while pH decreased by 0.33 units and [CO322] decreased by 39.5%. The total alkalinity in the media remained unchanged between the ambient and elevated pCO2treatments. The steady total alkalinity also shows that the differing rates of assimilation of ionic nitrogen and sulphur sources across the cultures growing at different rates did not significantly alter the media composition, which was instead dominated by the cycles of dilution with fresh media.
Growth, cell volume, Chl a and cellular protein
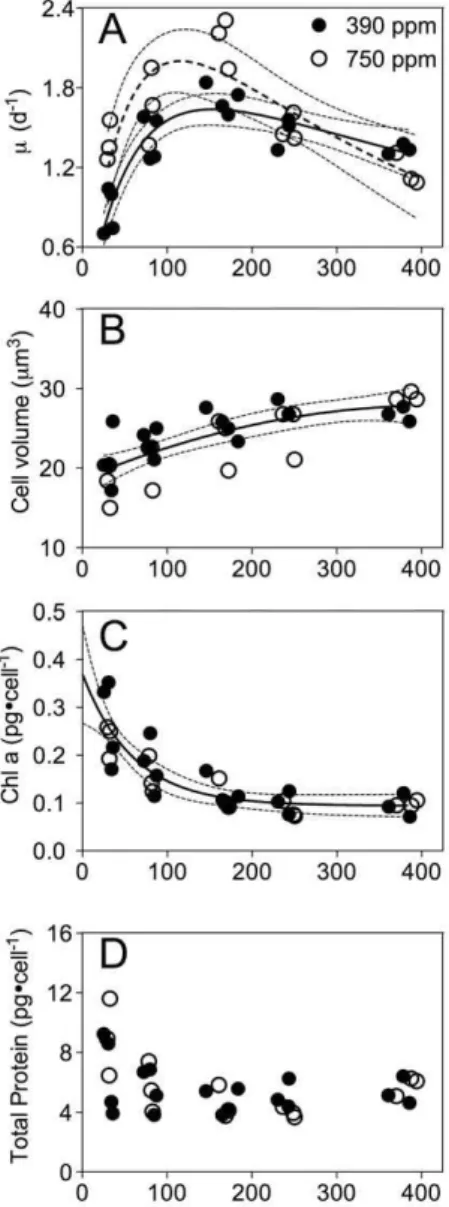
Cell growth rate increased with culture growth light from low (30mmol photons?m22?s21) to moderate levels (160mmol photons?m22?s21), but then decreased under higher light (240, 380mmol photons?m22?s21) (Fig. 2A). Under bubbling with ambient pCO2Thalassiosira psuedonana CCMP 1335 achieved a mmax of 2.15 d21. Bubbling with elevated pCO2 significantly stimulated the growth rate across low to moderate light level, allowing cells to achieve a mmax of 3.04 d21. Note that these estimates for mmax are from the curve fits, which include an inhibition term. The measured maximum achieved growth rates for the cultures were 1.8 d21for ambient pCO2and 2.3 d21for elevated pCO2. Above the saturating light level elevated pCO2did not stimulate growth rate (Fig. 2A). There was an increase in cell volume from 19 to 28mm3as the growth light increased, but there was significant scatter among replicates and no significant effect of pCO2on cell volume (Fig. 2B). Frustule thickness varied from 52 to 80 nm and showed significant scatter among replicates but no significant trend with growth light nor with pCO2 (data not presented).
Chl a content decreased from about 0.22 to 0.08 pg?cell21as the growth light increased from low to moderate levels, with no significant effect of elevated CO2 (Fig. 2C). There were no significant effects of growth light nor pCO2on total protein per cell, although cultures growing under low light showed more scatter among replicates (Fig. 2D). The mass ratio of Chl a: protein decreased from 0.036 to 0.016 with the increasing growth light at ambient pCO2(Fig. 2E) and from 0.025 to 0.015 under elevated pCO2, so cultures growing under elevated pCO2showed a lower Chl a: protein, but only under low growth light (p,0.05). Note that the mass ratios for Chl a: protein were calculated for the same extract from each culture, and thus the patterns of the ratio versus light and pCO2can achieve statistical significance even though the Table
unpaired chlorophyll and protein plots do not, possibly because of experimental variation in extraction efficiencies.
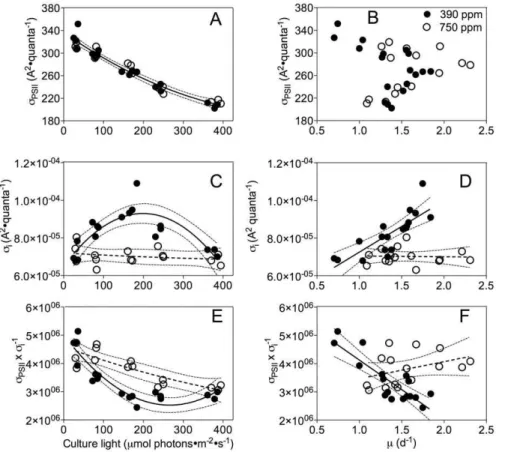
Photophysiological parameters
The cultures showed differential growth-light and growth-rate dependent changes in photophysiology under ambient and elevated pCO2 (Fig. 3). The functional absorption cross-section that serves PSII photochemistry (sPSII) decreased markedly from about 322 to 210 A2?quanta21with increasing growth light, with no significant effect of pCO2(Fig. 3A). There was no pattern of sPSII with respect to culture growth rate (Fig. 3B), and sosPSII shows a clear pattern of acclimation to increasing culture growth light.
In marked contrast the functional absorption cross-section for incident photons driving PSII photoinactivation (si) increased from approximately 7.361025to 9.361025A2?quanta21, as the growth light increased from 30 to 160mmol photons?m22?s21for
cultures bubbled with ambient CO2, and then decreased back to 761025 A2?quanta21 as growth light increased further to 380mmol photons?m22?s21 (Fig. 3C). Under elevated CO2 this
curvilinear response to growth light disappeared andsiremained
steady at ,761025 A2?quanta21 (Fig. 3C). The unexpected curvilinear light response ofsiis resolved by a plot of siversus growth rate (Fig. 3D) which shows a positive, linear correlation for cultures growing under ambient pCO2 (R2= 0.64, p,0.0001). Cultures grown under elevated pCO2 lose this correlation of susceptibility to photoinactivation with growth rate, and thus show a significantly lower si under conditions of high growth rate (p,0.01) (Fig. 3D). Thus, under elevated pCO2rapidly growing cells show a decrease in susceptibility to photoinactivation of PSII, compared to cells under ambient pCO2. In contrast, under slow growth elevated pCO2can even provoke increased susceptibility to photoinactivation [8].
The ratio of sPSII/si, a baseline estimate of photochemical return on investment per cycle of PSII repair, demonstrated both growth light and growth rate-dependent effects at both CO2levels. sPSII/si in cultures bubbled with ambient pCO2 curvedly decreased from 4.561026to 2.861026as growth light increased from low to moderate levels. Cultures bubbled with elevated pCO2 showed a linear decrease insPSII/siwith growth light (Fig. 3E). At the moderate, growth-saturating light of 160mmol
photons?m22?s21, thesPSII/siin cultures bubbled with ambient pCO2is about 70% of the value for cultures bubbled with elevated
Figure 3. Photophysiology of cells grown under ambient and elevated CO2 versus growth light or growth rate.A) Functional absorption cross-section for Photosystem II photochemistry (sPSII, A2?quanta21) versus growth light. Solid line: Polynomial curve for pooled growth light response of sPSIIunder both ambient and elevated pCO2. Thin dotted lines: 95% confidence intervals on the fitted curve. B) Functional absorption cross-section for Photosystem II (sPSII) versus growth rate. C) Functional cross section for photoinactivation of Photosystem II (si, A2?quanta21) versus growth light. Solid line: Polynomial curve for growth light response ofs
iunder ambient pCO2. Dashed line: Polynomial curve for growth light response ofsiunder elevated pCO2. Thin dotted lines: 95% confidence intervals on the fitted curves. D) Functional cross section for photoinactivation of Photosystem II (si) versus growth rate. Solid line: Linear regression for growth response ofsiunder ambient pCO2. Dashed line: Linear regression for growth response ofsiunder elevated pCO2. Thin dotted lines: 95% confidence intervals on the fitted curves. E) Ratio ofsPSII:si versus growth light. Solid line: Polynomial curve for light response ofsPSII:siunder ambient pCO2. Dash line: Polynomial curve for growth light response ofsPSII:siunder elevated pCO2. Thin dotted lines: 95% confidence intervals on the fitted curves. F) Ratio ofsPSII:siversus growth-rate. Solid line: Linear regression for growth response ofsPSII:siunder ambient pCO2. Dash line: Linear regression for growth response ofsPSII:siunder elevated pCO2. Thin dotted lines: 95% confidence intervals on the fitted curves.
pCO2, indicating fewer rounds of photochemical charge separa-tion per round of PSII repair under ambient CO2, where cells suffer more frequent photoinactivations of PSII under moderate light. At the fastest growth rates (Fig. 3F) cells under elevated pCO2, enjoy more potential photochemical return per round of PSII repair.
The functional absorption cross-section for PSII photochemistry measured under growth light (s9PSII) (Fig. 4A) shows a similar trend to sPSII measured from dark-acclimated cells (Fig. 3A), decreasing from about 311 to 156 A2?quanta21with the increasing growth light, with no significant effect of pCO2except under the highest growth light of 380mmol photons?m22?s21 (Fig. 4A).
Photochemical quenching (qP) that tracks the fraction of PSII centers open and ready for photochemistry, decreased from 0.89 to 0.63 as the growth light increased from low to moderate levels, then remained steady under higher growth light levels, with no significant CO2effects (Fig. 4B). When we plotted the growth light s9PSIIversussPSII, all the points fell close to the 1:1 dotted line (Fig. 4C), indicating limited net down-regulation of the antenna size serving PSII under culture growth light, compared to the antenna size from dark-acclimated cells. However, when we plotted the functional absorption cross-section (s0PSII) measured under the high shift light (450mmol photons?m22?s21) to the
sPSII, all the points fell far below the 1:1 line, especially in the cultures from low growth light (Fig. 4D), showing a significant down-regulation of the functional antenna size under the excess light conditions as non-photochemical quenching is induced [59].
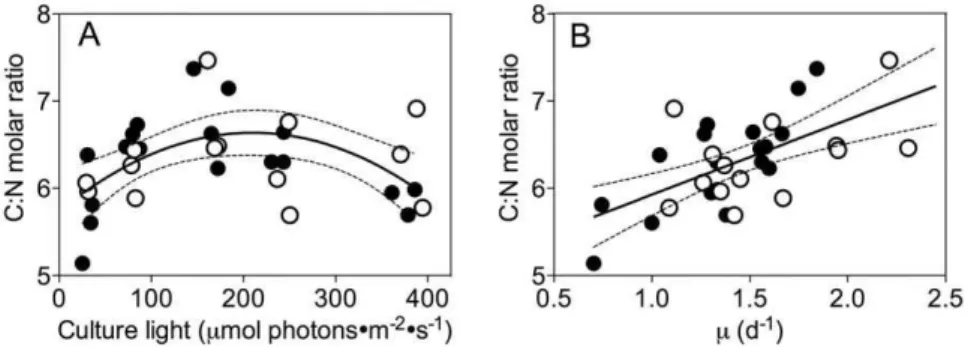
Carbon and nitrogen
Mean contents of carbon or nitrogen were 0.65 and 0.11 pmol?cell21, with no significant patterns in response to growth light nor pCO2(data not presented). Under ambient pCO2 the molar ratio of C:N varied from 5.1 to 7.4 and showed a curved response as the growth light increased from low to moderate levels, followed by a decrease under higher growth light levels (Fig. 5A); moreover, C:N shows a linear increase with increasing growth rate (R2= 0.37, p,0.05) (Fig. 5B) across both ambient and elevated pCO2cultures.
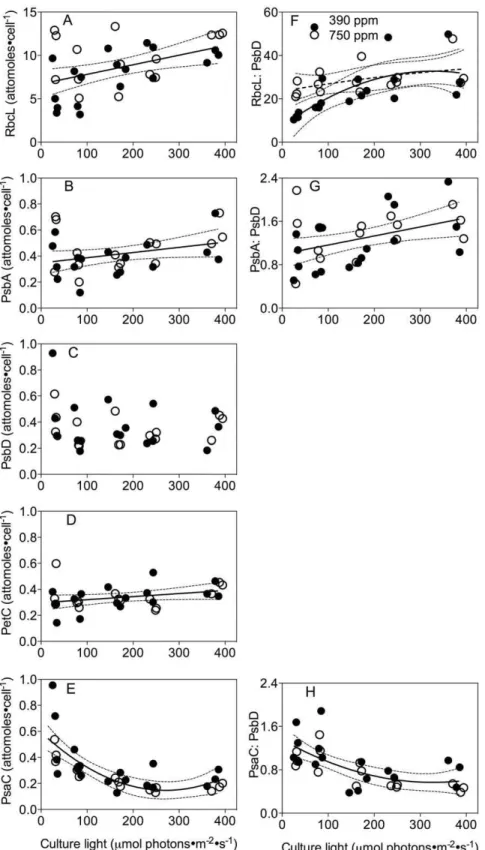
RbcL, PsbA, PsbD, PetC and PsaC
Content of RbcL, the RUBISCO large subunit, varied from 3.2 to 11 attomoles?cell21and showed a modest positive correlation
Figure 4. Effects of growth light and pCO2 on functional absorption cross-section for PSII photochemistry.A) Functional absorption cross-section for Photosystem II measured under culture light level (s9PSII, A2?quanta21) under ambient or elevated pCO2plotted against the culture growth light (mmol photons?m22?s21). Solid line:
Polynomial curve for growth light response ofs9PSII under ambient pCO2. Dashed line: Polynomial curve for light response ofs9PSIIunder elevated pCO2. Thin dotted lines: 95% confidence intervals on the fitted curves. B) Photochemical quenching (qP) versus growth light under ambient or elevated pCO2. Solid line: Polynomial curve for pooled growth light response for cultures from the two CO2treatments. Thin dotted lines: 95% confidence intervals on the fitted curve. C) Functional absorption cross-section (s9PSII) of the samples measured after 2 min of acclimation to culture-light, as a function ofsPSIImeasured after 5 min dark-acclimation. Solid line: Linear regression of pooled response of cultures from ambient and elevated pCO2. Thin dotted lines: 95% confidence intervals on the fitted curve. Dotted diagonal line indicates 1:1 ratio. D) Functional absorption cross-section (s0PSII) of the samples measured after 2 min of acclimation to high-light of 450mmol
photons?m22
?s21, as a function of s
with increasing growth light (R2= 0.21, p,0.05) (Fig. 6A). There were no significant effects of growth light nor pCO2 on the contents of PsbA (PSII subunit) (Fig. 6B), PsbD (PSII subunit) (Fig. 6C) nor PetC (Cytochrome b6f complex subunit) (Fig. 6D). However, PsaC (PSI subunit) declined significantly as growth light increased from low to moderate levels (Fig. 6E). Increasing growth light provoked significant increases in the ratios of RbcL:PsbD and PsbA:PsbD (Fig. 6F,G), but a decrease in the PsaC:PsbD ratio (Fig. 6H). Overall we did not detect significant effects of pCO2 effects on protein subunit contents (Fig. 6), except under the growth light of 30mmol photons?m22?s21where the RbcL:PsbD
ratio was marginally higher in cultures bubbled with elevated pCO2(p,0.05) (Fig. 6F).
Malondialdehyde content
In cultures under ambient pCO2 malondialdehyde (MDA), a product of lipid peroxidation, curvedly increased from 10 to 23 attomoles?cell21as growth light increased from low to moderate levels, followed by a decrease to 14 attomoles?cell21 under the highest growth light (Fig. 7A). Elevated pCO2 significantly increased the MDA content under low growth light (30mmol
photons?m22?s21), but not under higher growth light (Fig. 7A). The content of MDA was also increased after 90 min exposure of low-light-cultured cells (30 or 80mmol photons?m22?s21) to
450mmol photons?m22?s21 under both CO2 treatments
(Fig. 7B). Furthermore, there was a positive correlation (R2= 0.75, p,0.001) between the MDA content and growth rate under ambient pCO2, but not under elevated pCO2 (Fig. 7C), mirroring the correlation of siwith growth rate under ambient pCO2(Fig. 3D,7D).
Discussion
Elevated pCO2stimulates diatom growth under low to
moderate light
A seawater inorganic carbon system that approximates condi-tions expected for the end of this century promoted the growth rate of a marine coastal diatom under sub-saturating growth light, but not under saturating to super-saturating growth light. The significant fertilization of elevated pCO2on growth of the diatom under lower light (Fig. 2A) may be accounted for by an increased diffusive supply of free CO2and bicarbonate concentrations, that could allow the diatom to down-regulate carbon concentrating mechanisms (CCM) [5,6] and thereby save about 20% of the energy demanded by CCM under current ambient pCO2 [5,60,61]. The savings from this down-regulation can be
re-allocated to support the increased growth rate (Fig. 2A). We see a hint of these resource re-allocations in the lower Chl: Protein ratio under low light and elevated pCO2(Fig. 2E), but surprisingly not in our determinations of C:N molar ratio (Fig. 5A) nor in representative subunits of major photosynthetic complexes (Fig. 6). Under higher growth lights savings from CCM down-regulation may become less significant relative to the costs of coping with excess light [7,16,18]. Furthermore with rapid growth under high light the increased demand for carbon assimilation may outweigh the influence of increased pCO2.
In our cultures the moderate light of 240mmol
photons?m22?s21(Fig. 2A) was sufficient to provoke the onset of inhibition of growth, particularly under elevated pCO2. Cullen and Lewis (1988) [62], in contrast, achieved yet higher growth rates with T. pseudonana under light up to 2200mmol
photons?m22?s21. We suspect the difference arose because we grew the cultures under continuous illumination from narrow-band blue light LED sources, for consistency between our growth light spectra and our determinations ofsPSIIandsifor blue light. Blue light has a higher quantum yield for photoinactivation of PSII of diatoms [51] and plants [63] than do longer wavelengths, so our illumination provoked a higher rate of photoinactivation at a given light level than did the white light source of Cullen and Lewis (1988) [62].
Elevated pCO2alters the photophysiological properties
of diatoms
When growing under current ambient pCO2the coastal diatom showed a curvilinear relation between the susceptibility of their PSII to photoinactivation (si) and growth light (Fig. 3C). This surprising pattern resolved to a linear correlation betweensiand growth rate (Fig. 3D). For determination of siwe elevated the treatment light to accelerate the rate of photoinactivation, to improve the accuracy of curve fits over reasonably short treatment times. As reviewed in Campbell &Tyystja¨rvi [50]siis applicable across the range of growth lights, although at lower light the rate of photoinactivation (si6incident photons m22s21) will be slower. The turbidostat cultures maintained a stable growth rate, with stable Photosystem II function, tracked with FV/FM, and stable PSII protein content (Fig. 6B,C). In this steady state situation each photoinactivation event is countered by the PSII repair cycle. Therefore, the susceptibility to photoinactivation is a direct measure of the metabolic cost the diatoms incur to maintain PSII function under a given growth light. Under ambient pCO2the faster growing diatoms suffer a cost of increased susceptibility to photoinactivation and thus a proportionate increase in their
Figure 5. Molar ratio of C:N versus growth light and growth rate.A) Molar ratio of carbon to nitrogen (C:N) versus culture growth light. Solid line: Polynomial curve for pooled growth light response for cultures from ambient and elevated pCO2. Thin dotted lines: 95% confidence intervals on the fitted curves. B) Molar ratio of C:N versus growth rate (m, d21
). Solid line: Polynomial curve for pooled growth light response for cultures from ambient and elevated pCO2. Thin dotted lines: 95% confidence intervals on the fitted curves.
metabolic cost to maintain photosynthesis. Under elevated pCO2 these patterns ofsidisappear, so that at the very lowest growth rates diatoms under elevated pCO2show similar (Fig. 3D) or even increased susceptibility to photoinactivation compared to current ambient pCO2[8]. In contrast, under moderate to high growth rates the diatoms under elevated pCO2enjoyed significantly lower susceptibility to photoinactivation. At the optimal growth light of 160mmol photons?m22?s21diatoms under elevated pCO2show a ,30% lowersi, and thus incur a proportionately lower cost to maintain their PSII pool and photosynthetic capacity.
Note that these determinations of susceptibility to photoinacti-vation are for diatoms shifted to the moderately high light of 450mmol photons?m22?s21and that upon shifts to yet higher light
additional factors interact with photoinactivation of PSII, includ-ing the catalytic capacity for ROS detoxification [64] and dumping of photosynthetic electrons back to oxygen [65]. Furthermore, our current study is of coastal diatoms under exponential growth and nutrient repletion and in some phyto-plankton nutrient depletion strongly alters photophysiological responses [32,66].
We tested multiple hypotheses as to the underlying mecha-nism(s) for the effects of growth rate and of elevated pCO2upon photoinactivation. Based upon findings of Y. Wu & Z. Finkel (unpub. data) that elevated pCO2 lowers the silica content of diatoms, we measured the frustule thickness (data not presented) to determine if changes in frustule thickness might underlie the changes in susceptibility to photoinactivation, since the diatom frustule can screen harmful radiation [67]. We did not find any significant correlation of frustule thickness with growth light (data not presented), nor with growth rate, nor with pCO2, and so we did not find support for our initial hypothesis that pCO2 influenced cellular optics by altering frustule thickness. More subtle changes in frustule structure [68], density or pigment binding [67] could still potentially contribute to changes in diatom susceptibility to photoinactivation of PSII. We did capture whole cell spectra using an integrating cavity spectrophotometer but did not detect significant changes in cellular coloration under changing pCO2 (data not presented). The buffering influence of silicate upon pH changes under rising CO2might also influence PSII susceptibility to photoinactivation of diatom by altering CCM operation [69], but we have no data on this topic. More generally we find a suggestive correlation between the diatom frustule and the low susceptibility of diatoms, as a group, to photoinactivation [31], when compared to other phytoplankton measured under comparable conditions including coccolithophores [8,32,33], picocyanobacteria [34], prasinophytes [35],Bolidomonas[70] and other taxa (Campbell et al. unpub.). Even here, however, specificities of diatom photosystem subunit composition [71] and metabolism [65] provide alternate explanations for the unusually low susceptibility of diatoms to photoinactivation of PSII.
sPSII showed a simple negative correlation with growth light, was not significantly altered by elevated pCO2(Fig. 3A) and did not correlate with growth rate (Fig. 3B), thus showing straight forward light regulation of functional antenna size. Elevated pCO2 had no significant effects on the down regulation ofs0PSIIunder excess light (Fig. 4D). Therefore the effects of light and pCO2on si (Fig. 3C,D) appear to arise outside and separately from acclimatory changes in the functional size and short-term regulation of the antenna serving PSII. Across a taxonomic panel of diatoms of widely differing size [31] we found negative correlations of bothsPSIIand siwith increasing cell biovolume, which is consistent with pigment packaging or self-screening effects in the larger cells [31,72,73]. We did see some increase in cell biovolume with increasing light in these experiments (Fig. 2B), but
Figure 7. Malondialdehyde product of lipid peroxidation, growth rate and PSII photoinactivation.A) Malondialdehyde as a function of growth light. Solid line: Polynomial curve for malondial-dehyde of cultures from ambient pCO2. Thin dotted lines: 95% confidence intervals on the fitted curve. B) Ratio of malondialdehyde measured at time 90 (T90) of a high light treatment to time 0 (T0) of control levels, versus growth light. Dotted horizontal line shows 1:1 ratio of no change during the high light treatment period compared to the growth level. C) Malondialdehyde versus growth rate. Solid line: Linear regression of growth response of cultures from ambient pCO2. Thin dotted lines: 95% confidence intervals on the fitted curve. D) Functional cross section for photoinactivation of Photosystem II versus malondialdehyde. Solid line: Linear regression ofsiversus malondial-dehyde under ambient pCO2. Dashed line: Linear regression ofsiversus malondialdehyde under elevated pCO2. Thin dotted lines: 95% confidence intervals on the fitted curves.
there was no significant influence of pCO2on biovolume and thus the small changes in biovolume explained neither the effects of pCO2nor growth light onsi.
The change from ambient to elevated pCO2 did not signifi-cantly alter the pattern of PSII closure, measured as qP with increasing growth light (Fig. 4B), nor was there an effect of pCO2 upon qP measured under the higher treatment light (data not presented). Therefore we cannot attribute the pCO2 effect on susceptibility to photoinactivation to a simple change in excitation pressure on PSII [74].
We hypothesized that large re-allocations of nitrogen resources (Fig. 5) among the major complexes mediating photosynthesis might underlie the interactive effects of growth light and pCO2on si. RbcL (RUBISCO, Fig. 6A) and PsaC (PSI, Fig. 6E) contents changed with growth light, but we found only modest effects of elevated pCO2on the ratio between RbcL (RUBISCO) and PsbD (PSII subunit) and only in cells growing under low light (Fig. 6F). We did not detect any significant influence of pCO2on the cellular contents of PSII subunits, so a bulk change in PSII content is unlikely to explain the patterns ofsiwith growth light and pCO2. We did detect a moderate increase in the PsbA:PsbD ratio under increasing light, which may reflect increasing engagement of the PSII repair cycle and accumulation of intermediates in the overall PSII repair cycle [51,59,75], but which does not explain the patterns ofsithat we observe.
We analyzed the cellular content of MDA, an end product of lipid peroxidation produced when reactive oxygen stress damages biological membranes [56,57,76]. Increasing growth light and elevated pCO2both altered MDA content of the diatoms (Fig. 7A). A shift from growth light to excess light of 450mmol
photons?m22?s21 provoked some additional accumulation of MDA, but only in cells growing under low light; cells growing under higher light showed no additional MDA accumulation (Fig. 7B) pointing to pre-induction of detoxification systems [64] sufficient to counter any additional ROS production during the high light shift. MDA also correlated with growth rate (Fig. 7C), particularly in cells growing under ambient pCO2. Carbon limitation has been observed to induce increased expression of ROS-removing enzymes [77], which can explain the lower MDA in cells growing under ambient than elevated pCO2, particularly under lower growth light (Fig. 7A). Intriguingly in cells under ambient pCO2 increasing susceptibility to photoinactivation correlates with increasing cellular content of MDA (Fig. 7D), suggesting that in cells suffering significant photoinactivation, lipid peroxidation occurs in parallel, possibly driven by common or over-lapping mechanisms [78–80]. In contrast, under elevated pCO2 cellular content of MDA varies widely depending upon growth conditions butsidoes not, so growth under elevated pCO2 breaks the correlation between an index of ROS toxicity and cellular susceptibility to photoinactivation (Fig. 7D). In summary, our analyses to date have not yet uncovered a mechanism for the interactive effects pCO2, light and growth rate on si, but the effects are significant and represent biologically meaningful
changes in the cost of maintaining the photosynthetic apparatus in this coastal diatom.
To maintain PSII function, every photoinactivation event must be countered by an expensive PSII repair process [25,59,75]. Assuming the similar cellular contents of PSII protein subunits under ambient and elevated pCO2are proxies for similar overall pools of PSII, the lowersiunder elevated pCO2(Fig. 3D) implies a decreased metabolic burden to maintain a comparable PSII pool.
The ratiosPSII/siratio tracks the delivery of excitons to drive PSII photochemistry relative to photoinactivation events and sets an upper boundary on the return-on-investment for maintaining PSII under a given growth light condition. Elevated pCO2 markedly alters this relation (Fig. 3E,F) so fast-growing diatoms under elevated pCO2enjoy a significantly higher metabolic return from their investments into PSII.
The coastal strains of T. pseudonana that can dominate in the well mixed coastal or estuarine waters [27,81] are well adapted to the sharply fluctuating light therein. Simultaneously, pH in these waters also varies widely, for example from 7.0 to 8.4 in the Pearl River estuary of the South China Sea, causing a drastic change in pCO2 of 380 to 4800 ppmv [41]. Thus coastal phytoplankton including strains of T. pseudonana must be well adapted to changing CO2 levels. T. pseudonana is also a bloom forming species whose own blooms can occasionally considerably change the seawater CO2and light regimes.
Elevated pCO2and growth light interactively affect the growth rates, photophysiological parameters and key protein levels of the coastal diatom T. pseudonana CCMP 1335. The elevated CO2 provokes a decreased susceptibility to photoinactivation of PSII when the growth rates are high (Fig. 3D). In nutrient-rich coastal or estuarine waters, the growth rate of natural phytoplankton assemblages including diatoms can reach as high as 2.5 d21[82]. Moreover, the diatoms in these waters must exploit variable light environments due to sharp attenuation of the light gradient and fast vertical mixing rates [40]. Decreased susceptibility to photoinactivation due to rising CO2thus supplies T. pseudonana with a potential competitive advantage over other phytoplankton species in coastal or estuarine waters.
Acknowledgments
Miranda Corkum performed the elemental analyses and proof-read the manuscript, Dr. Hongyan Wu assisted with protein immunoquantitations and Jim Ehrman of the Mount Allison Digital Microscopy facility performed the determinations of frustule thickness. Environmental Proteomics NB, and AgriSera AB provided the antibodies and quantitation standards used to quantify key proteins in this study.
Author Contributions
Conceived and designed the experiments: GL DAC. Performed the experiments: GL. Analyzed the data: GL DAC. Contributed reagents/ materials/analysis tools: DAC. Wrote the paper: GL DAC.
References
1. Intergovernmental Panel on Climate Change (2007) Climate change 2007: mitigation of climate change: contribution of Working Group III to the Fourth assessment report of the Intergovernmental Panel on Climate Change. Cambridge: Cambridge University Press. 851 p.
2. Zeebe RE, Zachos JC, Caldeira K, Tyrrell T (2008) Carbon Emissions and Acidification. Science 321: 51–52. doi:10.1126/science.1159124.
3. Orr JC, Fabry VJ, Aumont O, Bopp L, Doney SC, et al. (2005) Anthropogenic ocean acidification over the twenty-first century and its impact on calcifying organisms. Nature 437: 681–686. doi:10.1038/nature04095.
4. Hofmann GE, Barry JP, Edmunds PJ, Gates RD, Hutchins DA, et al. (2010) The Effect of Ocean Acidification on Calcifying Organisms in Marine
Ecosystems: An Organism-to-Ecosystem Perspective. Annual Review of Ecology, Evolution, and Systematics 41: 127–147. doi:10.1146/annurev.ecolsys. 110308.120227.
5. Hopkinson BM, Dupont CL, Allen AE, Morel FMM (2011) Efficiency of the CO2-concentrating mechanism of diatoms. Proceedings of the National
Academy of Sciences 108: 3830–3837. doi:10.1073/pnas.1018062108. 6. Raven JA, Giordano M, Beardall J, Maberly SC (2012) Algal evolution in
relation to atmospheric CO2: carboxylases, carbon-concentrating mechanisms
7. Wu Y, Gao K, Riebesell U (2010) CO2-induced seawater acidification affects
physiological performance of the marine diatom Phaeodactylum tricornutum. Biogeosciences 7: 2915–2923. doi:10.5194/bg-7-2915-2010.
8. McCarthy A, Rogers SP, Duffy SJ, Campbell DA (2012) Elevated carbon dioxide differentially alters the photophysiology of Thalassiosira pseudonana
(Bacillariophyceae) andEmiliana huxleyi(Haptophyta). Journal of Phycology 48: 635–646. doi:10.1111/j.1529-8817.2012.01171.x.
9. Badger MR, Andrews TJ, Whitney SM, Ludwig M, Yellowlees DC, et al. (1998) The diversity and coevolution of Rubisco, plastids, pyrenoids, and chloroplast-based CO2-concentrating mechanisms in algae. Canadian Journal of Botany 76:
1052–1071. doi:10.1139/b98-074.
10. Schippers P, Lu¨rling M, Scheffer M (2004) Increase of atmospheric CO2
promotes phytoplankton productivity. Ecology Letters 7: 446–451. doi:10.1111/ j.1461-0248.2004.00597.x.
11. Crawfurd KJ, Raven JA, Wheeler GL, Baxter EJ, Joint I (2011) The Response of
Thalassiosira pseudonanato Long-Term Exposure to Increased CO2and Decreased
pH. PLoS ONE 6: e26695. doi:10.1371/journal.pone.0026695.
12. Low-De´carie E, Fussmann GF, Bell G (2011) The effect of elevated CO2on
growth and competition in experimental phytoplankton communities. Global Change Biology 17: 2525–2535. doi:10.1111/j.1365-2486.2011.02402.x. 13. Hare CE, Leblanc K, DiTullio GR, Kudela RM, Zhang Y, et al. (2007)
Consequences of increased temperature and CO2for phytoplankton community
structure in the Bering Sea. Marine Ecology Progress Series 352: 9–16. doi:10.3354/meps07182.
14. Yoshimura T, Nishioka J, Suzuki K, Hattori H, Kiyosawa H, et al. (2009) Impacts of elevated CO2on phytoplankton community composition and organic
carbon dynamics in nutrient-depleted Okhotsk Sea surface waters. Biogeos-ciences Discussions 6: 4143–4163. doi:10.5194/bgd-6-4143-2009.
15. Feng Y, Hare CE, Rose JM, Handy SM, DiTullio GR, et al. (2010) Interactive effects of iron, irradiance and CO2on Ross Sea phytoplankton. Deep Sea
Research Part I: Oceanographic Research Papers 57: 368–383. doi:10.1016/ j.dsr.2009.10.013.
16. Gao K, Xu J, Gao G, Li Y, Hutchins DA, et al. (2012) Rising CO2and increased
light exposure synergistically reduce marine primary productivity. Nature Climate Change 2: 519–523. doi:10.1038/nclimate1507.
17. Boyd PW, Strzepek R, Fu F, Hutchins DA (2010) Environmental control of open-ocean phytoplankton groups: Now and in the future. Limnology and Oceanography 55: 1353–1376. doi:10.4319/lo.2010.55.3.1353.
18. Yang G, Gao K (2012) Physiological responses of the marine diatomThalassiosira
pseudonana to increased pCO2and seawater acidity. Marine Environmental
Research 79: 142–151. doi:10.1016/j.marenvres.2012.06.002.
19. Boelen P, Van de Poll WH, Van der Strate HJ, Neven IA, Beardall J, et al. (2011) Neither elevated nor reduced CO2 affects the photophysiological
performance of the marine Antarctic diatom Chaetoceros brevis. Journal of Experimental Marine Biology and Ecology 406: 38–45. doi:10.1016/ j.jembe.2011.06.012.
20. Nielsen LT, Hallegraeff GM, Wright SW, Hansen PJ (2012) Effects of experimental seawater acidification on an estuarine plankton community. Aquatic Microbial Ecology 65: 271–285. doi:10.3354/ame01554.
21. Tortell PD, DiTullio GR, Sigman DM, Morel FMM (2002) CO2effects on
taxonomic composition and nutrient utilization in an Equatorial Pacific phytoplankton assemblage. Marine Ecology Progress Series 236: 37–43. doi:10.3354/meps236037.
22. Falkowski PG, Owens TG, Ley AC, Mauzerall DC (1981) Effects of Growth Irradiance Levels on the Ratio of Reaction Centers in Two Species of Marine Phytoplankton 1. Plant Physiology 68: 969–973.
23. Leonardos N, Geider RJ (2004) Effects of nitrate: phosphate supply ratio and irradiance on the C: N: P stoichiometry ofChaetoceros muelleri. European Journal of Phycology 39: 173–180. doi:10.1080/0967026042000201867.
24. Murata N, Takahashi S, Nishiyama Y, Allakhverdiev SI (2007) Photoinhibition of photosystem II under environmental stress. Biochimica et Biophysica Acta 1767: 414–421. doi:10.1016/j.bbabio.2006.11.019.
25. Raven JA (2011) The cost of photoinhibition. Physiologia Plantarum 142: 87– 104. doi:10.1111/j.1399-3054.2011.01465.x.
26. Moore JK, Doney SC, Glover DM, Fung IY (2001) Iron cycling and nutrient-limitation patterns in surface waters of the World Ocean. Deep Sea Research Part II: Topical Studies in Oceanography 49: 463–507. doi:10.1016/S0967-0645(01)00109-6.
27. Sarthou G, Timmermans KR, Blain S, Tre´guer P (2005) Growth physiology and fate of diatoms in the ocean: a review. Journal of Sea Research 53: 25–42. doi:10.1016/j.seares.2004.01.007.
28. Wagner H, Jakob T, Wilhelm C (2006) Balancing the energy flow from captured light to biomass under fluctuating light conditions. The New Phytologist 169: 95–108. doi:10.1111/j.1469-8137.2005.01550.x.
29. Lavaud J (2007) Fast regulation of photosynthesis in diatoms: mechanisms, evolution and ecophysiology. In: Functional Plant Science and Biotechnology. Ikenobe, Japan: Global Science Books. pp. 267–287.
30. Lavaud J, Strzepek RF, Kroth PG (2007) Photoprotection capacity differs among diatoms: Possible consequences on the spatial distribution of diatoms related to fluctuations in the underwater light climate. Limnology and Oceanography 52: 1188–1194. doi:10.4319/lo.2007.52.3.1188.
31. Key T, McCarthy A, Campbell DA, Six C, Roy S, et al. (2010) Cell size trade-offs govern light exploitation strategies in marine phytoplankton. Environmental Microbiology 12: 95–104.
32. Loebl M, Cockshutt AM, Campbell DA, Finkel ZV (2010) Physiological basis for high resistance to photoinhibition under nitrogen depletion inEmiliania huxleyi. Limnology and Oceanography 55: 2150–2160. doi:10.4319/lo.2010.55.5.2150. 33. Ragni M, Airs R, Leonardos N, Geider R (2008) Photoinhibition of PSII in
Emiliania huxleyi(Haptophyta) under high light stress: The roles of photoacclima-tion, photoprotection and photorepair. Journal of Phycology 44: 670–683. doi:10.1111/j.1529-8817.2008.00524.x.
34. Six C, Finkel ZV, Irwin AJ, Campbell DA (2007) Light Variability Illuminates Niche-Partitioning among Marine Picocyanobacteria. PLoS ONE 2: e1341. doi:10.1371/journal.pone.0001341.
35. Six C, Sherrard R, Lionard M, Roy S, Campbell DA (2009) Photosystem II and Pigment Dynamics among Ecotypes of the Green Alga Ostreococcus. Plant Physiology 151: 379–390.
36. Quigg A, Beardall J (2003) Protein turnover in relation to maintenance metabolism at low photon flux in two marine microalgae. Plant, Cell & Environment 26: 693–703. doi:10.1046/j.1365-3040.2003.01004.x.
37. Hoogstraten A, Timmermans KR, De Baar HJW (2012) Morphological and physiological effects inProboscia alata(Bacillariophyceae) grown under different light and CO2conditions of the modern southern ocean. Journal of Phycology
48: 559–568. doi:10.1111/j.1529-8817.2012.01148.x.
38. Armbrust EV, Berges JA, Bowler C, Green BR, Martinez D, et al. (2004) The genome of the diatom Thalassiosira pseudonana: Ecology, evolution, and metabolism. Science 306: 79–86. doi:10.1126/science.1101156.
39. Grouneva I, Rokka A, Aro E-M (2011) The thylakoid membrane proteome of two marine diatoms outlines both diatom-specific and species-specific features of the photosynthetic machinery. Journal of Proteome Research 10: 5338–5353. doi:10.1021/pr200600f.
40. Li G, Gao K, Yuan D, Zheng Y, Yang G (2011) Relationship of photosynthetic carbon fixation with environmental changes in the Jiulong River estuary of the South China Sea, with special reference to the effects of solar UV radiation. Marine Pollution bulletin 62: 1852–1858. doi:10.1016/j.marpol-bul.2011.02.050.
41. Zhai W, Dai M, Cai W-J, Wang Y, Wang Z (2005) High partial pressure of CO2
and its maintaining mechanism in a subtropical estuary: the Pearl River estuary, China. Marine Chemistry 93: 21–32. doi:10.1016/j.marchem.2004.07.003. 42. Berges JA, Franklin DJ, Harrison PJ (2001) Evolution of an artificial seawater
medium: Improvements in enriched seawater, artificial water over the last two decades. Journal of Phycology 37: 1138–1145. doi:10.1046/j.1529-8817.2001.01052.x.
43. Shi D, Xu Y, Morel FMM (2009) Effects of the pH/pCO2 control method on medium chemistry and phytoplankton growth. Biogeosciences 6: 1199–1207. doi:10.5194/bg-6-1199-2009.
44. McGinn PJ, Jones MJ, Macdonald AB, Campbell DA (2005) Light is required for low-CO2-mediated induction of transcripts encoding components of the CO2 -concentrating mechanism in the cyanobacteriumSynechococcus elongatus: analysis by quantitative reverse transcription - polymerase chain reaction. Canadian Journal of Botany 83: 711–720. doi:10.1139/b05-055.
45. Lewis E, Wallace D (1998) CO2SYS, Program Developed for CO2System
Calculations. ORNL/CDIAC-105.
46. Peng T-H, Takahashi T, Broecker WS, Olafsson J (1987) Seasonal variability of carbon dioxide, nutrients and oxygen in the northern North Atlantic surface water: observations and a model. Tellus B 39B: 439–458. doi:10.1111/j.1600-0889.1987.tb00205.x.
47. Mehrbach C, Culberson C, Hawley J, Pytkowicz R (1973) Measurement of the apparent dissociation constants of carbonic acid in seawater at atmospheric pressure. Limnology and Oceanography 18: 897–907. Available: http://www. aslo.org/lo/toc/vol_18/issue_6/0897.pdf. Accessed 2013 Jan 8.
48. MacGillivary ML, Ehrman JM (2011) A readily available SEM substrate for a random orientation of diatom frustules. Diatom Research 26: 321–323. doi:10.1080/0269249X.2011.639145.
49. Ehrman JM, Kaczmarska I (2012) Strategies for high-throughput microscopy in algal research. Current Advances in algal taxonomy and its applications: Phylogenetic, ecological and applied perspective. W. Szafer Institute of Botany, Polish Academy of Sciences, Krako´w. pp. 253–262.
50. Campbell DA, Tyystja¨rvi E (2012) Parameterization of photosystem II photoinactivation and repair. Biochimica et Biophysica Acta (BBA) -Bioenergetics 1817: 258–265. doi:10.1016/j.bbabio.2011.04.010.
51. Wu H, Cockshutt AM, McCarthy A, Campbell DA (2011) Distinctive Photosystem II Photoinactivation and Protein Dynamics in Marine Diatoms. Plant Physiology 156: 2184–2195. doi:10.1104/pp.111.178772.
52. Barnett AB (2007) Fireworx. Available: http://sourceforge.net/projects/ fireworx. Accessed 2012 Apr 24.
53. Van Kooten O, Snel J (1990) The use of chlorophyll fluorescence nomenclature in plant stress physiology. Photosynthesis Research 25: 147–150.
54. Brown C, Mackinnon J, Cockshutt A, Villareal T, Campbell D (2008) Flux capacities and acclimation costs in Trichodesmium from the Gulf of Mexico. Marine Biology 154: 413–422. doi:10.1007/s00227-008-0933-z.
55. Jeffrey S, Humphrey G (1975) New spectrophotometric equations for determining chlorophylls a1, b1, c1 and c2 in higher plants, algae and natural phytoplankton. Biochemie und Physiologie der Pflanzen 167: 191–194. 56. Heath RL, Packer L (1968) Photoperoxidation in isolated chloroplasts: I.
57. Janknegt PJ, Van De Poll WH, Visser RJW, Rijstenbil JW, Buma AGJ (2008) Oxidative stress responses in the marine antarctic diatom Chaetoceros brevis
(Bacillariophyceae) during Photoacclimation. Journal of Phycology 44: 957–966. doi:10.1111/j.1529-8817.2008.00553.x.
58. Platt T, Gallegos C, Harrison W (1980) Photoinhibition of photosynthesis in natural assemblages of marine phytoplankton. Journal of Marine Research 38: 687–701.
59. Wu H, Roy S, Alami M, Green BR, Campbell DA (2012) Photosystem II Photoinactivation, Repair, and Protection in Marine Centric Diatoms. Plant Physiology 160: 464–476. doi:10.1104/pp.112.203067.
60. Raven JA (1991) Physiology of inorganic C acquisition and implications for resource use efficiency by marine phytoplankton: relation to increased CO2and
temperature. Plant, Cell & Environment 14: 779–794. doi:10.1111/j.1365-3040.1991.tb01442.x.
61. Hopkinson BM, Xu Y, Shi D, McGinn PJ, Morel FMM (2010) The effect of CO2on the photosynthetic physiology of phytoplankton in the Gulf of Alaska.
Limnology and Oceanography 55: 2011–2024. doi:10.4319/lo.2010.55.5.2011. 62. Cullen JJ, Lewis MR (1988) The kinetics of algal photoadaptation in the context of vertical mixing. Journal of Plankton Research 10: 1039–1063. doi:10.1093/ plankt/10.5.1039.
63. Takahashi S, Milward SE, Yamori W, Evans JR, Hillier W, et al. (2010) The solar action spectrum of photosystem II damage. Plant Physiology 153: 988–993. doi:10.1104/pp.110.155747.
64. Janknegt PJ, De Graaff CM, Van De Poll WH, Visser RJW, Rijstenbil JW, et al. (2009) Short-term antioxidative responses of 15 microalgae exposed to excessive irradiance including ultraviolet radiation. European Journal of Phycology 44: 525–539. doi:10.1080/09670260902943273.
65. Waring J, Klenell M, Bechtold U, Underwood GJC, Baker NR (2010) Light-Induced Responses of Oxygen Photoreduction, Reactive Oxygen Species Production and Scavenging in Two Diatom Species. Journal of Phycology 46: 1206–1217. doi:10.1111/j.1529-8817.2010.00919.x.
66. Litchman E, Neale P, Banaszak A (2002) Increased sensitivity to ultraviolet radiation in nitrogen-limited dinoflagellates: Photoprotection and repair. Limnology and Oceanography 47: 86–94.
67. Ingalls AE, Whitehead K, Bridoux MC (2010) Tinted windows: The presence of the UV absorbing compounds called mycosporine-like amino acids embedded in the frustules of marine diatoms. Geochimica et Cosmochimica Acta 74: 104– 115. doi:10.1016/j.gca.2009.09.012.
68. Fuhrmann T, Landwehr S, El Rharbi-Kucki M, Sumper M (2004) Diatoms as living photonic crystals. Applied Physics B: Lasers and Optics 78: 257–260. doi:10.1007/s00340-004-1419-4.
69. Milligan AJ, Morel FMM (2002) A Proton Buffering Role for Silica in Diatoms. Science 297: 1848–1850. doi:10.1126/science.1074958.
70. Thomas S, Campbell DA (2013) Photophysiology ofBolidomonas pacifica. Journal of Plankton Research. In press.
71. Grouneva I, Gollan P, Kangasja¨rvi S, Suorsa M, Tikkanen M, et al. (2012) Phylogenetic viewpoints on regulation of light harvesting and electron transport in eukaryotic photosynthetic organisms. Planta: 1–14. doi:10.1007/s00425-012-1744-5.
72. Morel A, Bricaud A (1981) Theoretical results concerning light absorption in a discrete medium, and application to specific absorption of phytoplankton. Deep Sea Research Part A Oceanographic Research Papers 28: 1375–1393. doi:10.1016/0198-0149(81)90039-X.
73. Finkel Z (2007) Light Absorption and Size Scaling of Light-Limited Metabolism in Marine Diatoms: 1–10.
74. Huner NP, O¨ quist G, Sarhan F (1998) Energy balance and acclimation to light and cold. Trends in Plant Science 3: 224–230. doi:10.1016/S1360-1385(98)01248-5.
75. Nixon P, Michoux F, Yu J, Boehm M, Komenda J (2010) Recent advances in understanding the assembly and repair of photosystem II. Annals of Botany 106: 1–16. doi:10.1093/aob/mcq059.
76. Hong Y, Hu H-Y, Li F-M (2008) Growth and physiological responses of freshwater green algaSelenastrum capricornutumto allelochemical ethyl 2-methyl acetoacetate (EMA) under different initial algal densities. Pesticide Biochemistry and Physiology 90: 203–212. doi:10.1016/j.pestbp.2007.11.009.
77. Burey SC, Poroyko V, Ergen ZN, Fathi-Nejad S, Schu¨ller C, et al. (2007) Acclimation to low [CO2] by an inorganic carbon-concentrating mechanism in
Cyanophora paradoxa. Plant, Cell & Environment 30: 1422–1435. doi:10.1111/ j.1365-3040.2007.01715.x.
78. Nishiyama Y, Allakhverdiev S, Murata N (2006) A new paradigm for the action of reactive oxygen species in the photoinhibition of photosystem II. Biochimica et Biophysica Acta 1757: 742–749. doi:10.1016/j.bbabio.2006.05.013. 79. Oguchi R, Terashima I, Kou J, Chow WS (2011) Operation of dual mechanisms
that both lead to photoinactivation of Photosystem II in leaves by visible light. Physiologia plantarum 142: 47–55. doi:10.1111/j.1399-3054.2011.01452.x. 80. Vass I (2011) Role of charge recombination processes in photodamage and
photoprotection of the photosystem II complex. Physiologia Plantarum 142: 6– 16. doi:10.1111/j.1399-3054.2011.01454.x.
81. Finkel ZV, Beardall J, Flynn KJ, Quigg A, Rees TAV, et al. (2010) Phytoplankton in a changing world: cell size and elemental stoichiometry. Journal of Plankton Research 32: 119–137. doi:10.1093/plankt/fbp098. 82. Chen B, Liu H, Landry MR, Chen M, Sun J, et al. (2009) Estuarine nutrient