The Prognostic Role of mTOR and P-mTOR
for Survival in Non-Small Cell Lung Cancer: A
Systematic Review and Meta-Analysis
Lei Li1, Dan Liu1, Zhi-Xin Qiu1, Shuang Zhao1, Li Zhang2, Wei-Min Li1*
1Department of Respiratory Medicine, West China Hospital, Sichuan University, Chengdu, P.R. China,2
Lab of Pathology, Department of Pathology, West China Hospital, Sichuan University, Chengdu, P.R. China
Abstract
Objectives
The mammalian target of rapamycin (mTOR) and phosphorylated mTOR (p-mTOR) are po-tential prognostic markers and therapeutic targets for non-small cell lung cancer (NSCLC).
However, the association between mTOR/p-mTOR expression and NSCLC patients’
nosis remains controversial. Thus, a meta-analysis of existing studies evaluating the prog-nostic role of mTOR/p-mTOR expression for NSCLC was conducted.
Materials and Methods
A systemically literature search was performed via Pubmed, Embase, Medline as well as CNKI (China National Knowledge Infrastructure). Studies were included that reported the hazard ratio (HR) and 95%CI for the association between mTOR/p-mTOR expression and
NSCLC patients’survival. Random-effects model was used to pool HRs.
Results
Ten eligible studies were included in this meta-analysis, with 4 about m-TOR and 7 about p-mTOR. For mTOR, the pooled HR of overall survival (OS) was 1.00 (95%CI 0.5 to 1.99) by univariate analysis and 1.22 (95%CI 0.53 to 2.82) by multivariate analysis. For p-mTOR, the pooled HR was 1.39 (95%CI 0.97 to 1.98) by univariate analysis and 1.42 (95%CI 0.56 to 3.60) by multivariate analysis.
Conclusion
The results indicated that no statistically significant association was found between mTOR/
p-mTOR expression and NSCLC patients’prognosis.
OPEN ACCESS
Citation:Li L, Liu D, Qiu Z-X, Zhao S, Zhang L, Li W-M (2015) The Prognostic Role of mTOR and P-mTOR for Survival in Non-Small Cell Lung Cancer: A Systematic Review and Meta-Analysis. PLoS ONE 10(2): e0116771. doi:10.1371/journal.pone.0116771
Academic Editor:Rui Manuel Reis, University de Minho, PORTUGAL
Received:August 1, 2014
Accepted:December 13, 2014
Published:February 13, 2015
Copyright:© 2015 Li et al. This is an open access article distributed under the terms of theCreative Commons Attribution License, which permits unrestricted use, distribution, and reproduction in any medium, provided the original author and source are credited.
Data Availability Statement:All relevant data are within the paper and its Supporting Information files.
Introduction
Lung cancer is the leading cause of cancer-related death all over the world during the past few years. Non-small cell lung cancer (NSCLC) represents the most frequent type, with a percent-age of 80–85% of all primary lung carcinomas[1]. With the continuous researches on the mechanism of carcinogenesis, treatments such as chemotherapy, radiotherapy and surgery have improved a lot. However, the 5-year survival rate is still not exceeding 15% until now[2]. Current knowledge regards NSCLC as the outcome of changes in several signaling pathways. Therefore, managements of some key therapeutic targets may help to predict and improve the prognosis of NSCLC[3].
Several therapeutic targets have drawn public attention, such as EGFR[4], HER2[5] and KRAS[6]. However, problems on drug resistance and gene mutation rate limit their develop-ment. In recent years, another potential candidate, phosphatidylinositol 3-kinase/v-akt murine thymoma viral oncogene homolog 1/mammalian target of rapamycin pathway (PI3K/Akt/ mTOR pathway) emerges. It plays a critical role in cell survival, growth, proliferation, motility, as well as metabolism [7–9]. The mammalian target of rapamycin (mTOR) consists of two in-dependent functional complexes: mTORC1 and mTORC2. They are phosphorylated by Akt1 at Ser2448. Then phosphorylated mTOR (p-mTOR) will activate P70S6K and inhibit 4EBP1, regulating ribosome biogenesis and protein synthesis[10]. Dysregulation of mTOR signaling pathway, which is due to genetic variation of several key genes, has bene observed in different types of cancers, such as urothelial bladder cancer[11], breast cancer[12], hepatocellular carci-noma[13] and lung cancer[14].
During the past few years, effects of dysregulation of mTOR pathway has been intensively investigated for NSCLC. However, the assocication between prognosis and mTOR/p-mTOR expression is still controversial. According to the contradictory results gathering from different studies, this meta-analysis was conducted to assess the prognostic value of mTOR/p-mTOR expression for NSCLC patients.
Methods
1. Literature search strategy
Pubmed, Embase, Medline (ovid), Cochrane Library as well as CNKI (China National Knowl-edge Infrastructure) was searched comprehensively for relevant articles published until July 5, 2014. The search terms were used as follows: (1). mTOR or mammalian targets of rapamycin; (2). lung tumor or lung cancer or lung carcinoma or lung neoplasm; (3). survival or prognosis or prognostic.
2. Eligibility criteria
All languages were included, but articles with abstract only were excluded because of insuffi-cient information. Titles and abstracts were examined at first to eliminate not applicable stud-ies, such as studies on animals or cell lines, reviews and studies about other diseases. Then all remaining articles were screened carefully for eligibility. Articles were included in this meta-analysis if they met the following criteria: (1). Proven diagnosis of NSCLC; (2). Immunohis-tochemistry (IHC) was used to measure the expression level of mTOR and p-mTOR; (3). The correlation of mTOR/p-mTOR expression and patients’overall survival (OS) were analyzed; (4). Hazard Ratio (HR) and 95% confidence interval (CI) were provided or could be calculated. (5). If the same cohort of patients were analyzed in more than one studies, only the most recent and complete study could be included. Either abstracts or full texts were examined by two design, data collection and analysis, decision to
publish, or preparation of the manuscript.
reviewer (Lei Li and Dan Liu) independently. Disagreements were resolved by discussion with the third reviewer (Li Zhang).
3. Data extraction
Data were extracted from eligible studies by two reviewers (Lei Li and Dan Liu) independently with a predefined table. The following variables were retrieved: first author, publication year, country where the study was conducted, sample size, histological type, HR with its 95%CI (uni-variate and multi(uni-variate analysis). Quality of the eligible studies was assessed with the Europe-an Lung CEurope-ancer Working Party quality scale for biological prognostic factors for lung cEurope-ancer [15].
4. Statistical analysis
HR was used as the effective index to describe the impact of mTOR/p-mTOR expression on overall survival of the patients. Positive mTOR/p-mTOR expression inticated poor survival if HR>1 and its 95%CI did not overlap with 1. Some studies presented HR and 95%CI directly. In
other studies, Kaplan-Meier survival curves were used to calculate these values, with a software named Engauge Digitizer Version 4.1 (free software fromhttp://digitizer.sourceforge.net/). This method was reported by Parmar MK[16] and has been widely used in meta-analysis for survival endpoints[17,18]. Then individual HRs were extracted to calculate pooled HR. A fixed-effects model or random-effects model was used according to the heterogeneity analysis.
Q test and I2test were used to measure heterogeneity among studies[19], while funnel plot and Begg’s test were used to estimate the potential publication bias[20]. Moreover, sensitivity analysis and subgroup analysis were also conducted. All p values in this meta-analysis were two tailed, and P<0.05 was considered statistically significant. STATA 12.0 (Stata Corporation,
College Station, Texas) was used to conduct the statistical analysis.
Result
1. Literature search
A flowchart of our literature searching process is shown inFig. 1. Using the searching strategy above, 773 entries were retrieved. After removal of 238 duplicate articles, 535 titles and ab-stracts were screened carefully. Thirty-seven articles appeared to be eligible for this meta-analysis. Of the remaining articles, 27 studies were ruled out because of the following reason: expression level of mTOR/p-mTOR not measured (21), no data about HRs but median survival time or 5-year survival rate (3), no data about OS but cancer specific survival (CSS) or progres-sion free survival (PFS). Eventually, 10 articles were eligible for this meta-analysis, including 4 about mTOR expression and 7 about p-mTOR expression.
Study characteristics. Characteristics of 4 studies on mTOR were shown inTable 1. These articles were published between 2009 and 2012. A total of 614 participants were involved. Two of these studies were launched in Europe, 1 in USA and 1 in Asian. All articles reported HRs and 95%CI directly. Except for 1 study, other researches reported both univariate analysis and multivariate analysis.
Characteristics of 7 studies on p-mTOR were listed inTable 2. These studies were published between 2008 and 2014. Five studies were conducted in Asian and 2 in USA. A total of 1525 pa-tients were enrolled. Two articles did not report HRs and 95%CI directly, so K-M curves were used to calculate these results.
IHS: a semiquantitative immunohistochemical score used to assess both the intensity of staining and the percentage of positive cells; Blinded reading: readers of the slides without knowing clinical information.
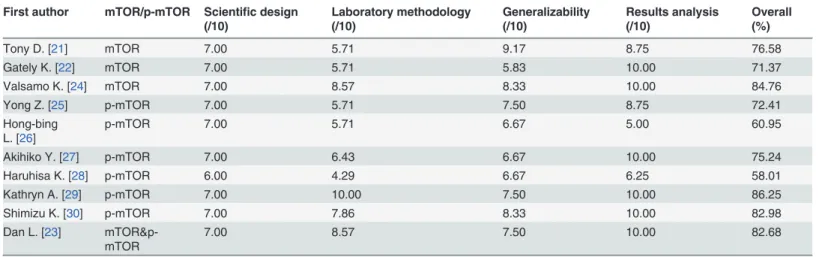
2. Quality assessment
The quality of 10 included articles was assessed according to Lung Cancer Working Party qual-ity scale for biological prognostic factors for lung cancer. Results were listed inTable 4. For the Figure 1. The literature searching process.(*) One article reported both the mTOR and the p-mTOR expression level.
doi:10.1371/journal.pone.0116771.g001
Table 1. Characteristics of studies on mTOR expression.
First authe
Country year No. of patients (mTOR high/low)
Age (y) Histological type(SCC/ ADC/Other)
Stage (Ⅰ/Ⅱ/Ⅲ/Ⅳ)
Univariate HR estimated Univariate HR(95%CI) Multivariate HR estimated Multivariate HR(95%CI) Tony D. [21]
Italy 2010 134(73/61) >=
65y, 57
<65y,
77
56/41/37 91/43/0/0 HR 95%CI 1.77(1.17– 2.73)
HR 95%CI 1.66(1.01– 2.74)
Gately K. [22]
UK 2012 141(101/
40)
>=
65y, 67
<65y,
74
67/60/14 97/44/0/0 HR 95%CI 1.85(0.98– 3.49)
HR 95%CI 2.18(1.12– 4.23)
Liu D.[23] China 2011 172(106/ 28)
>=
60y, 91
<60y,
81
75/77/20 I-II,85 III-IV, 87
HR 95%CI 0.645 (0.377– 1.103)
NA NA
Valsamo K.[24]
USA 2009 167(94/73) 64 NA NA HR 95%CI 0.44(0.22–
0.88)
HR 95%CI 0.48(0.24– 0.98)
Abbreviation:SCC,squamous cell carcinoma; ADC,adenocarcinoma; HR hazard ratio; NA,no available
Table 2. Characteristics of studies on p-mTOR expression.
First auther
Country Year No. of patients (p-mTOR high/ low)
Age (y) Histological type(SCC/ADC/ Other)
Stage (Ⅰ/Ⅱ/Ⅲ/Ⅳ)
Univariate HR estimated Univariate HR(95%CI) Multivariate HR estimated Multivariate HR(95%CI) Yong Z. [25]
China 2013 120(58/62) >= 60y,
66
<60y,
54
63/57/0 38/34/40/ 8
K-M curve 2.66(1.66– 4.27)
HR 95%CI 2.642(1.157– 4.904)
Hong-bing L.[26]
China 2008 59(24/35) >= 60y,
28
<60y,
31
27/28/4 16/25/18/ 0
K-M curve 1.78(0.8– 3.95)
HR 95%CI 0.686(0.274– 1.721)
Akihiko Y. [27]
USA 2010 276(129/ 147)
NA 138/138/0 115/29/
30/7
HR 95%CI 1.01 (0.75– 1.36)
NA NA
Liu D.[23] China 2011 172(89/82) >= 60y,
91
<60y,
81
75/77/20 I-II,85 III-IV, 87
HR 95%CI 1.917 (1.349– 2.724)
HR 95%CI 3.299(1.928– 5.645)
Haruhisa K.[28]
Japan 2014 220(163/57) 65±9.0 78/148/4 126/43/ 49/2
K-M curve 0.55(0.28– 1.27)
NA NA
Kathryn A. [29]
USA 2014 370(NA) 65.7
(32–90
126/227/17 234/75/ 61/0
NA NA HR 95%CI 0.662(0.460–
0.952) Shimizu
K.*[30]
Japan 2014 104(41/63) >= 65y,
73
<65y,
31
66/38/0 I-II,80 III-IV, 24
HR 95%CI 1.079 (0.597– 1.948)
NA NA
Shimizu K.*[30]
Japan 2014 204(56/148) >= 65y,
137
<65y,
67
142/62/0 I-II,159 III-IV, 41
HR 95%CI 1.475 (0.868– 2.505)
NA NA
*Two independent groups were studied in this article, and HRs were reported separately.
doi:10.1371/journal.pone.0116771.t002
Table 3. IHC criteria used to detect mTOR/p-mTOR.
First author Cut off value antibody company dilution Blinded reading
mTOR
Tony D.[21] >30 scores (IHS) Rabbit monoclonal antibody CST, Danvers, MA 1:50 Yes
Gately K.[22] >30 scores (IHS) Rabbit monoclonal antibody CST, Danvers, MA 1:50 Yes
Liu D.[23] >= 2 scores Rabbit monoclonal antibody CST, Beverly, MA 1:50 Yes
Valsamo K.[24] >28 scores(IHS) Rabbit monoclonal antibody CST 1:50 NA
p-mTOR
Yong Z.[25] >= 2 scores NA CST 1:50 Yes
Hong-bing L.[26] >= 2 scores Ser2448, Rabbit monoclonal antibody CST 1:100 NA
Akihiko Y.[27] TS3, TS4, TS5 Ser2448 CST 1:100 Yes
Liu D.[23] >= 2 scores Ser 2448, Rabbit monoclonal antibody CST, Beverly, MA 1:100 Yes
Haruhisa K.[28] NA NA CST, Beverly, MA 1:100 NA
Kathryn A.[29] >= 2 scores NA CST 1:100 Yes
Shimizu K.*[30] >= 2 scores Rabbit monoclonal antibody CST, Danvers, MA 1:80 Yes
scientific design part, all of the articles represented study objectives, outcome definition and statistical methods distinctly, while preliminary assessment of the sample size was reported in none of these studies. For the other parts, scores differed obviously from each other. Seven arti-cles didn’t test the reproducibility of the results, six didn’t present the tissue
sample conservation.
3. Relationship of mTOR expression with survival
Of the four articles about mTOR expression, all were pooled into meta-analysis by univariate analysis, and 3 were included in meta-analysis by multivariate analysis because one study didn’t provide enough information.
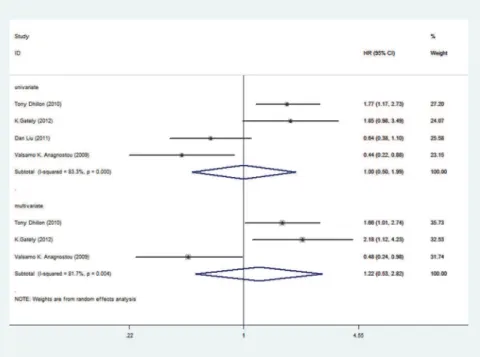
Four articles, including 614 participants, represented the HRs using univariate analysis. HRs for each study and pooled HR were shown inFig. 2. The prognostic roles of mTOR/p-mTOR for NSCLC were inconsistent in different studies, with both negative and positive reported. The pooled HR was 1.00 (95%CI 0.5 to 1.99), indicating no statistically significant relationship between mTOR expression and overall survival. Random-effects model was used because of significant heterogeneity (P = 0.000, I2= 83.3%) among researches. Three articles were included in the meta-analysis by multivariate analysis, with a total of 442 patients. The as-sociation between mTOR expression and prognosis remained no statistical significance, with the pooled HR of 1.22 (95%CI 0.53 to 2.82). Random-effects model was used because of signifi-cant heterogeneity (P = 0.004, I2= 81.7%) among researches.
4. Relationship of p-mTOR expression with survival
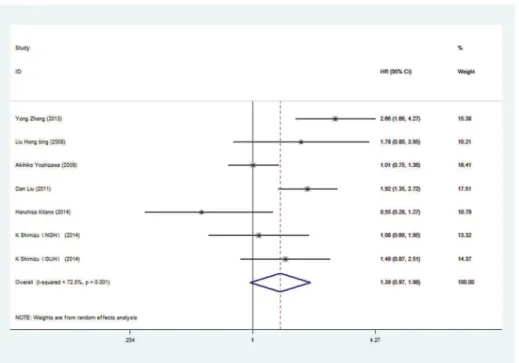
Among the 7 articles about p-mTOR, six reported HRs by univariate analysis and 4 reported HRs by multivariate analysis. Meta-analysis was conducted by univariate analysis at first, in-cluding 1155 participants (Fig. 3.). The pooled HR was 1.39 (95%CI 0.97 to 1.98), indicating no statistically significant relationship between p-mTOR expression and overall survival. Ran-dom-effects model was used because of significant heterogeneity (P = 0.001, I2= 72.5%) among researches. The pooled HR of p-mTOR by multivariate analysis was shown inFig. 4. Four arti-cles and 721 patients were included. The pooled HR was 1.42 (95%CI 0.56 to 3.60), indicating no statistically significant relationship between p-mTOR expression and overall survival. Table 4. Quality assessment for the studies included in the meta-analysis.
First author mTOR/p-mTOR Scientific design (/10)
Laboratory methodology (/10)
Generalizability (/10)
Results analysis (/10)
Overall (%)
Tony D. [21] mTOR 7.00 5.71 9.17 8.75 76.58
Gately K. [22] mTOR 7.00 5.71 5.83 10.00 71.37
Valsamo K. [24] mTOR 7.00 8.57 8.33 10.00 84.76
Yong Z. [25] p-mTOR 7.00 5.71 7.50 8.75 72.41
Hong-bing L. [26]
p-mTOR 7.00 5.71 6.67 5.00 60.95
Akihiko Y. [27] p-mTOR 7.00 6.43 6.67 10.00 75.24
Haruhisa K. [28] p-mTOR 6.00 4.29 6.67 6.25 58.01
Kathryn A. [29] p-mTOR 7.00 10.00 7.50 10.00 86.25
Shimizu K. [30] p-mTOR 7.00 7.86 8.33 10.00 82.98
Dan L. [23] mTOR&p-mTOR
7.00 8.57 7.50 10.00 82.68
Random-effects model was used because of significant heterogeneity (P = 0.000, I2= 90.0%) among researches.
5. Subgroup analysis
Because of too few articles about mTOR expression, stratifying analysis was only conducted for p-mTOR by univariate analysis. Main results of subgroup analysis were listed inTable 5(Forest plots of each group were presented inS1,S2,S3,S4,S5Figs.). Stratifying by geographic region, the pooled HR for studies conducted in China was 2.11 (95%CI 1.66 to 4.27) with less heteroge-neity (p = 0.501, I2= 0.0%), indicating that p-mTOR expression was significantly associated with poor prognosis; However, the condition was different in non-China subgroup (HR 1.03, 95%CI 0.83 to 1.30) with less heterogeneity (p = 0.217, I2= 32.6%). Stratified analysis according to stage was also conducted; p-mTOR expression was associated with poor prognosis (HR 2.11, 95%CI 1.66 to 4.27) in studies with more I-II patients, with less heterogeneity (p = 0.501, I2= 0.0%). The association between p-mTOR expression and poor prognosis remained statistically significant in subgroup with less ADC patients (HR 1.77, 95%CI 1.33 to 2.35). However, no sta-tistically significant association between p-mTOR and prognosis was found in subgroup with number of patients more than 200 (HR 1.03, 95%CI 0.80 to 1.31).
When grouped by the way HR was provided, 4 articles listed HR and 95%CI directly, while 3 showed the K-M curves only. In both of the two subgroups, no statistically significant rela-tionship was found between p-mTOR expression and prognosis, with
significant heterogeneity.
6. Publication bias
Begg’s test was performed to evaluate the publication bias (Fig. 5). No evidence of publication bias for p-mTOR by univariate analysis was found (p = 0.881).
Figure 2. Forest plot showing the pooled HR of mTOR from random-effects model for overall survival by univariate and multivariate analysis
7. Sensitivity analysis
Because of limiting number of articles using multivariate analysis, sensitivity analysis were per-formed in articles using univariate analysis. Results were shown inFig. 6. One article was Figure 3. Forest plot showing the pooled HR of p-mTOR from random-effects model for overall survival by univariate analysis.
doi:10.1371/journal.pone.0116771.g003
Figure 4. Forest plot showing the pooled HR of p-mTOR from random-effects model for overall survival by multivariate analysis.
omitted at a time. The deletion of any individual article made no significant difference, indicat-ing the robustness of the results in this meta-analysis.
Discussion
The current meta-analysis summarized results of 10 articles, including 4 on mTOR expression with a total of 614 participants, and 7 on p-mTOR with 1525 cases. The pooled HR of overall Table 5. Subgroup analysis for p-mTOR by univariate analysis.
Factor No. of study No. of patients HR 95%CI Heterogeneity (P) Heterogeneity (I2, %)
Geographic region
China 3 351 2.11 1.66–4.27 0.501 0.0
Non-China 4 804 1.03 0.83–1.30 0.217 32.6
Stage I-II (%)
>= 70 3 351 2.11 1.66–4.27 0.501 0.0
>70 4 804 1.03 0.83–1.30 0.217 32.6
Histological type (ADC %)
>= 50 2 496 0.83 0.47–1.45 0.143 53.5
<50 5 659 1.77 1.33–2.35 0.187 35.2
HR estimated
HR 95%CI 4 756 1.33 0.94–1.88 0.045 62.7
K-M curve 3 399 1.42 0.55–3.64 0.002 83.4
No. of patients
<200 4 455 1.88 1.48–2.40 0.139 45.4
>= 200 3 700 1.03 0.80–1.31 0.109 54.8
doi:10.1371/journal.pone.0116771.t005
Figure 5. Begg funnel plot for publication bias test of the studies about p-mTOR expression by univariate analysis.
survival indicated that no statistically significance was founded between mTOR/p-mTOR ex-pression and NSCLC patients’prognosis, using both univariate analysis and multivariate analy-sis, with significant heterogeneity. However, when stratified by geographical region, stage, histological type and number of patients, heterogeneity reduced significantly. Moreover, signif-icant association was found between p-mTOR expression and poor prognosis in subgroups with more I-II patients, less ADC patients and studies conducted in China.
The prognostic role of mTOR/p-mTOR expression has been studied extensively in other types of cancers, despite results were still controversial. Xiaoyan Zhou et al[31]reported that p-mTOR expression increased when proliferation and invasion increased in breast cancer. Moreover, patients with high p-mTOR level had significantly shorter DFS. In gastric cancer, p-mTOR expression was closely linked to poor prognosis[32]. However, in Li Xiao’s research, cumulated survival rate of patients with mTOR expression was obviously higher than patients without its expression [33]. Thus, no consistent conclusion has been drawn about the prognos-tic significance of mTOR/p-mTOR in other cancers.
Moreover, mTOR inhibitors, such as deforolimus, everolimus and temsirolimus, has been accessed extensively in clinical trials for NSCLC. Thanyanan Reungwetwattana[34] reported that in a phaseⅡclinical trial with 52 frontline NSCLC patients, temsirolimus achieved a clini-cal benefit of 35% (8% confirmed PR and 27% with stable disease) as a single agent. In another clinical trial, everolimus monotherapy achieved 5.3% PR and a median PFS of 11.3 weeks in 85 patients with refractory advanced NSCLC[35]. These studies seemed inconsistent with results achieved in our meta-analysis. This paradox may result from the limited number of original ar-ticles included in this meta-analysis.
The current meta-analysis had several advantages. First, no publication bias was detected, and sensitivity analysis showed no significant difference when omitting any single article. Sec-ond, both mTOR and p-mTOR expression were studied, and both univariate and multivariate analysis were used in this meta-analysis.
Figure 6. Sensitivity analysis of all the studies about p-mTOR expression by univariate analysis
Meanwhile, several limitations existed in this meta-analysis should also be presented. First, the number of studies involved was relatively small, especially studies about mTOR expression. Pooled HRs would be biased by this limitation either towards exaggeration or underestimation; furthermore, stratifying analysis were difficult to conduct because of insufficient information. Second, some HRs were extracted from K-M curves. Inaccuracy may generate when reading survival rates. Third, confounding factors inherent in these included articles may also bias the pooled HR markedly. Although most of the original studies adjusted for several known risk fac-tors of NSCLC, many uncertain confounding facfac-tors could not be omitted. Thus, a more pre-cise analysis with sufficient information was needed to adjust for covariates such as age, gender, smoking status, histological type and TNM stage. Forth, despite all of the studies in-cluded use IHC to detect mTOR/p-mTOR expression, cut-off points for positive and negative expression varied apparently. It might also impact the results. Finally, although publication bias were not found in this meta-analysis, the potential bias was still possible because articles with positive results tend to be published easier.
In summary, no statistically significant relationship was found between mTOR/p-mTOR expression and NSCLC patients’prognosis. However, more high quality studies were needed to perform a more precise meta-analysis, exploring the prognostic significance of mTOR/p-mTOR expression in NSCLC.
Supporting Information
S1 Fig. Forest plot of subgroup analysis stratifying by geographic region. (TIF)
S2 Fig. Forest plot of subgroup analysis stratifying by stage. (TIF)
S3 Fig. Forest plot of subgroup analysis stratifying by histological type. (TIF)
S4 Fig. Forest plot of subgroup analysis stratifying by HR estimated. (TIF)
S5 Fig. Forest plot of subgroup analysis stratifying by number of patients. (TIF)
S1 PRISMA Checklist. PRISMA 2009 Checklist (DOC)
S1 PRISMA Diagram. PRISMA 2009 Flow Diagram (DOC)
Author Contributions
Conceived and designed the experiments: LL WML. Performed the experiments: LL DL ZXQ SZ LZ. Analyzed the data: LL DL. Contributed reagents/materials/analysis tools: DL LZ. Wrote the paper: ZXQ SZ. Wrote the manuscript: LL.
References
2. Giuseppe SR, Laura LP, Vincenzo A, Sergio S, Corrado F, et al. (2010) Driver mutations and differential sensitivity to targeted therapies a new approach to the treatment of lung adenocarcinoma. Cancer Treatment Reviews 36S3: S21–S29.
3. Zhou X, Tan M, Hawthorne VM, Klos KS, Lan KH, et al. (2004) Activation of the Akt/mammalian target of rapamycin/4E-BP1 pathway by ErbB2 overexpression predicts tumor progression in breast cancers. Clin Cancer Res 2004: 6779–6788.
4. Karachaliou N, Rosell R (2014) Systemic treatment in EGFR-ALK NSCLC patients: second line therapy and beyond. Cancer Biol Med 11: 173–181. doi:10.7497/j.issn.2095-3941.2014.03.003PMID: 25364578
5. Sadeghi S, Olevsky O, Hurvitz SA (2014) Profiling and targeting HER2-positive breast cancer using trastuzumab emtansine. Pharmgenomics Pers Med 7: 329–338. doi:10.2147/PGPM.S47524PMID: 25378946
6. Kyle LZ (2014) Mutant KRAS as a critical determinant of the therapeutic response of colorectal cancer. Genes & Diseases In Press, Accepted Manuscript, Available online 1 November 2014.
7. Houede N, Pourquier P (2014) Targeting the genetic alterations of the PI3K-AKT-mTOR pathway: Its potential use in the treatment of bladder cancers. Pharmacol Ther 2014:1879–016X
8. Shimobayashi M, Hall MN (2014) Making new contacts: the mTOR network in metabolism and signal-ling crosstalk. Nat Rev Mol Cell Biol 15: 155–162. doi:10.1038/nrm3757PMID:24556838
9. Populo H, Lopes JM, Soares P (2012) The mTOR Signalling Pathway in Human Cancer. Int J Mol Sci 13: 1886–1918. doi:10.3390/ijms13021886PMID:22408430
10. Mamane Y, Petroulakis E, LeBacquer O, Sonenberg N (2006) mTOR, translation initiation and cancer. Oncogene 25: 6416–6422. PMID:17041626
11. Bambury RM, Rosenberg JE (2013) Actionable mutations in muscle-invasive bladder cancer. Curr Opin Urol 23: 472–478. doi:10.1097/MOU.0b013e328363a3cdPMID:23907505
12. Ng VC, Johnson JJ, Cuellar S (2014) Targeting the mammalian target of rapamycin pathway with ever-olimus: Implications for the management of metastatic breast cancer. J Oncol Pharm Pract 2014: 1477–092X.
13. Loong HH, Yeo W (2014) Microtubule-targeting agents in oncology and therapeutic potential in hepato-cellular carcinoma. Onco Targets Ther 7: 575–585. doi:10.2147/OTT.S46019PMID:24790457
14. Rolfo C, Giovannetti E, Hong DS, Bivona T, Raez LE, et al. (2014) Novel therapeutic strategies for pa-tients with NSCLC that do not respond to treatment with EGFR inhibitors. Cancer Treat Rev 2014: 1532–1967.
15. Steels MP, Berghmans T, Branle F, Lemaitre F, Mascaux C, et al. (2001) Role of p53 as a prognostic factor for survival in lung cancer: a systematic review of the literature with a meta-analysis. Eur Respir J 18: 705–719. PMID:11716177
16. Mahesh VT, Stewart L (1998) Extracting summary statistics to perform meta-analyses of the published literature for survival endpoints. Statist Med 17: 2815–2834. PMID:9921604
17. Mei (2013) Prognostic significance ofβ-catenin expression in patients with non-small cell lung cancer: A meta-analysis. BioScience Trends 7: 42–49. PMID:23524892
18. Qiu ZX, Zhang K, Qiu XS, Zhou M, Li WM (2013) The Prognostic Value of Phosphorylated AKT Expres-sion in Non-Small Cell Lung Cancer: A Meta-Analysis. PLoS One 8: e81451. doi:10.1371/journal. pone.0081451PMID:24349071
19. Higgins JP, Thompson SG (2002) Quantifying heterogeneity in a meta-analysis. Stat Med 21: 1539– 1558. PMID:12111919
20. Egger M, Davey Smith G, Schneider M, Minder C (1997) Bias in meta-analysis detected by a simple, graphical test. British Medical Journal 315: 629–634. PMID:9310563
21. Tony D, Guido B, Lucio C, Mattia B, Bernard V, et al. (2010) Overexpression of the mammalian target of rapamycin a novel biomarker for poor survival in resected early stage non-small cell lung cancer. Journal of Thoracic Oncology 5: 314–319. doi:10.1097/JTO.0b013e3181ce6604PMID:20093977
22. Gately K, Alao B, Dhillon T, Mauri F, Cuffe S, et al. (2012) Overexpression of the mammalian target of rapamycin (mTOR) and angioinvasion are poor prognostic factors in early stage NSCLC: a verification study. Lung Cancer 75: 217–222. doi:10.1016/j.lungcan.2011.06.012PMID:21802763
23. Liu D, Huang Y, Chen B, Zeng J, Guo N, et al. (2011) Activation of mammalian target of rapamycin path-way confers adverse outcome in nonsmall cell lung carcinoma. Cancer 117: 3763–3773. doi:10.1002/ cncr.25959PMID:21387259
25. Zhang Y, Ni HJ, Cheng DY (2013) Prognostic Value of Phosphorylated mTOR/RPS6KB1 in Non-small Cell Lung Cancer. Asian Pacific Journal of Cancer Prevention 14: 3725–3728. PMID:23886172
26. Liu HB, Wu Y (2008) The expression of p-mammalian target of rapamycin in non-small cell lung cancer and its prognostic significance. Chin J Respir Crit Care Med 7: 354–357.
27. Yoshizawa A, Fukuoka J, Shimizu S, Shilo K, Franks TJ, et al. (2010) Overexpression of phospho-eIF4E is associated with survival through AKT pathway in non-small cell lung cancer. Clin Cancer Res 16: 240–248. doi:10.1158/1078-0432.CCR-09-0986PMID:20008839
28. Kitano H, Chung JY, Ylaya K, Conway C, Takikita M, et al. (2014) Profiling of AKT, Phospho-mTOR, Phospho-MAPK and EGFR in Non-small Cell Lung Cancer. J Histochem Cytochem 2014: 1551–5044.
29. Gold KA, Kim ES, Liu DD, Yuan P, Behrens C, et al. (2014) Prediction of survival in resected non-small cell lung cancer using a protein expression-based risk model: implications for personalized chemopre-vention and therapy. Clin Cancer Res 20: 1946–1954. doi:10.1158/1078-0432.CCR-13-1959PMID: 24366692
30. Shimizu K, Kaira K, Tomizawa Y, Sunaga N, Kawashima O, et al. (2014) ASC amino-acid transporter 2 (ASCT2) as a novel prognostic marker in non-small cell lung cancer. Br J Cancer 110: 2030–2039. doi: 10.1038/bjc.2014.88PMID:24603303
31. Zhou X, Tan M, Hawthorne VM, Klos KS, Lan KH, et al. (2004) Activation of the Akt Mammalian Target of Rapamycin 4E-BP1 Pathway by ErbB2 Overexpression Predicts Tumor Progression in Breast Can-cers. Clin Cancer Res 10: 6779–6788. PMID:15501954
32. Zhou L, Huang Y, Li J, Wang Z (2009) The mTOR pathway is associated with the poor prognosis of human hepatocellular carcinoma. Medical Oncology 27: 255–261. doi:10.1007/s12032-009-9201-4 PMID:19301157
33. Xiao L, Wang YC, Li WS, Du Y (2009) The role of mTOR and phospho-p70S6K in pathogenesis and progression of gastric carcinomas: an immunohistochemical study on tissue microarray. J Exp Clin Cancer Res 28: 152. doi:10.1186/1756-9966-28-152PMID:20003385
34. Thanyanan R, Sumithra JM, et al. (2012) Brief report: a phase II window-of-opportunity frontline study of the mTOR inhibitor, temsirolimus given as a single agent. J Thorac Oncol 7: 919–922. doi:10.1097/ JTO.0b013e31824de0d6PMID:22722792