115
FAGALES POLLEN IN THE ATMOSPHERE OF TIMIŞOARA,
ROMANIA (2000 2007)
Nicoleta IANOVICI1*, Marius Victor BIRSAN2, Dorina TUDORICĂ1, Alexandra BALIŢA1 1
West University of Timisoara, Faculty of Chemistry, Biology, Geography, Department of Biology and Chemistry, Pestalozzi, 16, 300115, Timisoara, Romania
2
National Meteorological Administration, Bucharest, Romania *Corresponding author e#mail:[email protected]
Received 18 November 2013; accepted 19 December 2013
ABSTRACT
This work presents the first aerobiological monitoring results for Fagales in the city of Timişoara (Romania) using a volumetric spore#trap (Lanzoni VPPS 2000) which is now the most commonly used aerobiologic measurement instrument in Europe. The aim of this study was to determine characteristics of Fagales pollen occurrence in outdoor environment of Timişoara by measuring daily pollen concentrations. The concept of the atmospheric pollen season was used. Sampling was carried out during 8 years, starting in 2000 until 2007. Fagales allergenic pollen appear in the area of Timişoara only from the end of January to the end of May. The data showed that during the early spring the atmospheric pollen season for these allergenic species is highly variable. There were considerable variations in start date, atmospheric pollen season, peak concentration, date of peak. The concentration of airborne Fagales pollen in Timişoara and the correlations with some meteorological parameters have been examined. Daily pollen concentrations presented negative correlation with daily average relative humidity, and slightly positive with wind speed using Spearman’s correlation coefficients. Fagales pollen concentrations represent important values in the atmosphere of Timişoara, which means they may to cause pollinosis in its population. The best#represented pollen type through the entire period was Betula.
KEY WORDS: aeroallergens, Fagales pollen, Betula, atmospheric pollen season
INTRODUCTION
Cronquist (1988) defined the Fagales as amentiferous members of the Hamamelidae. He circumscribed the taxon to include four families: Balanopaceae, Fagaceae, Nothofagaceae and Betulaceae; before his death he accepted a fifth family, the Ticodendraceae. Takhtajan (1997) places all of the above in his Faganae, adding the family Corylaceae and dividing the superorder into two units, the Fagales and the Corylales. Thorne (1992) basically agrees with Takhtajan but retains Corylaceae in the Betulaceae and uses the ordinal name, Betulales. The families currently included in Fagales are as follows: Betulaceae, Casuarinaceae, Fagaceae, Juglandaceae, Myricaceae, Nothofagaceae, Rhoipteleaceae, Ticodendraceae (Judd et al, 2007).
(Oei et al, 1986; Matthiesen et al, 1991; Śpiewak et al, 1996; Radišič et al, 2003; Piotrowska, 2004; Peternel et al, 2007; Ianovici, 2009a). Cross reactivity of Betulaceae pollen with both apple and hazelnut as well as other fruits was described (Molkhou, 2000). Corylus and Alnus areacting as primers of allergic sensitisation to Betulaceae pollen allergens, resulting in greater clinical symptoms during the Betula pollen season (Ianovici, 2008; Ianovici et al, 2009).
The allergenic capacity of Betulaceae pollen has been quoted by numerous authors (Norris:Hill & Emberlin, 1991; D'Amato & Spieksma, 1992; Aira et al, 1998; Corden et al, 2000; Clot, 2001; Laaidi, 2001; Radišić & Sikoparija, 2005). During the last years, the behavior of the Fagaceae pollen seasons and their fluctuation in the annual totals over several years has been studied (Corden & Millington, 1999; Jato et al, 2006; García:Mozo et al, 2002; Rizzi:Longo et al, 2005; Rodríguez de la Cruz et al, 2008). It has been pointed out that Betula pollen concentrations greater than 30 pollen grains/m3/day trigger severe symptoms, and values greater than 80 pollen grains/m3/day produce symptoms in 90% of patients (Corsico, 1993). According to clinical threshold standards number concentrations of more than 100 pollen grains /m3 cause strong allergic reactions (Viander & Koivikko, 1978). Corylus pollen gives allergic reaction at concentrations of 20:30 pollen grains/m3 and Alnus pollen at concentrations of 50 pollen grains/m3 (Spieksma & Frengueli, 1991; Vik et al, 1991). Rodriguez:Rajo et al (2003) reported a threshold value for Quercus of 50 pollen grains/m3 in Spain.
In the conditions of Timişoara the most important cause of pollinosis is allergenic pollen of some deciduous trees as well as grasses and weeds. The vegetation is in the region typical urban because of the introduction of ornamental plants and trees. Pollen grains of allergenic taxa occur in the outdoor environment of Timişoara in large quantities from early February until late October (Ianovici, 2007c; Ianovici et al, 2013). Pollen grains of trees were determined during the vernal pollen season in the atmosphere of our city: Alnus, Betula, Carpinus, Corylus, Fraxinus, Platanus,
Populus, Quercus, Taxaceae/Cupressaceae, Salix, Acer, Ulmus, Morus, Juglans
(Ianovici &Faur, 2003c; Ianovici & Faur, 2004). Fagales are abundant anemophilous plants in the metropolitan area of Timişoara. This analysis of the airborne pollen content concerned six taxa, whose pollen has allergenic properties and occurs in large quantities in the atmosphere of Timişoara: Alnus,Corylus, Betula, Carpinus, Quercus, Juglans. In Romania the genus Corylus is naturally represented by C. avellana L. and
C. colurna L., although C.maxima Mill. is frequently introduced as ornamental taxa. The Carpinus genus is represented by C. betulus L. and C. orientalis Mill. The
Quercus genus is represented in Romania by 10 tree species (Q. robur L., Q. frainetto
Ten., Q. petraea Liebl., Q. cerris L., Q. rubra L., Q. polycarpa Schur, Q. dalechampii
117
be found in Romania. The following species of the Alnus genera were present in our country: A. glutinosa (L.) Gaertn., A. incana (L.) Moench and A. viridis (Chaix) DC. The genus Juglans is represented by the three species: J. regia L., J. cinerea L.and J. nigra L. (Ciocârlan, 2009).
The aim of the present investigation was to study the Fagales pollen concentrations in the air of Timişoara and to explore their seasonal variations (2000: 2007). The relationships between pollen concentrations and nine meteorological parameters are presented too.
MATERIALS AND METHODS
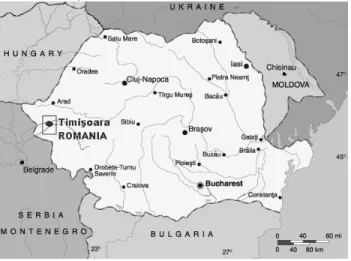
Timişoara is one of the most important administrative, cultural, academical and industrial centre from Romania (fig. 1). It is the capital of the Timiş County. On July (2007) Timisoara had a population of 307,347 inhabitants. Timişoara is a multicultural city, influenced by various ethnic communities (German, Hungarian, Serbian, Bulgarian, Italian, Greek and others). In recent years, Timisoara has seen significant growth, especially in high technology sectors. The city has a dense road network, with a total length of 582 km and one of the highest levels of motorisation in Romania (Nadolu et al, 2010).
Fig. 1 Location of Timişoara, Romania
forests. In last years, the popularity of Betula as ornamental plant grow up. In Timişoara there are over 100 ha of parks with exotic and rare species. The most common Fagales species in this area are Betula pendula, Corylus avellana, Alnus glutinosa, Carpinus betulus, Quercus robur and Juglans regia.
Founding at the interference of the eastern continental air mass with the wet air mass, oceanic, from the west, but also with the Mediterranean influences, the Banat Plain is characterized by the temperate continental climate with submediterranean influences, so that the precipitation and temperature regimes are superior to other plains areas from country. There is an increase tendency of annual average temperature (1958 year = 10.50C; 2006 year = 11.20C) and decrease annual average precipitation quantity (1873 year = 660 mm; 2006 year = 600 mm) (Rogobete et al, 2008). The average annual temperature is of 10.6°C while the hottest month of the year is July (22.42°C). Rainfall in Timişoara is concentrated mainly in the spring and autumn months. The cyclones and warm air masses influence from Adriatic Sea and Mediterranean Sea are felt especially during winter. During summer are periods with high temperatures. The precipitation regime has an irregularly character, with wetter years than the average followed by years with very few precipitations. Regarding the winds, the most frequent are N:W winds and the W winds. In spring, a high frequency have the S winds. The other directions present low frequencies. In Timiş County increased the aridity phenomenon which had installed in the last years and having as result frequent manifestation of drought (Hălbac:Cotoară, 2008; Ienciu et al, 2010).
119
The meteorological parameters taken into consideration in assessment of the effect of meteorological conditions on airborne pollen were as follows: mean daily average temperature (°C), maximum temperature (°C), minimum temperature (°C), quantities of precipitations in L/m2, daily average wind speed (m/s), daily maximum wind speed expressed in m/s, daily average relative humidity (%), atmospheric pressure in millibars and sunshine hours (h), as these factors have been known to influence pollination. All the meteorological data were provided by the National Meteorological Administration. The average values for temperatures and precipitations are included to see if there is an increasing or decreasing trend in the last years (fig.2). Average annual temperatures are weak decreasing during the period 2000:2007 (y=: 0.0902x + 11.921; R² = 0.0731). Sum annual precipitations increased (y=30.723x + 474.06; R² = 0.2665). Compared to the mean, the lowest precipitations were in 2000, when they recorded only 300 mm annually, which represents half of the multi:annual mean of the area. Timiş County was affected by floods in March–April 2006 and the most severely in April:May 2005, when a large surface of its territory was covered by waters.
The correlations between individual meteorological conditions and the Fagales pollen season were established by means of Spearman correlation coefficients. These correlations have been calculated for each taxon. The statistical relationship between spore concentration and meteorological factors was established using the Statistica software package. Spearman’s correlation test was performed in order to identify the major variables likely to influence the dynamic of the airborne pollen (table 3). The significance was calculated for P<0.05.
RESULTS
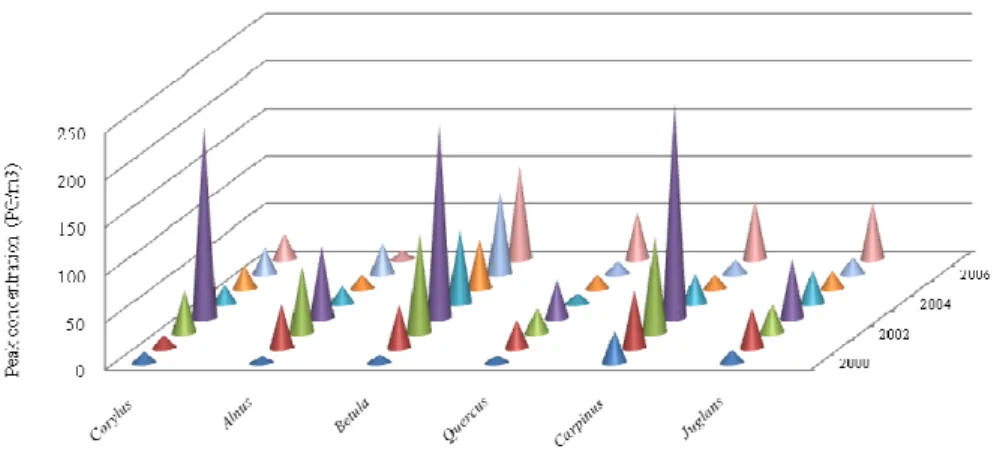
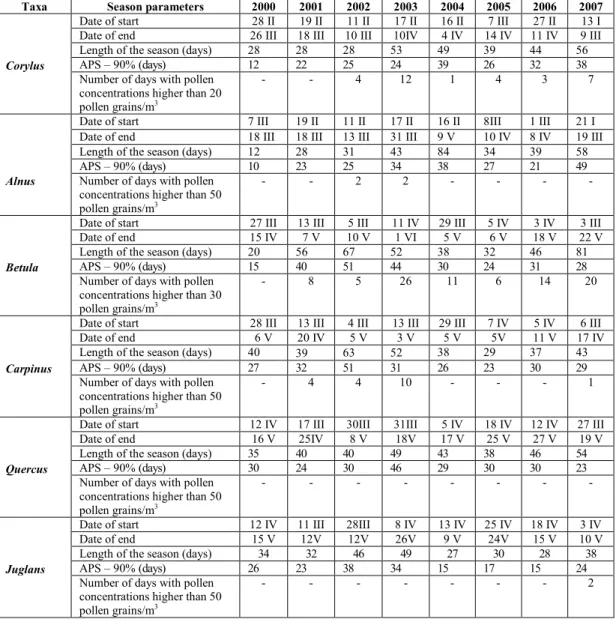
The results of Fagales pollen count at Timişoara for all years are shown in table 1 and table 2. This study describes fluctuations of annual pollen count and Atmospheric Pollen Season (fig. 3, 4). The relation between Fagales airborne pollen and meteorological variability was given in table 3.
CORYLUS. The duration of the APS ranged between 12 and 39 days. Eight
year average APS duration were 27.25 days. The longest APS was observed in the year 2004. In 2000 APS in Timişoara lasted a shorter time. In 2007, occurence of Corylus
airborne pollen was recorded with three weeks earlier than in all years (in January). This year was very atypical. In 2003:2006 a sporadic presence of pollen grains of
121
season fluctuated between 12:202 pollen grains/m3. Increasing trend in the annual totals is observed.
Spearman’s analysis revealed negative significant correlations of the pollen count with mean daily average temperature, maximum temperature, minimum temperature, relative humidity and sunshine hours. The results have shown that level of Corylus pollen is significant positive affected by mean wind speed daily and maximum wind speed.
ALNUS. Eight year average APS duration were 28.37 days (according to
Nilsson & Persson, 1981). The longest APS was observed in the year 2007. The beginning of Alnus pollination was observed in February (2001:2004), March (2000, 2005:2006) and January (2007). More than 90% of the total annual Alnus pollen was collected during February and March. In 2004 APS in Timişoara lasted until May and was exceptional because normally ends flowering in March or April. The peak concentration was 77 pollen grains/m3 (in 2003). The total pollen was relatively small, an average of 1.51%. The highest level of pollen emission was recorded during 2003 (636 pollen grains/m3). The mean annual pollen count obtained during the period studied was 327.8 pollen grains/m3.
In the case of Alnus pollen negative significant correlation coefficients were obtained with mean daily average temperature, maximum temperature, minimum temperature, relative humidity and sunshine hours. In relation to daily average wind speed and maximum wind speed, the correlation was significant and positive.
BETULA. The duration of the APS ranged between 15 and 51 days, and its
mean length was 32.875 days. The APS of birch trees was relatively long in all the years studied. In 2002, an exceptionally prolonged Betula pollen season was recorded in Timişoara. Its APS started with just a few days of difference between the 8 years under study. The Betula pollen season usually ended in May except for 2003 when finished their season in June and 2000 when finished in April. More than 90% of the total annual Betula pollen was collected during April. Betula contributes to the atmosphere with an average of 5.3% (range 0.48 – 9.86%) of the total pollen. The highest annual level was attained in 2003 with 2,436 pollen grains/m3. The mean annual pollen count obtained during the period studied was 1,007.875 pollen grains/m3. The peak count of each season fluctuated between 9:205 pollen grains/m3/day. Increasing trends in the annual totals is observed.
Negative significant correlations between the Betula pollen count and daily average relative humidity as well as atmospheric pressure were found. In the present study, we found a positive correlation between pollen count of this taxa and sunshine hours, daily average wind speed and maximum wind speed. Our study showed that the pollen release is insignificantly affected by the temperature.
CARPINUS. The beginning of pollination was observed at the same time in
while the longest took place in 2002 lasting 51 days. The months in which maximum pollen concentrations were recorded: March and April. The percentage participation for Carpinus pollen type constitutes between 0.91% and 6.25% of the annual total of pollen grains. The highest level of pollen emission was recorded during 2003 (1544 pollen grains/m3). The peak count of Carpinus tree pollen of about 228 pollen grains/m3 was observed in 2003.
A negative and statistically significant correlation was found between
Carpinus pollen concentrations and daily average relative humidity and atmospheric pressure. We found a positive correlation between pollen count of this taxa and daily average wind speed, maximum wind speed and sunshine hours.
QUERCUS. The duration of the APS ranged between 23 and 46 days, and its
mean length was 30.25 days. The start of pollen release by Quercus coincided with the end of the Betula. The pollen behavior of Quercus in Timişoara corresponds to that already described during the pollen season in Europe: in April and May. The sporadic presence of pollen grains of Quercus occurs to the ending of March. In western Romania the maximum concentrations of Quercus pollen never surpassed 49 pollen grains/m3 during the eight years of study. The share of the Quercus annual sum in respect to the total pollen counts was rather low, ranging from 0.47% in 2000 to 2.5% in 2007, with 1.19 % as mean value. The mean value of the annual sums was 209.25, with the highest total of 516 in 2007 and the lowest of 59 in 2000. The peak value appeared on 31 March 2003 (41 pollen grains/m3). Increasing trends in the annual totals is observed.
The most important agents influencing the Quercus pollen count are daily average relative humidity and atmospheric pressure. Correlations were positive and significant in a few number of cases, especially for temperature. We found a positive correlation with the daily average wind speed, maximum wind speed and sunshine hours.
JUGLANS. The starts of APS were fairly uniform at the second decade of
April, finishing in May. For Juglans, a very short APS was noted in 2004 and 2006 (15 days). A long pollen season was observed for Juglans in 2002 (38 days). Table 2 reflects its modest contribution to the atmospheric spectrum, a mean of 1.9% and a range of 0.8:2.83%, the lowest value being recorded in 2000 and the highest in 2003. The maximum daily values also differ from year to year, being only 14 pollen grains/m3 in 2000, but 63 pollen grains/m3 in 2003. The highest annual pollen count of
Juglans measured in 2003 (592 pollen grains/m3). Increasing trends in the annual totals is observed.
123
Fig. 3 Annual pollen count values during the years studied
Table 1. Selected values characterizing Fagales pollen seasons in Timişoara during 2000 2007
Taxa Season parameters 2000 2001 2002 2003 2004 2005 2006 2007
Corylus
Date of start 28 II 19 II 11 II 17 II 16 II 7 III 27 II 13 I Date of end 26 III 18 III 10 III 10IV 4 IV 14 IV 11 IV 9 III
Length of the season (days) 28 28 28 53 49 39 44 56
APS – 90% (days) 12 22 25 24 39 26 32 38
Number of days with pollen concentrations higher than 20 pollen grains/m3
: : 4 12 1 4 3 7
Alnus
Date of start 7 III 19 II 11 II 17 II 16 II 8III 1 III 21 I Date of end 18 III 18 III 13 III 31 III 9 V 10 IV 8 IV 19 III
Length of the season (days) 12 28 31 43 84 34 39 58
APS – 90% (days) 10 23 25 34 38 27 21 49
Number of days with pollen concentrations higher than 50 pollen grains/m3
: : 2 2 : : : :
Betula
Date of start 27 III 13 III 5 III 11 IV 29 III 5 IV 3 IV 3 III
Date of end 15 IV 7 V 10 V 1 VI 5 V 6 V 18 V 22 V
Length of the season (days) 20 56 67 52 38 32 46 81
APS – 90% (days) 15 40 51 44 30 24 31 28
Number of days with pollen concentrations higher than 30 pollen grains/m3
: 8 5 26 11 6 14 20
Carpinus
Date of start 28 III 13 III 4 III 13 III 29 III 7 IV 5 IV 6 III
Date of end 6 V 20 IV 5 V 3 V 5 V 5V 11 V 17 IV
Length of the season (days) 40 39 63 52 38 29 37 43
APS – 90% (days) 27 32 51 31 26 23 30 29
Number of days with pollen concentrations higher than 50 pollen grains/m3
: 4 4 10 : : : 1
Quercus
Date of start 12 IV 17 III 30III 31III 5 IV 18 IV 12 IV 27 III
Date of end 16 V 25IV 8 V 18V 17 V 25 V 27 V 19 V
Length of the season (days) 35 40 40 49 43 38 46 54
APS – 90% (days) 30 24 30 46 29 30 30 23
Number of days with pollen concentrations higher than 50 pollen grains/m3
: : : : : : : :
Juglans
Date of start 12 IV 11 III 28III 8 IV 13 IV 25 IV 18 IV 3 IV
Date of end 15 V 12V 12V 26V 9 V 24V 15 V 10 V
Length of the season (days) 34 32 46 49 27 30 28 38
APS – 90% (days) 26 23 38 34 15 17 15 24
Number of days with pollen concentrations higher than 50 pollen grains/m3
: : : : : : : 2
125
only 2 occasions in 2002 and 2003. In Timişoara, the Carpinus pollen count was ≥50 pollen grains/m3 on 10 occasions in 2003.
Fagalesairpollenconstitutes between 5.46% and 25.13% of the annual total of pollen grains. Pollen counts show that there is great variation among years in the flowering of Fagales in westhern Romania. The maximum value of these trees was recorded in 2003 with 6,485 pollen grains/m3. The cumulative counts varied over the years, with a mean value of 2,836.25 pollen grains/m3, a lowest total of 704 in 2000. The highest values appeared in the year 2003 for all taxa (except at Quercus). Betula
was found to disseminate the highest pollen amounts. The percentage of the annual sum of these taxa in respect to total pollen count may be considered as relevant in Timişoara. A weak tendency to increase in the annual totals are observed (fig.3).
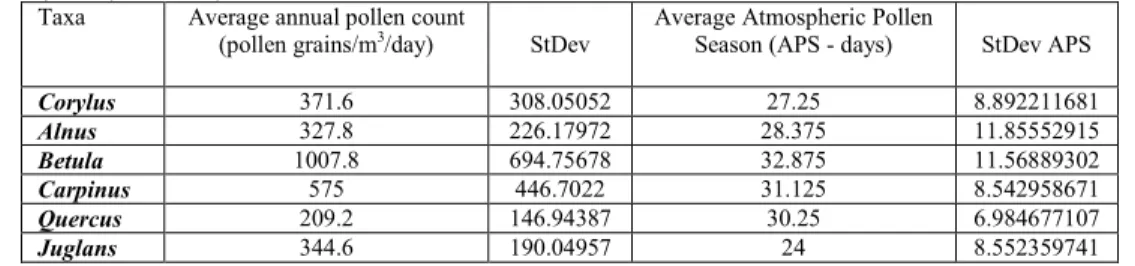
Table 2. Characteristics of the Fagales atmospheric pollen season and seasonal pollen index in the atmosphere of Timişoara (2000 2007)
Taxa Average annual pollen count
(pollen grains/m3/day) StDev Average Atmospheric Pollen Season (APS : days) StDev APS
Corylus 371.6 308.05052 27.25 8.892211681
Alnus 327.8 226.17972 28.375 11.85552915
Betula 1007.8 694.75678 32.875 11.56889302
Carpinus 575 446.7022 31.125 8.542958671
Quercus 209.2 146.94387 30.25 6.984677107
Juglans 344.6 190.04957 24 8.552359741
DISCUSSIONS
The Fagales order is very important from different points of view, such as the ecological, forestry, or economical. The relationship between airborne Fagales pollen behavior and climate also is of great interest for aerobiology and forestry sciences. Aeropalinological studies providing data on exposure of people to allergens in the air are of substantial importance in pollen allergy diagnosis (Rapiejko et al, 2004). These are the main source of aeroallergens from trees in springtime (D’Amato, 2001).
The beginning of Fagales pollination was observed at the same time in all the years: February for Alnus and Corylus, March for Betula, Quercus and Carpinus, April for Juglans.The flowering of Corylus marks the beginning of the botanical early spring season in Timişoara. Alnus is the second airborne pollen types of the season. The start of pollen season of Corylus and Alnus was registered earlier in 2007 (January). More than 70% of Betulaceae pollen was collected in March and April. However, Frostad (1991) has noticed that, in recent years, with favourable weather conditions, Alnus and
Corylus have started releasing pollen in January (Frostad, 1991). Because Fagales pollen emission is a springtime phenomenon, pollen season dynamics are sensitive to changes in phenology (García:Mozo et al, 2006; Jabłońska & Rapiejko, 2010).
The behaviour of Fagales was irregular, with pollen concentrations fluctuating between the years 2000:2007. The season ends more gradually than it starts. Extensive fluctuations in flowering are characteristic of trees belonging to the Betulaceae family (Curran & Leighton, 2000). No cyclic variations were observed. A two year cycle in which a low annual birch pollen sum is followed by a high one has been reported by many authors (El:Ghazaly et al, 1993; Spieksma et al, 2003). The cause of this biennial rhythm and its synchronicity over large areas is not clear. However, some authors suggest that it is physiological factors that are mostly involved: the high pollen production usually results in high fruit production, which takes a lot energy, inhibiting the development of new flowers and pollen for the next year. The high fruit production also inhibits other processes, for example the vegetative growth of the tree (Latałowa
et al, 2002).
During the 8:year period (2000:2007), pollen of the representatives of the order Fagales accounted for an important proportion of total pollen, predominated by
Betula pollen and a considerably lower proportion of Alnus sp., Carpinus sp.,Corylus
sp., Quercus sp. and Juglans sp. pollen. Liniar trends in elevated annual Fagales pollen counts may be influenced by impacts of urbanization (the supplementary planting of ornamental species, soil nutrification, habitat fragmentation, disturbance, and the urban heat island effect) (Yli:Panula et al, 2009). The size of the residential areas around town is an important influence on Fagales pollen levels. In Timişoara there is a much greater area of parks and gardens. The city trend to extend its influence on the surrounds (under the perspective of the future metropolitan area) and on new and very consistent residential neighbourhoods are developed in all the closest villages. Analysis of long:term birch pollen data from several European stations has revealed a weak trend of increasing annual totals (Spieksma et al, 2003). Such trends were also found for Denmark in a study of the period 1977–2000 (Rasmussen, 2002). Changes in vegetative cover in big cities result from anthropogenic activity (Menzel, 2000).
127
provoking the symptoms of allergic reaction ranged from 5:26 for Betula. We emphasize that skin prick tests conducted in Southern Hungary (approximately 150 km from Timişoara region) showed a significant increase of patients with seasonal rhinitis, that are allergic to Betula pollen (Kadocsa & Juhász, 2002). In Europe, the percentage of subjects with a positivity skin prick test to Betula allergens range from 5% in The Netherlands to 54% in Switzerland (D'Amato et al, 2007).
Weather parameters are known to affect the dispersion dynamics of particles of biological origin. The release and dispersion of pollen depend on the microclimate, which explains the differences in the timing of flowering and occurrence of pollen in the air within the same species (Kasprzyk et al, 2004; Silva Palacios et al, 2007; Puc, 2012). Especially sensitive to air temperature are the plants who starts early in spring. In relation to temperature, the correlation was significant and negative in the cases of
Alnus and Corylus pollen. Veriankaitė et al (2011) had conducted the correlation of many years of Alnus and Corylus pollen concentration in atmosphere and air temperature that has not proved this regularity. The negative correlation coefficient describing the relation between the Alnus and Corylus pollen concentration and temperature may suggest that a dose of thermal energy, required for the anthers to open, had been accumulated by the plants in the period prior to the pollen season (Stach et al, 2008). The correlation with temperature was negative in the whole:season analysis. Different authors have pointed out the influence of temperature on pollination (Frenguelli et al, 1991; González Parrado et al, 2009; Emberlin et al, 2007; Myszkowska et al, 2010; Kaszewski et al, 2008). In other study, regression analysis showed that rainfall and temperature (particularly maximum temperature) were the most important variables in Mediterranean areas, while both maximum and minimum temperatures prior to flowering were the most important parameter in Eurosiberian areas (Spieksma et al, 1989).
In the present work, Betula, Carpinus, Quercus and Juglans pollen concentrations not presented a clear positive correlation with temperature. Piotrowska and Kaszewski (2011) found higher correlation coefficients when the pre: and post: peak periods were separated. In the pre:peak period, Betula pollen concentration was positively correlated with air temperature, while it was negatively correlated with humidity and cloud cover. In the postpeak period, a negative correlation was found between birch pollen concentration and minimum air temperature, rainfall and humidity.
highlighted by several authors as factors of great importance in the onset of Betula
pollination (Andersen, 1991). This parameter should be studied more carefully.
The daily average relative humidity showed negative correlations with all this taxa. Other researches revealed statistically reliable negative correlation coefficient of the concentration of pollen of almost all plants genera identified during the monitoring and relative air humidity. The negative influence of relative humidity on airborne pollen dispersion is a global finding in aeropalynological studies (Skjøth et al, 2009; Estrella et al, 2006).
While in some cases, daily pollen counts show significant negative correlations with atmospheric pressure and precipitation, in other case no correlation was found. The effect of atmospheric pressure and quantities of precipitations on Fagales pollen concentrations may differ from year to year because of extremes in other variables.
The positive sign or no significant correlation with wind speed, may indicate that the captured pollen is from sources of pollen far away of the sampling site. The positive correlation between Fagales pollen counts and the maximum wind speed indicates that these pollen types present in the air above Timisoara can be the result of long:distance transport. The level of significance showed that relative humidity and wind might influence the levels of pollen in this botanical order.
Analyses of aeroallergens in Timisoara have been made since 1999. The results set out here are a good indication of the behavior of Fagales pollen captured in the outdoor environment of Timişoara through the year, and over the years. Since 2002, pollen concentrations in Timişoara have been much higher, probably due to the increase in the number of trees planted in the city. The changes in the floral composition of a given area have a direct influence on its airborne pollen spectrum. In comparison to the content of pollen of other plants in the aeroplankton of Timisoara, the pollen of Fagales ranks first among trees, while it is second after Ambrosia if the pollen of all plant taxa is taken into account (Faur et al, 2001; Faur et al, 2003a; Faur
et al, 2003b; Ianovici, 2011; Ianovici, 2007a).This assertation is based on 8 years of observations. The need of a further study to improve present data appeared to be important.
CONCLUSION
129
15.16% of the total pollen count. Correlation analysis with weather parameters demonstrated that the relative humidity and wind are the main factors influencing the daily pollen concentrations in the atmosphere. The greatest annual count, daily pollen concentrations and number of days when the Betula pollen was captured in the air was observed in 2003.
Quantitative differences in annual totals of Fagales pollen concentrations in Timişoara between the years are relatively small. Corylus, Alnus, Betula, Carpinus,
Quercus and Juglans pollen concentrations represent important values in the atmosphere of Timişoara, which means they may to cause pollinosis in its population.
Betula pollen is an important aeroallergen in our area. The contribution of this work lies in its potential informations to public health surveillance and clinical guidance.
ACKNOWLEDGMENTS
This work was partially funded by the research project PREVALERG “Optimization of prevention methods in order to increase efficiency in managing the allergic patient”, granted by the Romanian Ministry of Education, Research and Inno: vation (041:011/2007) and project “Aerobiological analysis of air quality through volumetric monitorization of aeroplankton and aspects concerning the impact of invasive and allergenic plants on the biodiversity of urban environments” financed by the City Hall of Timisoara.
REFERENCES
Aira MJ, Jato V, Iglesias I. 1998. Alnus and Betula pollen content in the atmosphere of Santiago de Compostela, North:Western Spain (1993:1995). Aerobiologia. 14: 135:140.
Andersen TB. 1991. A model to predict the beginning of the pollen season. Grana. 30: 269:275. Ciocârlan V. 2009. Flora ilustrată a României. Pteridophyta et Spermatophyta. Ed. Ceres, Bucureşti.
Clot B. 2001.Airborne birch pollen in Neuchâtel (Switzerland): onset, peak and daily patterns. Aerobiologia. 17: 25–29.
Corden J, Millington W, Bailey J, Brookes M, Caulton E, Emberlin J, Mullins J, Simpson C, Wood A. 2000. UK regional variations in Betula pollen (1993–1997). Aerobiologia. 16:227–232.
Corden J, Millington W. 1999. A study of Quercus pollen in the Derby area, UK. Aerobiologia. 15: 29–37. Corsico R. 1993. L‘asthme allergique en Europe. In:F.T.M. Spieksma, N. Nolard, G.Frenguelli & D.Van Moerbeke (Eds), Pollens de l`air en Europe UCB. Braine : l’Alleud.
Cronquist A. 1988.The evolution and classification of flowering plants. 2ed. NewYork: The New York Botanical Garden Press.
Curran LM, Leighton M. 2000. Vertebrate responses to spatiotemporal variation in seed production of mast: fruiting Dipterocarpaceae. Ecol. Monogr. 70: 101–128.
D’Amato G. 2001. Allergenic pollen. In G. D’Amato, S. Bonini, J. Bousquet, S. R. Durham, & T. A. E. Platts: Mills (Eds.), Pollenosis 2000. Global approach. Naples: JGC Editions. pp. 69–76.
Dalen G, Voorhorst R. 1981. High correlation of cross reactivity on skin testing between Alnus, Betula, Corylus, Fagus, Quercus pollen extracts; allergen community in pollen from certain tree species. Annals of Allergy. 46: 276–278.
D'Amato G, Cecchi L, Bonini S, Nunes C, Annesi:Maesano I, Behrendt H, Liccardi G, Popov T, van Cauwenberge P. 2007. Allergenic pollen and pollen allergy in Europe, Allergy. DOI: 10.1111/j.1398: 9995.2007.01393.x.
El:Ghazaly G, El:Ghazaly PK, Larsson KA, Nilsson S. 1993. Comparison of airborne pollen grains in Huddinge and Stockholm, Sweden. Aerobiologia. 9: 53:67.
Emberlin J, Smith M, Close R, Adams:Groom B. 2007. Changes in the pollen seasons of the early flowering trees Alnus spp. and Corylus spp. in Worcester, United Kingdom, 1996–2005. Int J Biometeorol 51 (3): 181:191. Estrella N, Menzel A, Krämer U, Behrendt H. 2006. Integration of flowering dates in phenology and pollen counts in aerobiology: analysis of their spatial and temporal coherence in Germany (1992–1999). Int J Biometeorol 51 (1): 49:59.
Faur A,Ianovici N,Mincea M. 2001.Monitoring of allergenic pollen (Fagales) in Timişoara for the year 2000.
Annals of West University of Timişoara, series of Biology. 3:4: 15:20.
Faur A,Ianovici N,Sinitean A. 2003a. Airbiological study on the Hamamelidae (Amentiferae) pollen in the West Plain. Annals of West University of Timişoara, series of Biology. 5:6: 1:10.
Faur A,Ianovici N,Sinitean A. 2003b. Phenoecology studies on some anemophile ligneous Magnoliatae from Timişoara. Annals of West University of Timişoara, series of Biology. 5:6: 17:24.
Frenguelli G, Spieksma FTM, Bricchi E, Romano B, Mincigrucci G, Nikkels AH, Dankaart W, Ferranti F. 1991. The influence of air temperature on the starting dates of the pollen season of Alnus and Populus. Grana. 30: 196: 200.
Frostad AB. 1991. Allergenic pollen and pollinosis in Norway. In: G., D’Amato, F.T.M., Spieksma & S. Bonini (Eds), Allergenic Pollen and Pollinosis in Europe. Blackwell Sci Publ, Oxford. pp. 182:183.
García:Mozo H, Galán C, Aira MJ, Belmonte J, Díaz de la Guardia C, Fernández D, Gutierrez AM, Rodríguez FJ, Trigo MM, Domínguez:Vilches E. 2002. Modelling start of oak pollen season in different climatic zones in Spain.
Agricultural and Forest Meteorology. 110: 247–257.
García:Mozo H, Galán C, Jato V, Belmonte J, Díaz de la Guardia C, Fernández D, Gutiérrez M, Aira MJ, Roure JM, Ruiz L, Trigo MM, Domínguez:Vilches E. 2006. Quercus pollen season dynamics in the Iberian Peninsula: response to meteorological parameters and possible consequences of climate change. Ann Agric Environ Med. 13: 209–224.
González Parrado Z, Valencia Barrera RM, Fuertes Rodríguez CR, Vega Maray AM, Pérez Romero R, Fraile R, Fernández González D. 2009. Alternative statistical methods for interpreting airborne Alder (Alnus glutinosa (L.) Gaertner) pollen concentrations, Int J Biometeorol. 53 (1): 1:9.
Hălbac:Cotoară R. 2008. Romania’s western part (Timiş County) between humidity excess and water scarcity. The future of drainage arrangements and wet areas. Water Observation and Information System for Balkan Countries, 1:14.
Hjelmroos M. 1992. Long:distance transport of Betula pollen grains and allergic symptoms. Aerobiologia. 8: 231: 236.
Ianovici N, Faur A. 2003. Monitoring the allergenic pollen from the airplancton in 2000. Annals of West University of Timişoara, series of Biology. 5:6: 197:206.
Ianovici N,Faur A. 2004. Quantitative and qualitative study of the atmospheric pollen in 2001. Annals of West University of Timişoara, series of Biology. 7: 35:44.
Ianovici N, Juhasz M, Kofol:Seliger A, Sikoparija B. 2009. Comparative analysis of some vernal pollen concentrations in Timişoara (Romania), Szeged (Hungary), Novi Sad (Serbia) and Ljubljana (Slovenia).Notulae Botanicae Horti Agrobotanici Cluj#Napoca. 37: 49:56.
Ianovici N,Panaitescu Bunu C, Brudiu I. 2013. Analysis of airborne allergenic pollen spectrum for 2009 in Timişoara, Romania. Aerobiologia. 29 (1): 95:111.
Ianovici N.2008.The analysis of daily concentrations of airborne pollen in the West and Southwest of Romania.
Scientific Annals of ‘‘Alexandru Ioan Cuza’’ University of Iasi. (New Series), Section 2. Vegetal Biology. LIV ( 2), 73:78.
Ianovici N.2007a.Aeropalynologic analysis of Timişoara (România) during 2006 year. Analele Universităţii din Oradea, Fascicula Biologie. XIV: 96:100.
Ianovici N. 2009a. Analysis of pollen counts of Betulaceae in Timişoara, 2001–2004. Journal of Horticulture, Forestry and Biotechnology. 13: 94:99.
Ianovici N.2011. Approaches on the invasive alien taxa in Romania : Ambrosia artemisiifolia (ragweed) II,
Annals of West University of Timişoara, series of Biology. 14: 93:112.
131
Ianovici N. 2007c.; The principal airborne and allergenic pollen species in Timişoara. Annals of West University of Timişoara, series of Biology. 10:11:26.
Ienciu A, Oncia S, Peptan C, Fazakas P. 2010. Assesing drought risk in Timisoara during the last decade.
Research Journal of Agricultural Science. 42 (3): 623:628.
Jabłońska K, Rapiejko P. 2010. Using the results of a nationwide phenological network to examine the impact of changes in phenology of plant species on the concentration of plant pollen in the air.ACTA AGROBOTANICA. 63 (2): 69–74.
Jato V, Rodríguez:Rajo FJ, Alcázar P, De Nuntiis P, Galán C, Mandrioli P. 2006. May the definition of pollen season influence aerobiological results? Aerobiologia. 22: 13–25.
Jato V, Rodríguez:Rajo FJ, Méndez J, Aira MJ. Phenological behaviour of Quercus in Ourense (NW Spain) and its relationship with the atmospheric pollen season. International Journal of Biometeorology. 2002; 46: 176–184. Johansen S. 1992. Aerobiological studies in subalpine birch forest at Dovrefjell, Central Norway, 1982:1984.
Grana. 31: 131:142.
Judd WS, Campbell CS, Kellogg EA, Stevens PF, Donoghue MJ. 2007.Plant Systematics: A Phylogenetic Approach. Third Edition, Sinauer Associates, Inc.
Kadocsa E, Juhász M. 2002. Study of airborne pollen composition and allergen spectrum of hay fever patients in South Hungary (1990–1999). Aerobiologia. 18: 203–209.
Kasprzyk I, Uruska A, Szcepanek K, Latałowa M, Gaweł J, Harmata K, Myszkowska D, Stach A, Stępalska D. 2004. Regional differentiation in the dynamics of the pollen seasons of Alnus, Corylus and Fraxinus in Poland (Preliminary results). Aerobiologia. 20: 141:151.
Kaszewski BM, Pidek IA, Piotrowska K, Weryszko:Chmielewska E. 2008. Annual pollen sums of Alnus in Lublin and Roztocze in the years 2001:2007 against selected meteorological parameters. ACTA AGROBOTANICA. 61 (2): 57–64.
Kizilpinar I, Civelek E, Tuncer A, Dogan C, Karabulut E, Sahiner UM, Yavuz ST, Sackesen C. 2010. Pollen counts and their relationship to meteorological factors in Ankara, Turkey during 2005–2008. Int J Biometeorol. DOI 10.1007/s00484:010:0363:8.
Laaidi M. 2001. Regional variations in the pollen season of Betula in Burgundy: two models for predicting the start of the pollination. Aerobiologia. 17: 247–254.
Latałowa M, Mietus M, Uruska A. 2002. Seasonal variations in the atmospheric Betula pollen count in Gdansk (southern Baltic coast) in relation to meteorological parameters. Aerobiologia. 18: 33:43.
Matthiesen F, Ipsen H, Løwenstein H. Pollen allergens. 1991. In: G. D’Amato, F.Th.M., Spieksma & S. Bonini (eds), Allergenic Pollen and Pollinosis in Europe. Blackwell Scientific Publications pp.36–44.
Menzel A. 2000. Trends in phonological phases in Europe between 1951–1996. Int J Biometeorol. 44: 76–81. Molkhou P. 2000.Food Allergies. Present and future problems. UCB Institute of Allergy.
Myszkowska D, Jenner B, Puc M, Stach A, Nowak M, Malkiewicz M, Chłopek K, Uruska A, Rapiejko P, Majkowska:Wojciechowska B, Weryszko:Chmielewska E, Piotrowska K, Kasprzyk I. 2010. Spatial variations in the dynamics of the Alnus and Corylus pollen seasons in Poland. Aerobiologia. 26 (3): 209:221. Nadolu B, Dinca M, Luches D. 2010. Urban shrinkage in Timisoara, Romania,Research report, Shrink Smart WP2#D4. 48 pp
Nilsson S, Person S. 1981. Tree pollen spectra in the Stockholm region (Sweden), 1973:1980. Grana. 20: 179: 182.
Norris:Hill J, Emberlin J. 1991. Diurnal variation of pollen concentration in the air of north:central London.
Grana. 30: 229:34.
Oei HD, Spieksma FTM, Bruynzeel LB. 1986. Birch pollen asthma in The Netherlands. Allergy. 41: 435–441. Peternel R, Milanović SM, Hrga I, Mileta T, Čulig J. 2007. Incidence of Betulaceae pollen and pollinosis in Zagreb, Croatia, 2002:2005. Ann Agric Environ Med. 14: 87:91.
Piotrowska K, Kaszewski BM. 2011.Variations in birch pollen (Betula spp.) seasons in Lublin and correlations with meteorological factors in the period 2001:2010. A preliminary study. ACTA AGROBOTANICA. 64 (2): 39– 50.
Piotrowska K. 2004. Comparison of Alnus, Corylus and Betula pollen counts in Lublin (Poland) and Skien (Norway). Ann Agric Environ Med. 11: 205:208.
Radisič P, Sikoparija B, Juhasz M, Ianovici N. 2004. Corylus airborne pollen in Danube:Kris:Mures:Tisa Euroregion. Central European Journal of Occupational and Environmental Medicine. 10: 35:40.
Radišič P, Sikoparija B, Juhász M, Ianovici N. 2003. Betula pollen season in the Danube – Kris – Mures – Tisa Euroregion (2000:2002). Annals of Faculty Engineering Hunedoara – Journal of Engineering. I (2): 197:200. Radišić P, Sǐkoparija B. 2005. Betula spp. pollen in the atmosphere of Novi Sad (2000–2002). Aerobiologia. 21: 63–67.
Rapiejko P, Lipiec A, Wojdas A, Jurkiewicz D. 2004. Threshold pollen concentration necessary to evoke allergic symptoms. Int. Rev. of Allergology Clin. Immunol. 10: 91:94.
Rasmussen A. 2002. The effects of climate change on the birch pollen season in Denmark. Aerobiologia. 18: 253– 265.
Rizzi:Longo L, Pizzulin:Sauli M, Ganis P. 2005. Aerobiology of Fagaceae pollen in Trieste (NE Italy).
Aerobiologia. 21: 217–231.
Rodríguez de la Cruz D, Sánchez Reyes E, Sánchez Sánchez J. 2008. Aerobiological study of Fagaceae pollen in the middle:west of Spain. Aerobiologia. 24: 67–76.
Rodriguez:Rajo F, Frenguelli G, Jato V. 2003.The influence of air temperature on the starting date of Quercus
pollination in the South of Europe. Grana. 42: 145:152.
Rogobete Gh, Grozav A, Adam I. 2008. Forest:belt in the Banat Plain for environmental protection. XXIVth Conference of the danubian countries on the hydrological forecasting and hydrological bases of water management, Bled, Slovenia, 2 – 4 June.
Silva Palacios I, Tormo Molina R, Munoz Rodriguez AF. 2007. The importance of interactions between meteorological conditions when interpreting their effect on the dispersal for pollen from homogeneously distributed sources. Aerobiologia. 23: 17:26.
Skjøth CA, Smith M, Brandt J, Emberlin J. 2009. Are the birch trees in Southern England a source of Betula pollen for North London?. Int J Biometeorol. 53 (1): 75:86.
Spieksma FTM, Corden JM, Detandt M, Millington WM, Nikkels H, Nolard N, Schoenmakers C, Wachter R, de Weger LA, Willems R, Emberlin J. 2003. Quantitative trends in annual totals of five common airborne pollen types (Betula, Quercus, Poaceae, Urtica and Artemisia), at five pollen:monitoring stations in western Europe.
Aerobiologia. 19: 171–184.
Spieksma FTM, Frengueli G. 1991. Allergenic significance of Alnus (Adler) pollen. In:G.D‘Amato, F.T.M. Spieksma & S. Bonini (Eds), Allergenic Pollen and Pollinosis in Europe, Blackwell Sci Publ, Oxford pp. 85:87. Spieksma FTM, Frenguelli G, Nikkels AH, Mincigrucci G, Smithuis LOMJ, Bricchi E, Dankaart W, Romano B. 1989. Comparative study of airborne pollen concentrations in central Italy and The Netherlands (1982 – 1985).
Grana. 28: 25:36.
Śpiewak R, Krysińska:Traczyk E, Sitkowska J, Dutkiewicz J. 1996. Microflora of allergenic pollen – a preliminary study. Ann Agric Environ Med. 3: 127:130.
Stach A, Emberlin J, Smith M, Adams:Groom B, Myszkowska D. 2008. Factors that determine the severity of
Betula spp. pollen seasons in Poland (Poznań and Krakow) and the United Kingdom (Worcester and London). Int J Biometeorol. 52: 311:321.
Takhtajan A. 1997. Diversity and Classification of Flowering Plants. Columbia University Press, New York Thorne RF. 1992. An updated phylogenetic classification of flowering plants. Aliso. 13: 365–389.
Vázquez LM, Galán C, Domìnguez:Vilches E. 2003. Influence of meteorological parameters on Olea pollen concentrations in Córdoba (South:western Spain). Int J Biometeorol. 48: 83–90.
Veriankaitė L, Šaulienė I, Bukantis A. 2011. Evaluation of meteorological parameters influence upon pollen spread in the atmosphere. Journal of Environmental Engineering and Landscape Management. 19 (1): 5:11. Viander M, Koivikko A. 1978. The seasonal symptoms of hyposensitized and untreated hay fever patients in relation to birch pollen counts: Correlations with nasal sensitivity, prick tests and RAST. Clinical Allergy. 8: 387– 396.
Vik H, Florvaag E, Elsayed S. 1991. Allergenic significance of Betula (birch) pollen. In: G. D’Amato, F.T.M. Spieksma & S. Bonini (Eds), Allergenic Pollen and Pollinosis in Europe Blackwell Sci Publ, Oxford. pp.36:44. Weryszko:Chmielewska E, Puc M, Piotrowska K. 2006. Effect of meteorological factors on Betula, Fraxinus and
Quercus pollen concentrations in the atmosphere of Lublin and Szczecin, Poland. Ann Agric Environ Med. 13: 243:249.
! ! " "# $%#%$ # $ !& #$ ! $ & "$ !$& %
& "$ #% " %%& $ ! %&"% !#%#% # # ! $ # $
! $ !! !$& &%% $ !%%$ %$&& "& %# % % #
$&$!$ !$$ $ $ $ &"$! $! $ $! !" " % %"
!& !&$" % "$&!$ %$&% !$ & "#$&$ #"$$ %#$
!& ! $ & "!!#! $&$! "$ "# $ "& &$# $ "%
!& ! ! $ !# % $ " # &! $$ $! & % ! &$ $
!&"! ! #% !$$ &%%"% #%!" &"& & & #"&$ & #
" $ !#$ $%"! $#!"! " % $ !#$ ! !$& $ &! &
" ! $# " $ ! #%%$ "$ " ! ! " # # %!
$%! !&!$& % !! $$ $& & "& "&% % # $! " !%
& %#% $%& & ! "% $%$%% % $# ! $ ! ### &!&"#
# # !! $" !& !!! !$ " # %! &$ $&# $
& $% &% # &" % "& " $&$ $ "$ !%!" & !#!
$ "$ & % ! $## "!&!!$ & ! &# & % "%
#% $ %%%! $ "% " # " $%$#% # % $#%#$ ""$#$
#!% "$ %$& ## #& " " $ % !"$ % " %% $ !"!
"! % $ # " $ !&$"# $ # #% %! $!"& "!! %
"
&!% &$ # $ $! !! !# $# # " &# & ### $"
!#!!# "!"# " $ "" # " # % #! #!##! $ "% #
!#&" !!# % $#% %!" " !&$ !$ %# &!&$ " $
"!$## " # #!%& "$# !!%$ ! %## %% !! & # &% $$
%
&% % % & & " %" " ! % %$$ !$$" $ "$
$$ ! "! ! %%! "&% ! " # % !& ! "!
&" $ ## $ !" $ &$ ! $" % "& $ &%%% %&$$
! % $%&% % $ "% # ! # &#" "$ # &&
"%" & %$ #"" % $ % ! % $ $" $" $$ $&
%% ! &# # # % "#"% $ !!$ %$ "! " # "
%& %$"!" & #" $" ! !!$ "& # $ & $ $ "&
"&!&# " # #""%! # !& & # & %% !!%!% & %
& &$ $ $ $ # &!! % %# % # "% $!# & &# "
!&&&& !# !& "" # " $#$ #"# $!$ $$& # & !
!
$ # $ $" % &% &$ $$ % % &" "#&# %# & #%$!# " #
& # %&$ #&"& % % # & $ %!$%! " $#" % & ! !
! % # %&&# "#$ ##$! !!"%" %!& ! %# $!#&% $% $
& %! $&!# & "# ! " "#& % $ ! &!&! $$&"! $$&
& $ & $# $!# "% ! & % "$ " % %%
%&%!! " " # ##% " " # " % " " $!& &
$
$ % ! %" % & #!! %& %& $% & &&$ "$" %& % %" %
" " & "%""%% "" && $ ! %"! $ #! #"# #%#&% ! #
% $" #" !%$ # !"& % "" " # $#!"$ ! "!#%" & #
&"" & %##$ # " & # % %# $ "$ &% % & $# ### !
!&#% & %& %&!# % & " & $ "" % !& $ #"% &!#&