Mediterranean Apex Predators
Luis Cardona, Irene A´ lvarez de Quevedo*, Assumpcio´ Borrell, Alex Aguilar
IRBIO and Department of Animal Biology, Faculty of Biology, University of Barcelona, Barcelona, Spain
Abstract
Stable isotopes of carbon and nitrogen were used to test the hypothesis that stomach content analysis has systematically overlooked the consumption of gelatinous zooplankton by pelagic mesopredators and apex predators. The results strongly supported a major role of gelatinous plankton in the diet of bluefin tuna (Thunnus thynnus), little tunny (Euthynnus alletteratus), spearfish (Tetrapturus belone) and swordfish (Xiphias gladius). Loggerhead sea turtles (Caretta caretta) in the oceanic stage and ocean sunfish (Mola mola) also primarily relied on gelatinous zooplankton. In contrast, stable isotope ratios ruled out any relevant consumption of gelatinous plankton by bluefish (Pomatomus saltatrix), blue shark (Prionace glauca), leerfish (Lichia amia), bonito (Sarda sarda), striped dolphin (Stenella caerueloalba) and loggerhead sea turtles (Caretta caretta) in the neritic stage, all of which primarily relied on fish and squid. Fin whales (Balaenoptera physalus) were confirmed as crustacean consumers. The ratios of stable isotopes in albacore (Thunnus alalunga), amberjack (Seriola dumerili), blue butterfish (Stromaeus fiatola), bullet tuna (Auxis rochei), dolphinfish (Coryphaena hyppurus), horse mackerel (Trachurus trachurus), mackerel (Scomber scombrus) and pompano (Trachinotus ovatus) were consistent with mixed diets revealed by stomach content analysis, including nekton and crustaceans, but the consumption of gelatinous plankton could not be ruled out completely. In conclusion, the jellyvorous guild in the Mediterranean integrates two specialists (ocean sunfish and loggerhead sea turtles in the oceanic stage) and several opportunists (bluefin tuna, little tunny, spearfish, swordfish and, perhaps, blue butterfish), most of them with shrinking populations due to overfishing.
Citation:Cardona L, A´lvarez de Quevedo I, Borrell A, Aguilar A (2012) Massive Consumption of Gelatinous Plankton by Mediterranean Apex Predators. PLoS ONE 7(3): e31329. doi:10.1371/journal.pone.0031329
Editor:Yan Ropert-Coudert, Institut Pluridisciplinaire Hubert Curien, France ReceivedJune 20, 2011;AcceptedJanuary 6, 2012;PublishedMarch 21, 2012
Copyright:ß2012 Cardona et al. This is an open-access article distributed under the terms of the Creative Commons Attribution License, which permits unrestricted use, distribution, and reproduction in any medium, provided the original author and source are credited.
Funding:This project was partially funded by the Plan Nacional de I+D+i of the Ministry of Science and Innovation of Spain (project CGL2009-10017) and by the Institut Menorquı´ d’Estudis: http://www.ime.cat/. The economic costs of publication of this article have been funded by the University of Barcelona. The funders had no role in study design, data collection and analysis, decision to publish, or preparation of the manuscript.
Competing Interests:The authors have declared that no competing interests exist. * E-mail: [email protected]
Introduction
An interest in gelatinous plankton has developed over the past decades after a long period of neglect by marine biologists [1]. The driver of this change is the widespread perception that the abundance of medusa and ctenophores is increasing in many oceanic basins [2,3,4] and the concern about the potential negative impact of these phenomena on commercially important fisheries [2] and the tourism industry [5].
Avian and Rottini-Sandrini (1988) [6] and Harbison (1993) [7] were the first to propose that a large number of pelagic predators may opportunistically consume gelatinous zooplankton and suggested that overfishing would release salps, ctenophores and medusa from tight predator control. The proliferation of gelatinous plankton in several heavily fished regions might be considered to support such a hypothesis, but available evidence indicates that competitive release, and not the relaxation of top-down control, is the most likely mechanism [8,9,10]. As a consequence, overfishing of gelatinous plankton consumers is presented in recent reviews as a plausible hypothesis but with little direct supporting evidence [4,5].
Central to the top-down relaxation hypothesis is the hypothet-ical existence of a large community of pelagic predators that may opportunistically consume gelatinous plankton, thereby stabilizing their populations [6,7]. Although there is increasing evidence that
many pelagic fish may occasionally consume gelatinous plankton [11], and some ecosystem models include tuna and billfish as major consumers of gelatinous plankton [12], it is a big leap from an occasional-consumption model to the strong top-down control assumed by the top-down relaxation hypothesis. Furthermore, nothing is known about the actual significance of gelatinous plankton in the diet of most pelagic mesopredators and apex predators, and there is hard evidence for massive consumption of gelatinous plankton only for some fishes [7,13,14] and pelagic sea turtles [15].
Massive proliferations of gelatinous plankton in the Mediterra-nean have raised considerable public interest [6,16–19]) because of their potential impact on the tourism industry. Outbreaks in the region are known to be tightly linked to climatic variability [16,20,21], and those of the pink jellyfish (Pelagia noctiluca) have been recorded for almost two centuries. Nevertheless, predator release due to overfishing has been repeatedly suggested as a potential factor in the jellyfish proliferations in the region [6,10,18,19,22].
into the Mediterranean from Atlantic nesting beaches (Caretta caretta) and those of swordfish (Xiphias gladius) and bluefin tuna (Thunnus thynnus) of the eastern Atlantic stock spawning into the Mediterranean have undergone relevant declines over the past few decades [34–36]. This scenario would support the top-down relaxation hypothesis, although gelatinous plankton always occur in very low numbers in the stomach contents of Mediterranean predators. Whether this is because of their fragility and difficulty of identification [11] or whether it reveals that the dietary significance is truly minor remains unknown. This paper aims to answer this question through stable isotope analysis, as the ratios of stable isotopes in gelatinous zooplankton are different from those
of other potential prey [37–39] and previous studies have demonstrated the utility of this method for assessing the dietary relevance of gelatinous zooplankton in the diet of marine vertebrates [25].
Materials and Methods
Ethics
All of the species sampled were caught for purposes other than research, except jellyfishes, salps, hyperiidean amphipods and euphausiids. No specific approval is required in Spain to undertake research on samples supplied by official channels and coming from
Table 1.Sample size and stable isotope ratios of pelagic prey and predators in the western Mediterranean Sea.
Species Common name n d13 C d15 N
mean ±SD mean ±SD
Prey
Copepoda Copepods A 222.3 1.0 2.8 0.5
Cotylorhiza tuberculata Fried egg jellyfish 5 217.4 0.2 1.6 0.3
Engraulis encrasicolus European anchovy 5 218.5 0.6 9.8 0.8
Hyperiidae Hyperideans A 219.0 1.2 5.6 0.5
Lampanyctus crocodilus Jewel lanternfish 5 218.6 0.2 10.2 0.4
Loligo vulgaris European common squid 5 217.7 0.5 9.5 0.9
Meganyctiphanes Krill A 220.8 0.7 5.2 0.4
Pelagia noctiluca Pink jellyfish 5 217.8 0.6 5.6 0.5
Sardina pilchardus European pilchard 5 218.0 0.2 8.7 0.2
Salpa maxima Salp 5 219.7 0.6 3.9 0.3
Todarodes sagittatus European flying squid 5 217.8 0.1 11.0 0.1
Predators
Auxis rochei Bullet tuna 5 218.1 0.3 9.5 0.5
Balaenoptera physalus Fin whale 5 218.4 0.1 8.7 0.1
Caretta caretta(neritic stage) Loggerhead sea turtle 5 216.3 0.4 10.1 1.7
Caretta caretta(pelagic stage) Loggerhead sea turtle 5 217.6 0.2 6.7 0.4
Coryphaena hippurus Dolphinfish 5 218.3 0.3 9.8 0.7
Euthynnus alletteratus Little tunny 5 217.2 0.1 10.4 0.4
Lichia amia Leerfish 5 217.1 0.3 13.1 1.0
Mola mola Sunfish 5 217.6 0.5 7.7 0.4
Pomatomus saltatrix Bluefish 5 216.9 0.3 14.8 0.4
Prionace glauca Blue shark 5 217.2 0.7 13.3 0.4
Sarda sarda Atlantic bonito 5 216.8 0.3 12.8 1.2
Scomber scombrus* Mackerel 5 218.5 0.9 11.4 0.4
Seriola dumerili Amberjack 5 217.7 0.2 11.3 0.6
Stenella caeruleoalba Striped dolphin 5 217.3 0.4 12.1 0.8
Stromateus fiatola Blue butterfish 4 217.3 0.3 10.8 0.2
Tetrapturus belone Spearfish 5 217.8 0.4 10.1 0.7
Thunnus alalunga Albacore 5 217.8 0.4 11.0 0.4
Thunnus thynnus.100 cm Bluefin tuna 5 218.3 0.3 10.3 0.6
Thunnus thynnus,100 cm Bluefin tuna 5 217.7 0.4 10.6 0.3
Trachinotus ovatus Pompano 5 217.5 0.4 11.2 0.3
Trachurus trachurus* Horse mackerel 5 217.6 0.2 10.5 0.5
Xiphias gladius.100 cm Swordfish 5 217.8 0.3 11.4 0.4
Xiphias gladius,50 cm Swordfish 5 217.8 0.7 11.2 0.2
by-catch of commercial fishing vessels. Loggerhead turtles, fin whales and bottlenose dolphins are protected by Spanish laws and hence samples were collected by the Marine Animals Recovery Center (CRAM), the organism officially designated by the Catalonian regional government to collect stranded marine animals, undertake necropsies and distribute samples among research groups.
Study site and sample collection
Samples were collected from 2006 to 2007 in the northwestern Mediterranean, between the Iberian Peninsula and the Balearic islands. The area has supported very dense populations of gelatinous plankton since 2003, with pink jellyfish (Pelagia noctiluca) being present year round. Pelagic mesopredators (blue butterfish (Stromateus fiatola), bullet tuna (Auxis rochei), horse mackerel (Trachurus trachurus), mackerel (Scomber scombrus) and pompano (Trachinotus ovatus)) and apex predators (albacore (Thunnus alalunga), amberjack (Seriola dumerili), bluefin tuna (Thunnus thynnus), bluefish (Pomatomus saltatrix), blue shark (Prionace glauca), bonito (Sarda sarda), dolphinfish (Coryphaena hippurus), fin whale (Balaenoptera physalus), leerfish (Lichia amia), little tunny (Euthynnus alletteratus), loggerhead sea turtles (Caretta caretta), striped dolphin (Stenella caeruleoalba), swordfish (Xiphias gladius) and spearfish (Tetrapturus belone)) were captured by commercial fishing vessels operating in the area, and tissue samples of these species were collected by observers aboard. Fin whales and striped dolphins were the only exception, as dead, stranded individuals were sampled.
Potential prey were also sampled from the catch of commercial vessels operating in the same area (anchovy (Engraulis encrasicolus), horse mackerel (Trachurus trachurus), lanternfish (Lampanyctus crocodilus), longfin squid (Loligo vulgaris), mackerel (Scomber scombrus), sardine (Sardina pilchardus) and shortfin squid (Todarodes sagittatus)), whereas gelatinous plankton (fried egg jellyfish (Cotylorhiza tuberculata), pink jellyfish (Pelagia noctiluca) and salps (Salpa maxima)) and hyperiidean amphipods were collected with a dip net during the fishing operations. Euphausiids (Meganyctiphanes norvegica) were
collected from the stomach contents of bullet tuna, and a plankton-net was used to collect copepods.
White dorsolateral muscle was sampled from all fish, as well as mantle from the cephalopods and carapace scutes from loggerhead sea turtles. Gelatinous plankton and crustaceans were fully homogenized. All of the species had a sample size of 5, except for blue butterfish, and copepod, hyperiidean and krill samples were collective. Samples were stored at220uC prior to analysis.
Stable isotope analysis
Once thawed, tissues were dried at 60uC and ground to a fine powder, and their lipids were then extracted with a chloroform/ methanol (2:1) solution. Crustacean samples were split in two subsamples. One of them was treated with O.5 N ClH to remove the inorganic carbonates of the skeleton and avoid any bias in the d13C. However, acidification may modify the relative concentra-tion of N isotopes, so the other subsample was used to determine thed15
N value. All of the samples were weighed into tin cups, combusted at 1,000uC, and analyzed in a Flash 1112 IRMS Delta C Series EA Thermo Finnigan continuous flow isotope ratio mass spectrometer. A Carlo Erba Flash 112 elemental analyzer coupled to the isotope ratio mass spectrometer was used to measure the % C and % N of the dry weight. Stable isotope abundances were expressed indnotation according to the following expression:
dX~((Rsample=Rstandard)-1)x1,000
where X was 13C or 15N and Rsample and Rstandard were the corresponding ratio13C/12C or15N/14N of the sample and the standard. The standards for13C and 15N were Vienna Pee Dee Belemnite (VPDB) and atmospheric nitrogen (air), respectively. International isotope secondary standards for carbon (IAEA CH6 (d13
C =210.4%), USGS 24 (d13
C =216.1%), IAEA CH7 (d13C =231.8%)) were used to a precision of 0.2%, and for nitrogen (IAEA NO3(d15N =+4.7%), IAEA N2(d15N =+20.3%), IAEA N1(d15N =+0.4%)) to a precision of 0.3%.
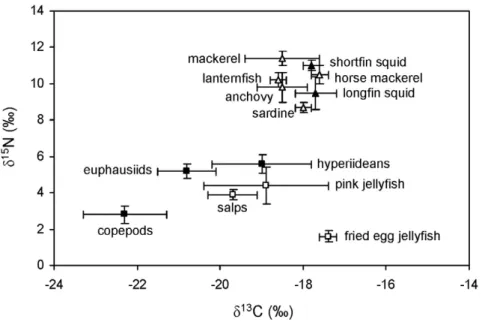
Figure 1. Stable isotope ratios in the potential prey of apex predators from the northwestern Mediterranean. Potential prey considered: pelagic crustaceans (solid squares), gelatinous plankton (empty squares), squid (solid triangles) and small pelagic and mesopelagic fish (empty triangles). Error bars show standard deviation.
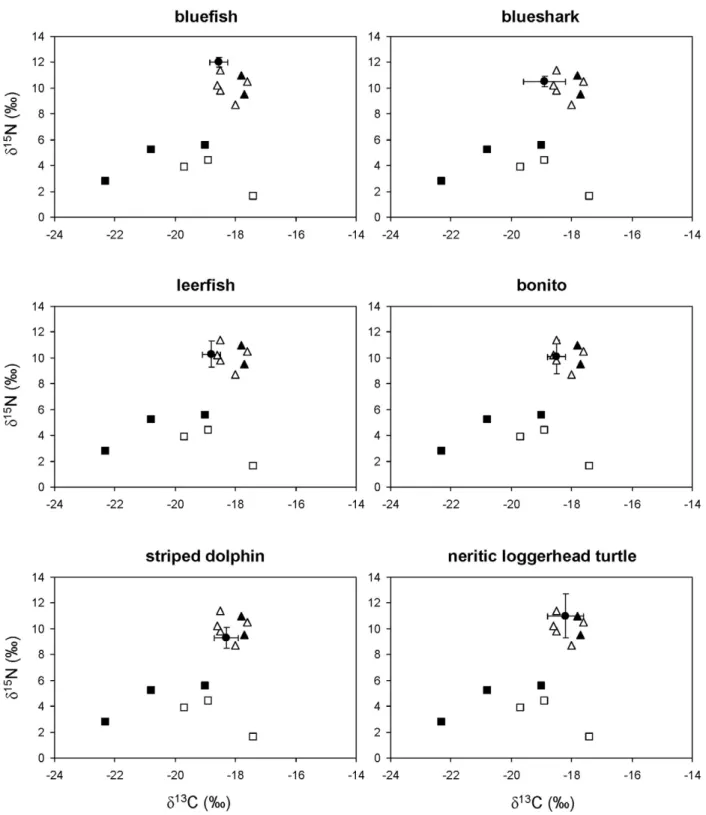
Figure 2. Stable isotope ratios of bluefish, blueshark, leerfish, bonito, striped dolphins and neritic loggerhead sea turtles from the northwestern Mediterranean.Solid circles represent the average stable isotope ratios of each consumer after correcting for diet-tissue isotopic discrimination and error bars show standard deviation. Other symbols show the average stable isotope ratios of potential prey: pelagic crustaceans (solid squares), gelatinous plankton (empty squares), squid (solid triangles) and small pelagic and mesopelagic fish (empty triangles).
Energy density
The proximate chemical composition of pink jellyfish, salps, mackerels and longfin squids was assessed to determine energy density. Once thawed, samples were weighed and dried at 100uC until a constant weight was reached. The moisture content was calculated by gravimetric difference between wet and dry mass [40]. Dry samples were homogenized and a subsample burnt for six hours in a muffle furnace at 600uC for ash determination [41]. A second subsample was processed to determine its nitrogen content by means of an elemental analyzer, a value that was later multiplied by a conversion factor of 5.8 to obtain the relative abundance of proteins in the dry material [42,43]. A third subsample was processed to determine its lipid content. Lipids were extracted with a chloroform/methanol (2:1) solution [44] and their content was determined by the gravimetric difference between fat and non-fat dry mass. Protein and lipid contents were converted to energy density using the mean combustion equivalents reported by [43], i.e., 23.9 kJ g21
and 39.5 kJ g21 respectively. Carbohydrate content was not measured, as is low in
fishes and jellyfishes and has a practically negligible contribution to their energy density [40]. In the case of salps, tunica is though to have a low digestibility for vertebrates [45].
Data analysis
ANOVA and a Tukey post-hoc test, conducted with the PASW 17 software package, were used to test differences in the concentrations of stable isotopes of potential prey. As SIAR requires that the variability associated with sources is normally distributed [45], normality was assessed for each group using Lilliefors test.
The Bayesian mixing model SIAR (Stable Isotope Analysis in R) [46] was used to calculate the relative contribution of the potential preys to the diet of each focal species. Bayesian approaches allow for the incorporation of not only isotopic values, elemental concentrations and diet-tissue isotopic discrimination factors within the mixing models but also the uncertainties involved in all these values, and so provide results that are expected to be considerably more robust when it comes to quantifying feeding
Table 2.Relative importance of gelatinous plankton in the diet of pelagic mesopredators and apex predators from the Mediterranean Sea, as revealed by stomach content analysis.
Species Common name Diet References
Auxis rochei Bullet tuna F,C,E,H,(U),(Cn) Mostarda et al. 2007 [23]
Balaenoptera physalus Fin whale E Laran et al. 2010 [55]
Caretta caretta Loggerhead turtle F,C,(U) Toma´s et al. 2001 [24]
Revelles et al. 2007 [25]
Coryphaena hippurus Dolphinfish F,D,H,C,(Cn) Massutı´ et al. 1998 [26]
Euthynnus alletteratus Little tunny F,C Kyrtatos 1982 [56]
Falautano et al. 2007 [67]
Lichia amia Leerfish F Bennett 1989* [57]
Pomatomus saltatrix Bluefish F,C Buckel et al. 1999* [60]
Prionace glauca Blue shark C,Ct,F Henderson et al. 2001* [61]
Sarda sarda Atlantic bonito F,(U) Kyrtatos 1982 [56]
Campo et al. 2006 [27]
Scomber scombrus Mackerel F,E,H Kyrtatos 1982 [56]
Seriola dumerili Amberjack F,C,E Matallanas et al. 1995 [69]
Stenella caeruleoalba Striped dolphin C, F Blanco et al. 1995 [58]
Meotti and Podesta`1997 [59]
O¨zturk et al. 2007 [62]
Tetrapturus belone Spearfish F,C,(U),(Cn) Castriota et al. 2008 [28]
Romeo et al. 2009 [31]
Thunnus alalunga Albacore F,H,E,C,U,(Cn) Consoli et al. 2008 [29]
Thunnus thynnus Bluefin tuna F,C,D Morovic 1961 [63]
Kyrtatos 1982 [56]
Orsi Relini et al. 1995 [66]
Sanz Brau 1990 [64]
Sinopoli et al. 2004 [30]
Trachurus trachurus Horse mackerel E, F Ben Salem 1988 [68]
Xiphias gladius Swordfish F, C,(U),(Cn) Chalabi and Ifrene 1992 [65]
Orsi Relini et al. 1995 [66]
Romeo et al. 2009 [31]
The diet column reports the preys contributing at least 5% in weight or volume to stomach contents (F: Teleostei; D: Decapoda, H: Hyperiidea, E: Euphausiids; C: Cephalopoda, Cn: Cnidaria, Ct: Cetaceans; U: Urochordata). Consumption of cnidarians and urochordata representing less than 5% is reported in brackets. *: data from the Atlantic.
preferences when compared with those in previous modeling approaches [46–48]. Furthermore, as the resulting posterior distributions of the proportions of various sources within the diet of a consumer have associated probabilities, it is possible to use the most likely solution as a single metric for a given dietary component in subsequent analyses [47,48].
The model parameters were the following: the isotope ratios and the elemental concentrations of the potential food sources, the isotope ratio of tissue and the trophic shift, or isotopic enrichment, for carbon and nitrogen from prey to predator. Prey-to-predator isotopic enrichment for fishes, mammals and loggerhead sea turtles were taken from Reich et al. (2008) [49] and Caut et al. (2009) [50]. Published data on stomach contents were used to identify potential preys other than gelatinous plankton.
Although SIAR incorporates uncertainty about diet-tissue isotopic discrimination factors in the form of standard deviation, we conducted a sensitivity analysis running SIAR for bluefin tuna with diet-tissue isotopic discrimination factors ranging from 1.1 to 2.3%ford13
C and from 2.2 to 3.4%andd15 N.
Data are usually shown as mean6standard deviation (SD), but the feasible contribution of potential prey species to the diet is reported as the mean and 95% credibility interval.
Results
Table 1 summarizes the sample size and stable isotope ratios of all the species analyzed. Figure 1 shows the pelagic isoscape of the northwestern Mediterranean. Differences in thed13
C andd15 N of the potential prey were statistically significant (ANOVA; d13
C: F12,52= 26.577, p,0.001;d15N: F12,52= 224.311, p,0.001). Nine groups of potential prey differing in the concentration of at least one stable isotope existed, on the basis of Tukey post-hoc tests: fried egg jellyfish, pink jellyfish, salps, copepods, euphausiids, hyperiideans, sardine, other small pelagic fish and squid (anchovy, horse mackerel, lanternfish and longfin squid) and midsize pelagic fish and squid (mackerel and shortfin squid). Data were normally distributed within all the groups and hence these groups were later
used for running SIAR, although thed13C of copepods and fried egg jellyfish were so distinct from those of the focal species (see below) that they were no longer considered as potential prey.
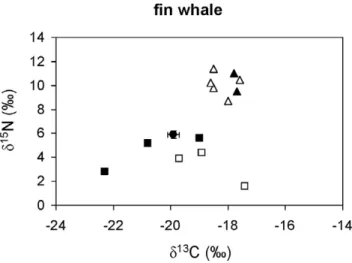
The ratios of stable isotopes in bluefish, blue shark, leerfish, bonito, striped dolphins and neritic loggerhead sea turtles (Figure 2) were consistent with the fish- and squid-dominated diet suggested by stomach content analysis (Table 2). Likewise, the ratio of stable isotopes in fin whales (Figure 3) was consistent with a crustacean-based diet (Table 2), although euphausiids were unlikely to be the only crustaceans consumed.
In contrast, the ratios of stable isotopes in bluefin tuna, little tunny, spearfish and swordfish (Figure 4) were inconsistent with the fish- and squid-based diet suggested by stomach content analysis (Table 2). On the contrary, SIAR suggested a major role for gelatinous zooplankton in the diet of these four species (Figure 5), although there was a high uncertainty about the relative contribution of salps and pink jellyfish. It should be kept in mind that any esteem of the actual contribution of gelatinous zooplankton to the diet of these species could be affected by the uncertainty about the actual diet-tissue fractionation factors. Accordingly, the sensitivity analysis revealed that the mean contribution of salps to the diet of bluefin tuna larger than 100 cm could range from 30% to 58% and that of pink jellyfish from 29% to 31%, depending on the diet-tissue fractionation factors introduced into the model. Similar results were forum for bluefin tuna smaller than 100 cm. The ratios of stable isotopes in ocean sunfish and loggerhead sea turtles in the oceanic stage were also consistent with a jellyvorous diet, a result confirmed by SIAR (Figure 6).
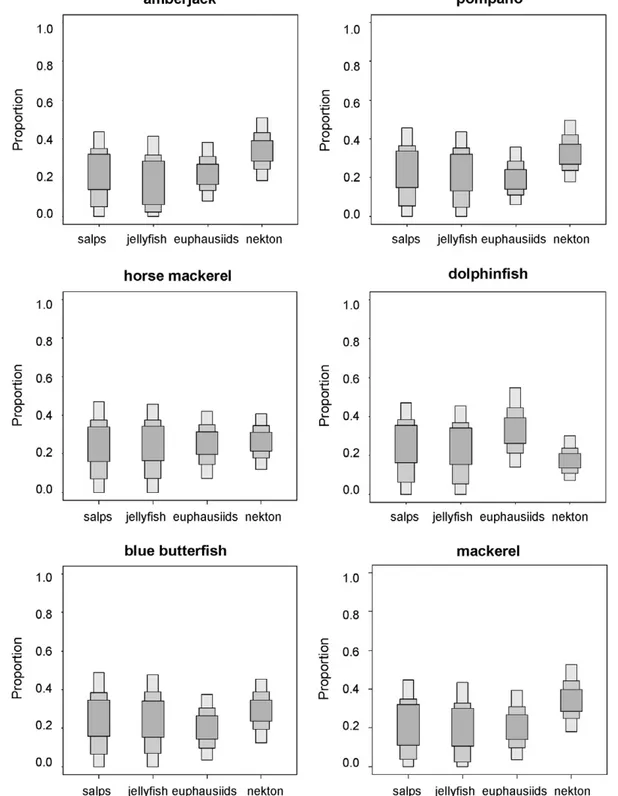
The concentration of stable isotopes in the remaining species suggested diets with varying combinations of fishes, cephalopods and crustaceans (Figures 7 and 8), consistent with the results of stomach content analysis (Table 2). Nevertheless, SIAR was ambiguous about the relevance of salps and pink jellyfish in the diets of these species because, although the feasible contributions were similar to those of crustaceans, the credibility intervals were extremely loose (Figures 8 and 9).
The proximate chemical composition and energy density of the considered potential prey are shown in table 3. As expected, the energy density of mackerel was much higher that that of longfin squid, with in turn was higher than that of pink jellyfish and salps.
Discussion
The use of stable isotopes for dietary studies relies on three major assumptions. First, that isotope fractionation from prey to predator is known. Fractionation is species and stage specific and controlled experiments in captivity are the best method to calculate diet-tissue isotopic discrimination factors. This type of experimental data were available only for the loggerhead sea turtle [49], so for other fishes and mammals this study used previously reported average diet-tissue isotopic discrimination factors [50]. The sensitivity analysis revealed that the global contribution of gelatinous zooplankton to the diet was only slightly affected by the diet-tissue isotopic discrimination factors entered into the model, although the actual partitioning between salps and pink jellyfish was more sensitive.
The second assumption is that the variability in the ratios of stable isotopes of the potential prey is not obscured by migration between contrasting isoscapes. The western Mediterranean and the adjoining Atlantic differ in their isotopic baselines [51], and at least bluefin tuna and bullet tuna migrate annually between the two basins, moving into the Mediterranean in spring for spawning [34,52]. However, the turnover of stable isotopes in the muscle of Figure 3. Stable isotope ratios of fin whales from the
northwestern Mediterranean.A solid circle represents the average stable isotope ratios of whales after correcting for diet-tissue isotopic discrimination and error bars show standard deviation. Other symbols show the average stable isotope ratios of potential prey: pelagic crustaceans (solid squares), gelatinous plankton (empty squares), squid (solid triangles) and small pelagic and mesopelagic fish (empty triangles).
warm water fish is fast enough to capture changes in the stable isotope ratios of the diet in just a few months [38,53,54]. As the samples for the present study were collected from July to September, the stable isotope ratios reported here should reflect feeding in the Mediterranean. On the other hand, as isotope ratios in muscle integrate the diet over several months [38,53,54], the result here reported reflect dietary preferences over that time window and are not affected by short pulses of high food availability.
The third major assumption is that differences in the concentration of stable isotopes in the potential prey are large enough to allow proper discrimination among potential prey.
Although statistically significant differences existed between all the species of macrozooplankton considered in the present study, there was considerable overlap in their ranges, as was also true for nekton. As a consequence, the performance of SIAR in resolving diet breakup within those two groups was often poor. However, for several species, the results were unambiguous when the ratios of stable isotope were combined with published information about stomach contents.
On this ground, seven of the species considered here are unlikely to consume relevant amounts of gelatinous plankton: bluefish, blue shark, bonito, fin whales, leerfish, loggerhead sea Figure 4. Stable isotope ratios of bluefin tuna, little tunny, spearfish, and swordfish from the northwestern Mediterranean.Solid circles represent the average stable isotope ratios of each consumer after correcting for diet-tissue isotopic discrimination and error bars show standard deviation. Other symbols show the average stable isotope ratios of potential prey: pelagic crustaceans (solid squares), gelatinous plankton (empty squares), squid (solid triangles) and small pelagic and mesopelagic fish (empty triangles).
turtles (in the neritic stage) and striped dolphins. Although detailed studies on the stomach contents of Mediterranean fin whales are missing, these cetaceans are thought to rely primarily on crustaceans [55], a hypothesis supported by the ratios of stable isotopes reported here. Fish and squid dominate the stomach contents of bluefish, blue shark, leerfish and striped dolphins
[24,27,56–62], although low numbers of salps have been reported from the stomach contents of bonito [27] and neritic loggerhead sea turtles [24]. Nevertheless, the concentrations of stable isotopes in all of these species were highly consistent with a nektonic diet, and no doubt exists that gelatinous plankton play no relevant role in their diets.
Figure 5. Feasible contribution of potential prey to the diet of bluefin tuna, little tunny, spearfish and swordfish according to SIAR. Nekton 1: sardine. Nekton 2: anchovy, lanternfish, horse mackerel and longfin squid. Nekton 3: mackerel and shortfin squid. Results are shown as 95, 75 and 25% credibility intervals for each prey.
Fish and squid also dominate the stomach contents of bluefin tuna, little tunny, swordfish and spearfish [28,30,31,56,63–67], but all of these species are highly depleted in15N when compared with the fish and cephalopod consumers reported above and with their potential prey. Estrada et al. (2005) [53] reported a similar depletion for tuna in the northwestern Atlantic and attributed it to the overlooked consumption of some other type of unidentified zooplankton. The d15
N of decapods is close to that of zooplanktophagous fish [38,54], and hence, their consumption cannot cause the depletion of15N reported here. Euphausiids and hyperiideans are more depleted in15N than fish (this study), but there is no reason for them to be overlooked in dietary studies, as they have been found in large numbers in the stomach contents of other species (Table 2). Thus, gelatinous plankton is the most likely source of15N depleted food for bluefin tuna, little tunny, swordfish and spearfish and, according to SIAR, represents a significant fraction of their diets.
Albacore, mackerel, bullet tuna, dolphinfish, amberjack and horse mackerel also consume fishes and squids, but crustaceans are relatively abundant in their stomach contents (Table 2), which
may explain why they are more depleted in15N than pure nekton consumers. Nevertheless, the consumption of gelatinous plankton cannot be completely ruled out, as salps and jellyfishes occur in low numbers in the stomach contents of at least some of these species (Table 2). The diet of the blue butterfish has not been investigated in detail in the Mediterranean, but the blue butterfish is thought to consume fishes, crustaceans and jellyfishes elsewhere [41]. The inspection of the stomach contents of the individuals collected for this study revealed fish remnants mixed with a purplish paste reminiscent of pink jellyfish tissue, although the d15
N values were too high to be indicative of a diet based on gelatinous plankton.
Finally, stable isotopes confirmed the reliance of oceanic loggerhead sea turtles and ocean sunfish on gelatinous plankton. The differences in the ratios of stable isotopes of oceanic and neritic loggerhead sea turtles reported here are consistent with the satellite telemetry data reported by Cardona et al. (2009) [70], revealing the existence of two well-delineated groups of loggerhead sea turtles off mainland Spain with contrasting patterns of habitat use. This explains the dramatic differences Figure 6. Stable isotope ratios of oceanic loggerhead sea turtle and ocean sunfish from the northwestern Mediterranean and feasible contribution of potential prey to their diet according to SIAR.Solid circles represent the average stable isotope ratios of each consumer after correcting for diet-tissue isotopic discrimination and error bars show standard deviation. Other symbols show the average stable isotope ratios of potential prey: pelagic crustaceans (solid squares), gelatinous plankton (empty squares), squid (solid triangles) and small pelagic and mesopelagic fish (empty triangles). Nekton: anchovy, lanternfish, horse mackerel and shortfin squid. Results are shown as 95, 75 and 25% credibility intervals for each prey.
observed in the isotope ratios of the loggerhead sea turtles captured on-shore and off-shore mainland Spain. The situation is completely different off the Balearic Islands, where true neritic turtles do not exist [71,72], and no major differences have been observed in the isotope ratios of turtles captured over the continental shelf and off-shore [39].
by these species is energetically possible, considering the low energy density of gelatinous plankton (Table 3), the large body mass of most of the gelatinous consumers and their food consumption rates [73–76].
The daily ration of captive bluefin tuna fed with fishes and squids ranges from 4.3% to 1.5% body mass, depending on tuna size [76]. Assuming that the energy density of a mixed diet including fishes and squids is 6.8 kJ g21(Table 3), the individual daily energy intake of a small bluefin tuna (15 kg) is 4,386 kJ and that of a large bluefin tuna (100 kg) is 20,400 kJ. According to SIAR, gelatinous zooplankton may represent as much as 80% of the diet of small bluefin tuna and 60% of that of large bluefin tuna. To meet these proportions, a small bluefin tuna (15 kg) should eat daily 0.13 kg of fishes and squids and 8.5 kg of gelatinous zooplankton with an energy content of 3,509 kJ, equivalent to 270 pink jellyfish (Table 3). Likewise, a large bluefin tuna (100 kg) should eat daily 0.60 kg of fishes and squids and 14.2 kg of gelatinous zooplankton with an energy content of 6,120 kJ, equivalent to 474 pink jellyfish (Table 3). However, SIAR results have wide credibility intervals, so is possible that the consumption of gelatinous zooplankton by bluefin tuna is lower. For instance, if gelatinous zooplankton represents 60% and 30% of the diet of small and large bluefin tuna respectively, they should eat daily 6.3 kg and 7.1 kg of gelatinous zooplankton respectively.
These quantities may seem large, but the biomass of gelatinous zooplankton in the epipelagic region of the Mediterranean Sea ranges
usually 1–10 kg 100 m23, with the biomass of the pink jellyfish reaching sometimes values as high as 24 kg 100 m23 [10]. This means that a bluefin tuna picking effortless jellyfish as it encounter them can satisfy its daily energy requirements after swimming just a few hundred meters across a swarm of gelatinous plankton. However, this tuna will probably not be able to swallow the required biomass of jellyplankton in a single meal, so more or less continuous consumption of gelatinous plankton through light hours is a more likely scenario.
The results here reported demonstrate the plausibility that top predators control the abundance of gelatinous zooplankton, but do not prove it. Further research is needed to confirm that bluefin tuna, little tunny, spearfish and swordfish consume large amounts of gelatinous plankton across the Mediterranean. Stable isotope ratios from different regions and years with contrasting abundance of gelatinous zooplankton will be extremely useful as confirmatory evidence. The use of other intrinsic tracers, like fatty acids, can also be useful to precise the proportion of gelatinous in the diet of these species and perhaps would help to better resolve the consumption of gelatinous zooplankton by species like mackerel, bullet tuna or dolphinfish. Behavioral observations of tuna as they swim across jellyfish swarms will also be extremely helpful to understand how gelatinous plankton is handled and consumed. And last, but not least, detailed data on the demography of gelatinous zooplankton are urgently needed to allow modeling how the depletion of top predators might have be caused, together with climate forcing, recent jellyfish outbreaks.
Figure 9. Feasible contribution of potential prey to the diet of amberjack, pompano, horse mackerel, dolphinfish, blue butterfish and mackerel according to SIAR.Nekton: anchovy, lanternfish, horse mackerel and longfin squid. Results are shown as 95, 75 and 25% credibility intervals for each prey.
Acknowledgments
Authors are grateful to Joaquim Puigvert and Oscar Jerez, skippers of the fishing vesselsAncapemaandJoanafor their assistance in sample collection,
and to Joan Jerez for his support. Alex Garallo also participated in the fieldwork. The tissue samples used in this paper were provided by the BMA tissue bank managed by theFundacio´ Bosch Gimperaand with the support of theFundacio´ pel Desenvolupament Sostenible.
Author Contributions
Conceived and designed the experiments: LC IA AA. Performed the experiments: IA LC. Analyzed the data: LC IA. Contributed reagents/ materials/analysis tools: AA AB LC IA. Wrote the paper: LC IA.
References
1. Valiela I (1991) Ecology of water columns. In: Barnes BSK, Mann KH, eds. Fundamentals of aquatic ecology, Black Scien Public, Oxford. pp 29–56. 2. Pauly D, Graham WM, Libralato S, Morissette L, Palomares MLD (2009)
Jellyfish in ecosystems, online databases, and ecosystem models. Hydrobiologia 616: 67–85.
3. Purcell JE (2009) Extension of methods for jellyfish and ctenophore trophic ecology to large-scale research. Hydrobiologia 616: 23–50.
4. Richardson AJ, Bakun A, Hays GC, Gibbons MJ (2009) The jellyfish joyride: causes, consequences and management responses to a more gelatinous future. TREE 24: 312–322.
5. Purcell JE, Shin-ichi U, Wen-Tseng L (2007) Anthropogenic causes of jellyfish blooms and their direct consequences for humans: a review. Mar Ecol Prog Ser 350: 153–174.
6. Avian M, Rottini-Sandrini L (1988) Fishery and swarming ofPelagia noctilucain the central and northern Adriatic Sea: middle term analysis. Rapp Comm Int Mer Medit 31: 231.
7. Harbison GR (1993) The potential of fishes for the control of gelatinous zooplankton. International Council for the Exploration of the Sea, CM 199, ICES. 10 p.
8. Brodeur RD, Mills CE, Overland JE, Walters GE, Schumacher JD (1999) Evidence for a substantial increase in gelatinous zooplankton in the Bering Sea, with possible links to climate change. Fish Ocean 8: 296–306.
9. Daskalov GM (2002) Overfishing drives a trophic cascade in the Black Sea. Mar Ecol Prog Ser 225: 53–63.
10. Lilley MKS, Beggs SE, Doyle TK, Hobson VJ, Stromberg KHP, et al. (2011) Global patterns of epipelagic gelatinous zooplankton biomass. Mar Biol 158: 2429–2436.
11. Purcell JE, Arai MN (2001) Interactions of pelagic cnidarians and ctenophores with fish: a review. Hydrobiologia 451: 27–44.
12. Fulton B, Morato T, Pitcher TJ (2007) Modeling seamount ecosystems and their fisheries. In: Pitcher TJ, Morato T, Hart PJB, Clark MR, Haggan N, Santos RS, eds. Seamount: ecology, fisheries & conservation, Black publi, Oxford. pp 296–332.
13. Bigelow HB, Schroeder WC (1953) Fishes of the Gulf of Maine. Fish Bull 53: 1–577.
14. Mianzan HW, Mari N, Prenski B, Sanchez F (1996) Fish predation on neritic ctenophores from the Argentine continental shelf: a neglected food resource? Fish Res 27: 69–79.
15. Bjorndal KA (1997) Foraging ecology and nutrition of sea turtles. In: Lutz PL, Musick JA, eds. The biology of sea turtles, CRC Press, Boca Raton. pp 199–232. 16. Goy J, Morand P, Etienne M (1989) Long-term fluctuations ofPelagia noctiluca (Cnidaria, Scyphomedusa) in the western Mediterranean Sea. Prediction by climatic variables. Deep-Sea Res 36: 269–279.
17. Malej A (1989) Behaviour and trophic ecology of the jellyfishPelagia noctiluca (Forsskal, 1775). J Exp Mar Biol Ecol 126: 259–270.
18. Legovic T (1991) Causes, consequences and possible control of massive occurrence of jellyfishPelagia noctilucain the Adriatic Sea. In UNEP: Jellyfish blooms in the Mediterranean. Proc II Workshop on Jellyfish in the Mediterranean Sea, MAP Tech Rep Ser 47: 128–132.
19. Gili JM, Page`s F (2005) Jellyfish blooms. Boll Soc Hist Nat Balears 48: 9–22. 20. Me´nard F, Dallot S, Thomas G, Braconnot JC (1994) Temporal fluctuations of
two Mediterranean salp populations from 1967 to 1990. Analysis of the
influence of environmental variables using a Markov chain model. Mar Ecol Prog Ser 104: 139–152.
21. Molinero JC, Ibanez F, Nival P, Buecher E, Souissi S (2005) North Atlantic climate and northwestern Mediterranean plankton variability. Lim Ocean 50: 1213–1220.
22. Parsons TR (1995) The impact of industrial fisheries on the trophic structure of marine ecosystems. In: Polis GA, Winemiller KO, eds. Food Webs: Integration of Patterns and Dynamics, Chapman & Hall, New York. pp 352–357. 23. Mostarda E, Campo D, Castriota L, Esposito V, Scarabello MP, et al. (2007)
Feeding habits of the bullet tunaAuxis rocheiin the southern Tyrrhenian Sea. J Mar Biol Ass UK 87: 1007–1012.
24. Toma´s J, Aznar FJ, Raga JA (2001) Feeding ecology of the loggerhead turtle Caretta carettain the western Mediterranean. J Zool Lond 255: 525–532. 25. Revelles M, Cardona L, Aguilar A, Ferna´ndez G (2007a) The diet of pelagic
loggerhead sea turtles (Caretta caretta)of the Balearic archipelago (western Mediterranean): relevance of long-line baits. J Mar Biol Ass UK 87: 805–813. 26. Massutı´ E, Deudero S, Sa´nchez P, Morales-Nin B (1998) Diet and feeding of
dolphin (Coryphanea hippurus) in western Mediterranean waters. Bull Mar Scie 63: 329–341.
27. Campo D, Mostarda E, Castriota L, Scarabello MP, Andaloro F (2006) Feeding habits of the Atlantic bonito, Sarda sarda (Bloch, 1793) in the southern Tyrrhenian sea. Fish Res 81: 169–175.
28. Castriota L, Finoia MG, Campagnuolo S, Romeo T, Potoschi A, et al. (2008) Diet ofTetrapturus belone(Istiophoridae) in the central Mediterranean Sea. J Mar Bio Ass UK 88: 183–187.
29. Consoli P, Romeo T, Battaglia P, Castriota L, Esposito V, et al. (2008) Feeding habits of the albacore tunaThunnus alalunga(Perciformes, Scombridae) from central Mediterranean Sea. Mar Biol 155: 113–120.
30. Sinopoli M, Pipitone C, Campagnuolo S, Campo D, Castriota L, et al. (2004) Diet of young-of-the-year bluefin tuna,Thunnus thynnus(Linnaeus, 1758), in the southern Tyrrhenian (Mediterranean) Sea. J Appl Ichthyol 20: 310–313. 31. Romeo T, Consoli P, Castriota L, Andaloro F (2009) An evaluation of resource
partitioning between two billfish,Tetrapturus beloneandXiphias gladius, in the central Mediterranean Sea. J Mar Bio Ass UK 89(4): 849–857.
32. Lloris D, Meseguer S (2000) Recursos marins del Mediterrani. DARP, Barcelona. 240 p.
33. A´ lvarez de Quevedo I, Cardona L, De Haro A, Pubill E, Aguilar A (2010) Sources of bycatch of loggerhead sea turtles in the western Mediterranean other than drifting longlines. ICES J Mar Scie 67: 677–685.
34. Fromentin JM, Powers JE (2005) Atlantic bluefin tuna: population dynamics, ecology, fisheries and management. Fish and Fisheries 2005: 281–306. 35. Neilson JD, Paul SD, Smith SC (2006) Stock structure of swordfish (Xiphias
gladius) in the Atlantic: a review of the non-genetic evidence. Col Vol Sci Pap ICCAT 61: 25–60.
36. Witherington B, Kubilis P, Brost B, Meylan A (2009) Decreasing annual nest counts in a globally important loggerhead sea turtle population. Eco Appl 19: 30–54.
37. Dauby P (1989) The stable carbon isotope ratios in benthic food webs of the gulf of Calvi, Corsica. Cont Shelf Res 9: 181–195.
38. Polunin NVC, Morales-Nin B, Pawsey WE, Cartes JE, Pinnegar JK, et al. (2001) Feeding relationships in Mediterranean bathyal assemblages elucidated by stable nitrogen and carbon isotope data. Mar Ecol Prog Ser 220: 13–23.
Table 3.Proximate chemical composition and energy density of four potential preys.
Pink jellyfish Salp Mackerel Longfin squid
Sample size 5 5 5 5
Wet weight (g) 4269 19614 248631 152623
Water (%) 96.360.1 95.860.5 72.460.5 81.360.4
Ash (%) 3.460.1 3.660.5 2.860.3 2.260.2
Protein (%) 0.260.1 0.260.1 12.360.4 13.260.3
Fat (%) 0.960.1 1.060.2 13.260.2 3.360.2
Energy (kJ g21) 0.4160.1 0.4360.1 8.460.5 5.260.8
39. Revelles M, Cardona L, Aguilar A, Borrell A, Ferna´ndez G, et al. (2007c) Stable C and N isotope concentration in several tissues of the loggerhead sea turtle Caretta carettafrom the western Mediterranean and dietary implications. Scie Mar 71: 87–93.
40. Eder EB, Lewis MN (2005) Proximate composition and energetic value of demersal and pelagic prey species from the SW Atlantic Ocean. Mar Ecol Prog Ser 291: 43–52.
41. Haedrich RL (1986) Stromateidae. In: Whitehead PJP, Bauchot ML, Hureau JC, Nielsen J, Tortonese E, eds. Fishes of the North-eastern Atlantic and the Mediterranean, UNESCO, Paris, vol 3. pp 1192–1193.
42. Gnaiger E, Bitterlich G (1984) Proximate biochemical composition and caloric content calculated from elemental CHN analysis: a stoichiometric concept. Oecologia 62: 289–298.
43. Clarke A, Holmes LJ, Gore DJ (1992) Proximate and elemental composition of gelatinous zooplankton from the Southern-Ocean. J Exp Mar Biol Ecol 155: 55–68.
44. Bligh EG, Dyer WJ (1959) A rapid method of total lipid extraction and purification. Can J Biochem Physiol 37: 911–917.
45. Dubischar C, Pakhomov E, von Harbou L, Hunt B, Bathmann U (2012) Salps in the Lazarev Sea, Southern Ocean: II. Biochemical composition and potential prey value. Mar Biol 159: 15–24.
46. Parnell A, Inger R, Bearhop S, Jackson AL (2010) Source partitioning using stable isotopes: coping with too much variation. PLoS ONE 5(3): e9672. 47. Inger R, Bearhop S (2008) Applications of stable isotope analyses to avian
ecology. Ibis 150: 447–461.
48. Moore JW, Semmens BX (2008) Incorporating uncertainty and prior information into stable isotope mixing models. Ecol Lett 11: 470–480. 49. Reich KJ, Bjorndal KA, Martı´nez del Rio C (2008) Effects of growth and tissue
type on the kinetics of 13
C and 15
N incorporation in a rapidly growing ectotherm. Oec 155: 651–663.
50. Caut S, Angulo E, Courchamp F (2009) Variation in discrimination factors (D15
N andD13
C): the effect of diet isotopic values and applications for diet reconstruction. J Appl Ecol 46: 443–453.
51. Graham BS, Koch PL, Newsome SD, McMahon KW, Aurioles D (2010) Using isoscapes to trace the movements and foraging behavior of top predators in oceanic ecosystems. In: West JB, et al., editor. Isoscapes: Understanding movement, pattern, and process on Earth through isotope mapping Springer. pp 299–318.
52. Sabate´s A, Recasens L (2001) Seasonal distribution and spawning of small tunas (Auxis rocheiandSarda sarda) in the northwestern Mediterranean. Sci Mar 65: 95–100.
53. Estrada JA, Lutcavage M, Thorrold SR (2005) Diet and trophic position of Atlantic bluefin tuna (Thunnus thynnus) inferred from stable carbon and nitrogen isotope analysis. Mar Biol 147: 37–45.
54. Sara` G, Sara` R (2007) Feeding habits and trophic levels of bluefin tunaThunnus thynnusof different size classes in the Mediterranean Sea. J Appl Ichthyol 23(2): 122–127.
55. Laran S, Joiris C, Gannier A, Kenney RD (2010) Seasonal estimates of densities and predation rates of cetaceans in the Ligurian Sea, northwestern Mediter-ranean Sea: an initial examination. J Cetacean Res Manag 11: 31–40. 56. Kyrtatos NA (1982) Investigation on fishing and biology of the most important
fishes of the region around the Aegean Sea. Island of Tinos. Thalassographica 5(specl. publ.): 88.
57. Bennett BA (1989) The diets of fish in three south-western Cape estuarine systems. S Afr J Zool 24: 163–177.
58. Blanco C, Aznar J, Raga JA (1995) Cephalopods in the diet of striped dolphin, Stenella coeruleoalba, from the western Mediterranean during an epizootic in 1990. J Zool 237: 151–158.
59. Meotti C, Podesta` M (1997) Stomach contents of striped dolphins, Stenellacoer-uleoalba(Meyen, 1833) from the western Ligurian Sea (Cetacea, delphinidae). Atti soc it Sci Nat Museo civ Stor Nat Milano 137: 5–15.
60. Buckel JA, Fogarty MJ, Conover DO (1999) Foraging habits of bluefish, Pomatomus saltatrix, on the U.S. east coast continental shelf. Fish Bull 97: 758–775.
61. Henderson AC, Flannery K, Dunne JA (2001) Observations on the biology and ecology of the blue shark in the north-east Atlantic. J Fish Biol 58: 1347–1358. 62. O¨ ztu¨rk B, Salman A, Ozturk AA, Tonay A (2007) Cephalopod remains in the diet of striped dolphins (Stenella coeruleoalba) and Risso’s dolphins (Grampus griseus) in the eastern Mediterranean Sea. Vie Milieu 57: 57–63.
63. Morovic D (1961) Contribution to the knowledge of the nutrition of blue-fin tuna (Thunnus thynnus L.) in the Adriatic from fishes caught with ring nets. Proceedings and Technical Papers of the General Fisheries Council for the Mediterranean 6: 155–157.
64. Sanz Brau A (1990) Sur la nourriture des jeunes thons rougesThunnus thynnus(L. 1758) des coˆtes du Golfe de Valence. Rapp Comm Int Expl Sci Mer Me´dit 32: 274.
65. Chalabi A, Ifrene F (1992) Le re´gime alimentaire hivernal de l’espadon (Xiphias gladius). La peˆche pre`s des coˆtes est de l’Alge´rie. SCRS/92/91 ICCAT 40: 162. 66. Orsi Relini L, Garibaldi F, Cima C, Palandri G (1995) Feeding of the swordfish, the bluefin and other pelagic nekton in the western Ligurian Sea. SCRS/92/91 ICCAT 44: 283–286.
67. Falautano M, Castriota L, Finoia MG, Andaloro F (2007) Feeding ecology of little tunny,Euthynnus alletteratus, in the central Mediterranean Sea. J Mar Biol Ass UK 87: 999–1005.
68. Ben Salem M (1988) Re´gime alimentaire deTrachurus trachurus(Linnaeus, 1758) et deT. mediterraneus(Steindachner, 1868) de la province Atlantico-Me´diterra-ne´enne. Cybium 12: 247–253.
69. Matallanas J, Casadevall M, Carrasso´n M, Boix J, Ferna´ndez V (1995) The food ofSeriola dumerili(Pisces:Carangidae) in the Catalan Sea (western Mediterranean). J Mar Biol Assoc UK 75: 257–260.
70. Cardona L, Revelles M, Parga ML, Toma´s J, Aguilar A, et al. (2009) Habitat use by loggerhead sea turtles (Caretta caretta) off the coast of eastern Spain results in a high vulnerability to neritic fishing gear. Mar Biol 156: 2621–2630. 71. Cardona L, Revelles M, Carreras C, San Fe´lix M, Gazo M, et al. (2005) Western
Mediterranean immature loggerhead turtles: Habitat use in spring and summer assessed through satellite tracking and aerial surveys. Mar Biol 147: 583–591. 72. Revelles M, Cardona L, Aguilar A, San Fe´lix M, Ferna´ndez G (2007b) Habitat
use by immature loggerhead sea turtles in the Algerian Basin (western Mediterranean): swimming behavior, seasonality and dispersal pattern. Mar Biol 151: 1501–1515.
73. Doyle TK, Houghton JDR, McDevitt R, Davenport J, Hays GC (2007) The energy density of jellyfish: Estimates from bomb-calorimetry and proximate-composition. J Exp Mar Biol Ecol 343: 239–252.
74. Stillwell CE, Johler NE (1985) Food and feeding ecology of the swordfishXiphias gladiusin the western North Atlantic Ocean with estimates of daily ration. Mar Eco Pro Ser, Oldendorf 22(3): 239–247.
75. Hochscheid S, Bentivegna F, Speakman JR (2004) Long-term cold acclimation leads to high Q10effects on oxygen consumption of loggerhead sea turtlesCaretta
caretta. Physiol Biochem Zool 77: 209–222.