Ar
ti
cle
0103 - 5053 $6.00+0.00
*e-mail: [email protected]
# Present Address: Instituto de Química, Universidade Federal de
Uberlândia-MG, Brasil
Platinum(II) Compounds of Tetracyclines as Potential Anticancer Agents:
Cytotoxicity, Uptake and Interactions with DNA
Priscila P. Silva,a Flávia C. S. de Paula,a Wendell Guerra,a,# Josianne N. Silveira,b
Françoise V. Botelho,c Leda Q. Vieira,c Tiago Bortolotto,dFranciele L. Fischer,d
Giselle Bussi,d Hernán Terenzid and Elene C. Pereira-Maia*,a
aDepartamento de Química, bDepartamento de Análises Clínicas e Toxicológicas and cDepartamento de Bioquímica e Imunologia, Universidade Federal de Minas Gerais,
Av. Antônio Carlos, 6627 - Pampulha, 31270-901 Belo Horizonte-MG, Brazil dCentro de Biologia Molecular Estrutural, Departamento de Bioquímica, Universidade Federal de Santa Catarina, Campus Reitor João David Ferreira Lima,
Bairro Trindade, 88040-970 Florianópolis-SC, Brazil
As propriedades antitumorais de complexos de PtII e as características favoráveis das
tetraciclinas levaram-nos a estudar compostos de PtII da tetraciclina (tc) e doxiciclina (dox) como
candidatos a agentes antitumorais. [PtCl2(dox)], 1,é mais potente que[PtCl2(tc)], 2,em inibir o
crescimento de células de leucemia mielóide crônica.Os compostos 1 e 2 formam um complexo ternário com o ADN com valores de K iguais a 3,85×10⁴ e 5,43×10⁴, respectivamente. Os complexos
deslocam o brometo de etídeo dos sítios no ADN, o que indica um mecanismo intercalativo. Ambos os complexos diminuem a mobilidade eletroforética e a temperatura de fusão do ADN. Após a incubação das células com 1 e 2, o ADN foi extraído e os adutos formados foram quantiicados. Na concentração em que os compostos são citotóxicos contra células cancerosas, eles não afetam a viabilidade de macrófagos. A velocidade de entrada do complexo da doxiciclina nas células é três vezes maior do que a do complexo da tetraciclina e isto parece ser determinante para a sua maior atividade.
The antitumoral properties of PtII compounds and the favorable characteristics of tetracyclines
led us to study PtII compounds of tetracycline (tc) and doxycycline (dox) as candidates for anticancer
agents. [PtCl2(dox)], 1, is more potent than [PtCl2(tc)], 2, in inhibiting the growth of chronic myelogenous leukemia cells. Compounds 1 and 2 form a ternary complex with DNA withK values of 3.85×10⁴ and 5.43×10⁴, respectively. The compounds displace ethidium bromide from DNA
sites, which points to an intercalative mechanism. Both complexes decrease DNA eletrophoretic mobility and melting temperature. After incubation of cells with 1 and 2, the DNA was extracted and the adducts formed were quantiied. At the concentration that the compounds are cytotoxic to cancer cells, they do not affect macrophages viability. The rate of uptake of the doxycycline complex in cells is three times higher than that of the tetracycline complex and this seems to be determinant for its higher activity.
Keywords: platinum(II) compounds, cytotoxicity, cellular uptake, DNA binding
Introduction
cis-Diamminedichloroplatinum(II) (cisplatin) is one of the most important chemotherapeutic agents used in the treatment of a wide variety of solid tumors,1-4 and its
interaction with DNA is pointed out as the main mechanism of cytotoxic action.5,6 Despite the important contribution
of cisplatin in cancer therapy, its use presents limitations such as development of resistance and side effects, which has stimulated the design of novel compounds.7-13
oral administration and low cost. The main mechanism of tetracycline antimicrobial action is the inhibition of protein synthesis.
Tetracyclines are good proligands for different metal ions because they possess diverse potential metal binding sites: oxygens at the C1-C3 tricarbonyl system or O1 and the amide oxygen in ring A, oxygens at the C10-C12 system, and the nitrogen of the dimethylammonium group at N4.14 As a consequence, their pharmacological activities,
pharmacokinetics and bioavailability are dictated by metal coordination. In blood plasma, the drug is transported as calcium complexes15 and, once inside bacterium cells,
magnesium complexes are responsible for binding to ribosomes.16
Because of the favorable characteristics of tetracyclines, they were indiscriminately used, which led to the appearance of bacterial resistance to this family of drugs.17-21
Many efforts have been made to control the propagation of multidrug resistant strains worldwide. We synthesized platinum(II) and palladium(II) complexes with tetracycline and doxycycline, which are active against E. coli sensitive and resistant strains.22-24 Doxycycline has the same minimal
formula as that of tetracycline: the difference between them lies in the presence of an OH group at C5 in doxycycline instead of C6 in tetracycline. In both cases, they form 1:1 complexes with platinum(II) via the oxygen atoms of the hydroxyl and the amide group in ring A, and two chloride ions complete the coordination sphere in a square planar geometry around the metal ion. The proposed structures of the PtII complexes of tetracycline and doxycycline are
represented in Figure 1. The synthesis, characterization, and antibacterial effect of these compounds were described elsewhere.22,24 Dos Santos et al.25 carried out a theoretical
study of PtII coordination to anhydrotetracycline, in which
they calculated the 1H NMR spectra for different possible
structures, compared them to our previous experimental results for the PtII complex of tetracycline, and concluded
that, in aqueous solution, the PtII ion should be bound to O3
and the amide oxygen, according to our proposal. The same authors have shown that the reactivity of the PtII compound
of anhydrotetracycline towards several nucleophiles is similar to that of cisplatin.26
Tetracyclines also exhibit pharmacological properties other than antimicrobial activity. An example of interest in cancer therapy is the inhibition by doxycycline and other chemically modiied tetracyclines of matrix metalloproteinases, which are members of the zinc-dependent metallopeptidases and implicated in major stages of cancer progression. As a consequence, matrix metalloproteinases became a new target for the treatment of cancer.27, 28 Garcia et al.29suggested that doxycycline
inhibition of metalloproteinase activity occurs through interactions with the structural zinc and/or calcium atoms of the protein.
Khan et al.30,31 reported that, in the presence of copper(II)
ions, tetracycline binds to DNA and breaks its strand probably with the involvement of reactive oxygen species.
In this study, we investigated the cytotoxicity, uptake and interactions of platinum(II) complexes of tetracycline (tc) and doxycycline (dox) with DNA. Our strategy was to ally the antitumoral properties of platinum compounds to the favorable properties of tetracyclines, such as low toxicity and broad spectrum of action.
Experimental
Reagents, materials and methods
All chemicals were reagent grade and were used without further puriication. Doxycycline hydrochloride (dox•HCl),
tetracycline hydrochloride (tc•HCl) and potassium
tetrachloroplatinate were purchased from Sigma Chemical Company. Stock solutions were prepared just before use to avoid ligand degradation caused by oxygen and light. Platinum(II) complexes of tetracycline and doxycycline were synthesized as previously described.22,24 The
complexes can be represented as [PtCl2(dox)], complex 1, and [PtCl2(tc)], complex 2, in which tc and dox correspond to the same minimal formula, C22H24O8N2. Calf thymus DNA sodium salt (CT DNA), 3-(4,5-dimethylthiazol-2yl)-2,5-diphenyltetrazolium bromide (MTT) and Figure 1. Proposed structures for compounds 1, [PtCl2(dox)], and 2, [PtCl2(tc)].
8 8 9 9 10 10 7 7 6 6 12 12 5 5 1
1 22
3 3 4 4 OH OH O OH C O O CH3 NH2 O Pt
D C B A
11
Cl
Cl N
CH3
H3C
H + HO 8 8 9 9 10 10 7 7 6 6 12 12 5 5 1
1 22
3 3 4 4 OH OH O OH C O O CH3 NH2 O Pt
D C B A
11
Cl
Cl
OH N
CH3
H3C
H + Complex 1
sodium dodecyl sulfate (SDS) were used as obtained from Sigma. Ethidium bromide, 2,7- diamino-10-ethyl-6-phenylphenanthridinium bromide (Eb), was bought from Gibco BRL. The plasmid pBSK-II (2961 bp), used for the DNA cleavage assays, was purchased from Stratagene, transformed into DH5αEscherichia coli competent cells and amplified as previously described.32 The plasmid
DNA was extracted from E. coli and puriied using Qiagen Plasmid Maxi Kit protocol.33
195Pt NMR (86 MHz) spectra were obtained using
a Bruker Avance DRX 400 spectrometer in dmf-d7. Electrospray ionisation-mass spectrometry (ESI-MS) studies, in positive ion mode, were carried out on a Bruker Daltonics Squire 3000 Plus equipment at the Central Analítica of Universidade de São Paulo. The complexes were dissolved in a few drops of dimethylformamide (dmf) and then diluted with a 1:1 MeOH:H2O solution.
Partition coeficient
Partition coeficients of the complexes were determined in duplicate in an n-octanol/water system. Each complex was dissolved in 50 mL of water at 4×10⁻⁵ mol L-1 and
subsequently an equal volume of n-octanol was added. The mixtures were shaken mechanically for 24 h to insure the distribution between the two solvent phases. The samples were centrifuged (13,000 rpm for 5 min). Afterwards, they were diluted 5-fold and the platinum concentration was determined in both phases by graphite furnace atomic absorption spectrometry (GFAAS) in a Varian model Zeeman 220 spectrophotometer equipped with a graphite tube atomizer and an autosampler. Results are expressed as apparent partition coeficients (P), which were determined from the total metal concentration in n-octanol divided by the total metal concentration in the aqueous layer.
Cell line and culture
The K562 cell line was purchased from the Rio de Janeiro Cell Bank (number CR083 of the RJCB collection). K562 cell line was established from pleural effusion of a 53 year-old female with chronic myelogenous leukemia in terminal blast crisis. Cells were cultured in RPMI 1640 (Roswell Memorial Park Institute medium, Sigma Co.) supplemented with 10% of fetal calf serum (CulLab, São Paulo, Brazil) at 37 °C in humidiied 5% CO2 atmosphere. Cultures initiated at 105 cells mL-1 and grew exponentially
to about 8×10⁵ cells mL-1 in three days. Cell viability
was checked by Trypan Blue exclusion with an optical microscope. Cell number was determined by Coulter counter analysis.
Drug sensitivity assay and determination of platinum cellular concentrations
Dose-response curves were obtained by incubating 1×10⁵ cells mL-1 for 72 h in the absence and presence
of various concentrations of tested compounds. The sensitivity to the drug was evaluated from the drug concentration needed to inhibit cell growth by 50%, the IC50. Long-term measurements of platinum accumulation were made by incubating cells in the culture medium with various equitoxic drug concentrations for 72 h. After incubation, an aliquot was taken, washed twice with ice-cold isotonic buffer and the pellet was resuspended in 33% HNO3. Platinum concentration was determined by atomic absorption spectroscopy in a Varian model Zeeman 220 spectrophotometer equipped with a graphite tube atomizer and an autosampler.
Short-term measurements were performed by following the uptake of the platinum(II) compounds by K562 cells as a function of the incubation time up to 4 h. 1×10⁶ cells mL-1
were incubated with 1×10⁻⁵ mol L-1 of compounds in an
isotonic buffer (132 mmol L-1 NaCl, 3.5 mmol L-1 KCl,
1 mmol L-1 CaCl
2, 0.5 mmol L -1 MgCl
2, 20 mmol L -1
HEPES (4-(2-hydroxyethyl)-1-piperazineethanesulfonic acid), 5 mmol L-1 glucose) at pH 7.20 and 37 °C, under
continuous stirring. At ixed time intervals, an aliquot was taken, washed twice with ice-cold isotonic buffer without glucose and the pellet was resuspended in 33% HNO3. Platinum concentration was determined as described above.
DNA binding
K562 cells (5×10⁶) were incubated with different
concentrations of complexes 1 and 2 ranging from 10 to 300 µmol L-1 for 2 h. Afterwards, DNA was extracted
from cells, by using a kit from Sigma (Sigma’s GenElute Mammalian Genomic DNA Miniprep Kit).33 DNA
concentration per nucleotide was determined by spectrophotometric analysis (ε = 6600 mol L-1 cm-1 at
260 nm). The ratio of absorbance at 260 nm to 280 nm was between 1.6-1.9. Platinum concentration was determined by GFAAS.
UV and visible absorption measurements
A Cary 100 spectrophotometer was used for UV and visible absorption measurements. For the interactions with CT DNA, the complex concentration used was 1.0×10⁻⁴ mol L-1 and the DNA-to-complex molar ratios
at 260 nm. The ionic strength was maintained constant with 1×10⁻³ mol L-1 NaCl and the pH was ixed at 7.3 with
20 mmol L-1 TRIS-HCl buffer. The absorbance of DNA
itself was subtracted by adding equal quantity of DNA to both the complex and the reference solutions.
Circular dichroism (CD)
CD spectra of CT DNA modiied by 1 and 2 were recorded at 25 ºC in 25 mmol L-1 TRIS buffer pH 7.0 by
using a Jasco J-815 spectropolarimeter equipped with a thermoelectrically controlled cell holder with a cell pathlength of 1 cm. The spectrum was recorded in the range of 200-350 nm with an averaging time of 4 s, speed 100 nm min-1 and three accumulations. The spectrum of
the corresponding buffer and of the complexes alone were collected and subtracted from that of the reaction mixture.
Fluorescence measurements
Fluorescence measurements were carried out on a Varian Cary Eclipse luorescence spectrophotometer setting the excitation and emission slits at 5 nm. Ethidium bromide was dissolved in 20 mmol L-1 TRIS-HCl buffer at pH 7.3.
The DNA solution was prepared as described above. To a solution containing 10 µmol L-1 DNA and 8 µmol L-1 Eb,
increasing concentrations of the tested compounds were added and the emission spectra registered after excitation at 546 nm. Tetracycline concentrations ranged from 0 to 1.49×10⁻³ mol L-1; doxycycline concentrations from 0
to 2.91×10⁻³ mol L-1; complex 1 concentrations ranged
from 0 to 8.78×10⁻⁵ mol L-1; and complex 2 from 0 to
1.43×10⁻⁴ mol L-1.
DNA thermal denaturation
Thermal-denaturation experiments were carried out on an Ultrospec 2100 UV/Vis spectrophotometer (Amersham Bioscences, USA) equipped with a peltier temperature controller. UV absorbance of CT-DNA (100 µmol L-1) was
recorded in melting buffer (1 mmol L-1 NaH
2PO4/Na2HPO4
pH 7.2, 2 mmol L-1 NaCl). The melting curves were recorded
at different concentration ratios of complexes to DNA (r = 0 and 0.25, r = [complex] / [DNA]) by plotting the absorption at 260 nm as function of temperature in the range of 25-75 ºC with a ramp rate of 1 ºC min-1. Before the start of ramping,
the samples were equilibrated for 5 min at 25 ºC. The melting temperature (Tm) was determined from the midpoint of the transition curves itted by sigmoidal non-linear regression.
∆Tm was deined as the difference between the Tm of free DNA and the Tm of DNA in the presence of 1 and 2.
Plasmid DNA cleavage
The ability of 1 and 2 to cleave DNA was examined by following the conversion of the supercoiled plasmid form (F I) to the open circular (F II) and/or linear forms (F III) using agarose gel electrophoresis to separate the cleavage products. In general, 330 ng of pBSK-II (25 µmol L-1 in
pb) in PIPES buffer (pH 7.0) were treated with different concentrations of 1 and 2 in CH3CN (25% v/v) for 20 h at 50 ºC. Thereafter, each reaction was quenched by adding 5 µL of a loading buffer solution (50 mmol L-1 TRIS pH 7.5,
0.01% bromophenol blue, 50% glycerol and 250 mmol L-1
EDTA) and then subjected to electrophoresis on a 0.8% agarose gel containing 0.3 µg mL-1 of ethidium bromide
in 0.5×TBE buffer (44.5 mmol L-1 TRIS, 44.5 mmol L-1
boric acid, and 1 mmol L-1 EDTA) at 90 V for about 1.5 h.
The resulting gels were visualized and digitized with a DigiDoc-It gel documentation system (UVP, USA).
Plasmid DNA interaction by agarose gel mobility shift assay
The ability of 1 and 2 to bind the plasmid DNA was evaluated by agarose gel eletrophoresis to detect changes in eletrophoretic mobility of pBSK-II treated with 1 and
2. Thus, 330 ng of pBSK-II (25 µmol L-1 in pb) in PIPES
(pH 7.0) buffer were treated with different concentrations of 1 and 2 in CH3CN (25% v/v) for 16 h at 50 ºC. Thereafter, the reactions were quenched by adding 5 µL of a loading buffer solution (50 mmol L-1 TRIS pH 7.5,
0.01% bromophenol blue, 50% glycerol and 250 mmol L-1
EDTA) and the mixture was subjected to electrophoresis on a 1.0% agarose gel in 0.5×TBE buffer (44.5 mmol L-1 TRIS,
44.5 mmol L-1 boric acid, and 1 mmol L-1 EDTA) at 90 V
for about 1.5 h. The gels were stained after electrophoresis in 0.5×TBE buffer with 2.5 µg mL-1 ethidium bromide for
15 min.
Mice
Males and females of 4-8 weeks of the mouse strain C57BL/6 (CEBIO-UFMG, Belo Horizonte, Brazil) were used. Experimental animals were kept in a conventional animal house with barriers, temperature and light control. Food and water were offered ad libitum.
Macrophages
sacriiced and 10 mL of sterile RPMI 1640 medium, without phenol red (Sigma Chemical Co., St Louis, MO, USA), were injected into the peritoneal cavity. The largest possible content was aspirated, and the cells were centrifuged at 4 °C. The supernatant medium was discarded and cells were resuspended in RPMI 1640 medium without phenol red, supplemented with 10% fetal bovine serum (CultLab São Paulo, Brazil), 0.05 mmol L-1 β-mercaptoethanol
(Sigma Chemical Co.), 0.2% gentamicin and 200 mmol L-1
L-glutamine. The cells were counted in a Newbauer chamber, and the inal concentration was adjusted for each experiment.
Macrophages viability
To evaluate the cellular viability, 2×10⁵ cells mL-1
were incubated in the absence and presence of different concentrations of the studied compounds for 24, 48 or 72 h. Cell viability was assessed using the MTT tetrazolium dye reduction assay. 100 µL of 5 mg mL-1 MTT were added
to 2×10⁵ cells in duplicate wells of a 96-well lat-bottom
tissue culture plate and cells were incubated for 4 h at 37 °C. After 4 h, 100 µL of SDS detergent were added to each well. The absorbance at 550 nm of each sample well was measured using an automated plate reader. The experiment was repeated at least twice.
Results and Discussion
As already mentioned, we investigated the cytotoxic activity and the interactions of PtII complexes of tc and
dox with DNA in order to evaluate their antitumoral potential. Although we were unable to grown crystals of
1 and 2 suitable to determine their structures by X-ray diffraction analysis, spectroscopic studies, including FTIR and 1H NMR, led us to propose the structures
represented in Figure 1. The 195Pt NMR spectra of
complex 2 (Supplementary Information, SI, Figure S1) and 1 (reported in a previous work)24 showed the presence
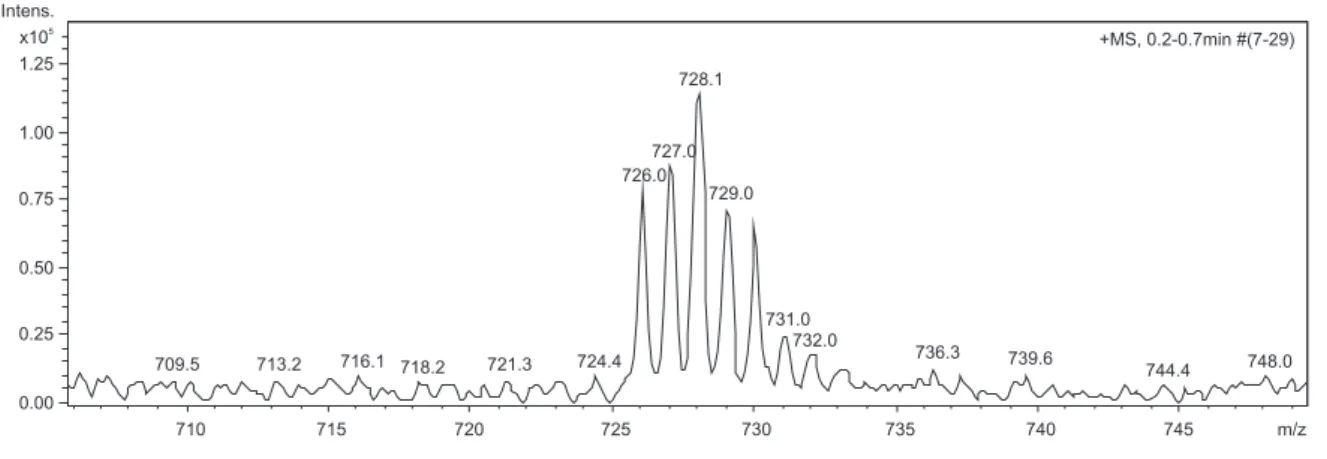
of only one species. The ESI-MS studies conirmed the presence of the complexes in solution. For both complexes a peak at m/z 728 corresponds to the proposed formula plus a water molecule (SI, Figure S2).
Drug sensitivity assay in K562 cells
The concentration of compounds necessary to inhibit 50% of cell growth, IC50, and the octanol/water partition coeficient, P, are shown in Table 1.
Comparing the activity of the complexes to those of the proligands, one observes that complex 1 is ca. 3 times
more potent than dox and complex 2, ca. 6 times more potent than tc. In addition, complex 1 is 1.5 times more active than complex 2 and 2.5 times more lipophilic. A correlation between lipophilicity and cytotoxic activity was also reported by Silva et al.34 in a study of platinum(II)
complexes with ligands derived from 1,3-propanediamine, whose difference lies in the carbon chain length.
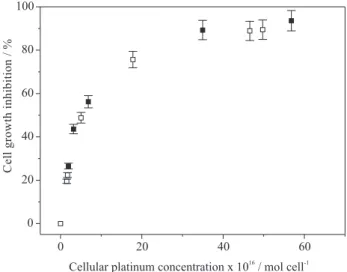
Drug accumulation after equitoxic exposure
We have determined the intracellular concentration of the compounds after three days of incubation (Figure 2). The results obtained after incubation with equitoxic concentrations show that the same intracellular levels are necessary to attain a certain cytotoxic effect; for example, incubation with IC50 concentrations yields an intracellular platinum concentration of 5.2×10⁻¹⁶ mol cell-1 for both
complexes.
Table 1. IC50, [Pti] and P values for the compounds [PtCl2(dox)], 1, and [PtCl2(tc)], 2
Compound IC50 (µmol L-1 ± s.d.)
[Pti] × 1016
(mol/cell)
P
dox 17.70 ± 0.9 - 0.80a
tc 52.37 ± 3.1 - 0.05a
1 6.30 ± 0.25 5.6 1.76b
2 9.39 ± 0.20 5.0 0.70b
IC50 is the concentration required to inhibit 50% of K562 cell growth. [Pti] is the intracellular platinum concentration determined after incubating cells for 3 days with IC50 doses. P is thetotal platinum in n-octanol divided by total platinum in the aqueous layer. a(from reference 47); b this work
(the values are mean of triplicate determinations).
Interactions with DNA
As the mechanism of the antitumoral action of platinum compounds such as cisplatin involves binding to DNA, we have investigated the interactions of the compounds 1 and
2 with this intracellular target.
Spectrophotometric studies
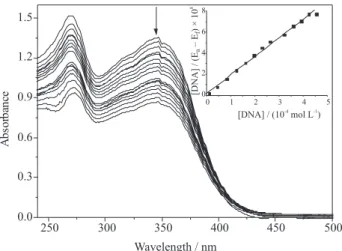
We have registered the spectra of solutions of the complexes in the absence and presence of increasing concentrations of CT DNA. The addition of DNA induces a hypochromic effect, indicating that both PtII complexes form
a ternary complex with calf thymus DNA. A representative experiment obtained with complex 1 at 1×10⁻⁴ mol L-1 and
[DNA] / [1] varying from 0 to 4.5 is shown in Figure 3. In order to compare the binding strengths of the complexes, the binding constant, K, was calculated according to the equation
[DNA] / (εa - εf) = [DNA] / (ε0 - εf) + 1/K(ε0 - εf),
where [DNA] is the concentration of DNA in base pairs,
εa is the ratio of the absorbance / [Pt], εf is the extinction coeficient of the free PtII complex and ε
0 is the extinction
coeficient of the complex in the fully bound form.35 The
ratio of slope to intercept in the plot of [DNA] / (εa - εf)
versus [DNA] gives the value of K (inset Figure 3). Complex
1 has a slightly lower afinity to DNA than complex 2,with K values of 3.85×10⁴ and 5.43×10⁴, respectively.
Circular dichroism (CD) spectroscopy is a useful technique for diagnosing changes in DNA morphology during drug-DNA interactions, as the CD signals are quite sensitive to the mode of DNA interactions with small
molecules.36 The CD spectrum of the free DNA is composed
of a positive band at 275 nm, due to base stacking, and a negative one at 245 nm, due to the right-handed helicity of B-DNA.37 Upon addition of 1 and 2, the CD spectrum of the
resulting DNA undergoes an increase in both the positive and negative bands, as shown in Figure 4. This behavior indicates that the complexes probably intercalate into DNA, since it is generally accepted that the classical intercalation enhances the base stacking and stabilizes helicity, and thus increases intensities of the both bands, whereas simple groove binding and electrostatic interaction of small molecules show less or no perturbation on the base stacking and helicity bands.38,39 In addition, the changes induced by 2 are more signiicant than those by 1, in accordance to the afinity constants determined from UV-Vis data.
The interactions with DNA were also studied by luorescence spectroscopy with the help of a luorescent probe, the ethidium bromide. Eb is a well-known DNA intercalator, which is only poorly luorescent but whose luorescence enhances when intercalated between the base pairs. It can be used to evidence intercalating molecules because they can displace it from DNA sites leading to fluorescence quenching. We have firstly checked that 8 µmol L-1 Eb saturate DNA sites in a 10 µmol L-1 solution.
The addition of the compounds 1 and 2 quenches the luorescence emission with different afinities (Figure 5). The effects of free tc and dox are not very strong: to displace 50% of Eb from DNA sites it is necessary to add a molar ratio drug-to-Eb equal to 289 for dox and 106 for tc. Therefore, to attain the same quenching it is necessary to add approximately 2.7 times more doxycycline than tetracycline to the solution. By comparing the results obtained with the proligands to those with their respective PtII complexes, one
Figure 3. Spectra of solutions containing complex 1 (1.0×10⁻⁴ mol L-1)
and increasing concentrations of DNA in HEPES buffer pH 7.4. [DNA]: [complex 1] ranging from 0 to 4.5. Inset: [DNA]/(εa - εf) versus
[DNA].
Figure 4. CD spectra of CT-DNA (200 µmol L-1) in 25×10-3 mol L-1 PIPES
observes a signiicant increase in the afinity for DNA. The PtII complex of tc is approximately 20 times as potent as tc
in displacing Eb from DNA, and the PtII complex of dox is
approximately 33 times as potent as dox. From a plot of the luorescence signal at 601 nm as a function of the molar ratio complex-to-DNA one can estimate the molar ratio needed to displace 50% of the added Eb from DNA sites: 231 for free dox, 85 for free tc, 4 for [PtCl2(tc)] and 7 for [PtCl2(dox)]. These results indicate that the agents competitively displace Eb from the DNA molecule. Khan et al.30 performed a study
of the interactions of tc and DNA in the absence and presence of copper(II) ions and observed a 2.6-fold increase in the afinity to DNA. In our study, PtII coordination increases
dox afinity to DNA by a factor of 33 and tc afinity by a factor of 21.
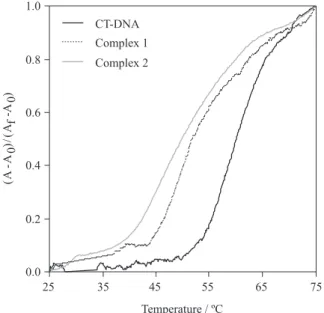
DNA thermal denaturation
The melting curves of CT-DNA in the absence and presence of 1 and 2 are presented in Figure 6. The melting
Figure 5. Effect of doxycycline (dox), tetracycline (tc) and their PtII compounds, 1 and 2, respectively, on the binding of Eb to calf-thymus DNA. The DNA
concentration was 10 µmol L-1 and that of Eb 8 µmol L-1, in TRIS-HCl buffer at pH 7.3. The wavelength of excitation was 546 nm. Top: left - Fluorescence
emission spectra in the presence of dox concentrations ranging from 0 to 2.91×10⁻³ mol L-1. Right: Fluorescence intensity at 601 nm as a function of
ligand-to-DNA molar ratio. Bottom: Left - Fluorescence emission spectra in the presence of compound 1 concentrations ranging from 0 to 87.75 µmol L-1.
Right - Fluorescence intensity at 601 nm as a function of complex-to-DNA molar ratio.
Figure 6. Melting curves of CT-DNA (100 µmol L-1) at 260 nm in the
temperature (Tm) determined for CT-DNA was 60.3 ºC. In the presence of 1 and 2, the Tm decreased to 52.4 and 50.0 ºC, representing a ∆Tm of −7.9 and −10.3 ºC, respectively. The decrease in Tm can be attributed to the formation of cross-links between the complexes and DNA, reducing the double-helical stability. This has been demonstrated earlier for several platinum complexes with similar results.40,41
Plasmid DNA cleavage
No plasmid DNA cleavage was observed for 1 and 2, as evidenced by the constant amountof supercoiled DNA (F I) and open circular DNA (F II) after the treatment with the complexes, even after long incubation times of 20 h at 50 ºC and concentrations up to 500 µmol L-1 (Figure 7). Many
platinum complexes, such as cisplatin, interact with DNA by a binding mode that does not promote DNA cleavage.42
Plasmid DNA interaction by agarose gel mobility shift assay
Since no evidence of plasmid DNA cleavage was found by treatment with 1 and 2, their ability to bind and consequently change the eletrophoretic mobility of supercoiled DNA was assayed. Both complexes are able to decrease the mobility of supercoiled DNA in a concentration-dependent manner from 250 to 1000 µmol L-1
(Figure 8). Futhermore, 2 seems able to effect stronger binding with plasmid DNA compared to 1 at the same conditions, since the alteration of migration of FI is clearly seen at 100 µmol L-1 for complex 2 in contrast to
250 µmol L-1 for complex 1. The alteration of supercoiled
plasmid DNA migration is typically caused by compounds that alter DNA topology such as intercalators. It has also been reported that non-intercalators such as minor groove binders could have a similar performance.43 Some platinum
complexes present this type of binding, which is in good agreement with citotoxicity and anticancer properties.44-46
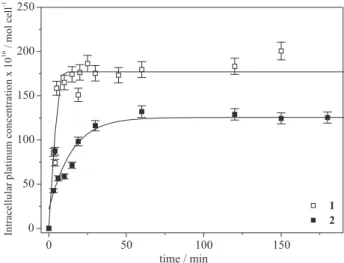
Cellular uptake of platinum(II) compounds
Our results have shown that complex 1 has a slightly lower afinity for DNA than complex 2 despite the fact
that itis more cytotoxic. Complex 1 is also more lipophilic and this can modulate its uptake in cells. In order to investigate if thecytotoxic activity was related to the uptake rate we have followed the variation of the intracellular concentration of platinum, [Pt]i, as a function of the incubation time (Figure 9). The intracellular concentration increases linearly with time up to 10 min and the curve approaches saturation after 25 min for compound 1 and 50 min for compound 2. The initial rate of uptake can be calculated by the slope of the tangent to the curve [Pt]i = f(t). The uptake of compound 1 is faster than that of compound 2: we obtain a rate of 2.7×10⁻¹⁸ mol cell-1 s-1
(kin = 2.6×10⁻¹³ L cell-1 s-1) for compound 1 and
8.3×10⁻¹⁹ mol cell-1 s-1 (kin = 8.3×10⁻¹⁴ L cell-1 s-1) for
compound 2. The ratio of the uptake rate of the doxycycline complex divided by that of the tetracycline compound is
ca. 3. This can be correlated to the difference in the dose-Figure 7. Agarose gel eletrophoresis of pBSK-II plasmid DNA (330 ng,
25 µmol L-1 in bp) treated with 1 and 2 at the indicated concentrations for
20 h at 50 ºC in PIPES buffer (25×10-3 mol L-1, pH 7.0).
Figure 8. Agarose gel eletrophoresis of pBSK-II plasmid DNA (330 ng, 25 µmol L-1 in bp) treated with 1 (A) and 2 (B)at the indicated concentrations
for 16 h at 50 ºC in PIPES buffer (25×10-3 mol L-1, pH 7.0).
Figure 9. Uptake of platinum(II) compounds of tetracycline (illed squares) and of doxycycline (open squares) by K562 cells. 1×10⁶ cells
were incubated with 1×10⁻⁵ mol L-1 of each compound. Three independent
response curves of the complexes, strongly suggesting that more tetracycline complex is needed to attain a given cytotoxic effect because it enters cells more slowly.
Intracellular DNA binding
We have shown that complexes 1 and 2 enter and are accumulated in cells and that they interact with DNA in vitro. Furthermore, we have extracted DNA from cells after incubating with 1 and 2 and quantiied the adducts formed.
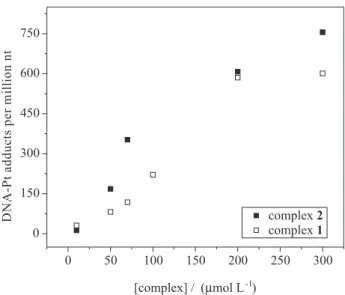
Cells were incubated with increasing concentrations of both complexes for 2 h prior to DNA extraction and platinum content determination. In Figure 10, the amount of platinum bound to DNA is plotted as a function of the concentration of 1 and 2 in the incubation medium. The number of Pt-DNA adducts increases with the concentration of the complex. Therefore, platinum-DNA adducts are formed inside cells when they areexposed to 1 and 2.
Macrophages viability
As macrophages play an important role in antitumor immunity, producing important antitumor molecules such as TNF-α and nitric oxide, we investigated the effect of our compounds on mouse peritoneal macrophage viability. Both compounds do not affect the viability of mouse peritoneal macrophages up to 16 µmol L-1 after a 24 or
48 h-incubation (data not shown). After 72 h of incubation, the IC50 values were 18 µmol L-1 for compound 1 and
34 µmol L-1 for compound 2 (Figure 11). Therefore, the
doxycycline complex is more toxic to macrophages than the tetracycline counterpart.
Conclusions
We have shown that the interactions of tetracycline and doxycycline with DNA are not very strong, but for their PtII compounds these interactions are signiicant. This
enhancement in the afinity of the antibiotics for DNA is worth to note and suggests that interaction with DNA can be crucial for the cytotoxic effect of the compounds. The fact that the complexes displace Eb from DNA sites, enhance base stacking and stabilize helicity points to an intercalative mechanism. Both complexes are able to decrease the eletrophoretic mobility and the melting temperature of DNA in a concentration-dependent manner.
Our results demonstrated that platinum(II) complexes of tetracycline and doxycycline enter cells, bind to DNA and inhibit tumoral cell growth at a concentration in which they do not affect macrophage viability. The platinum(II) complex of doxycycline is more lipophilic and enters cells at a higher rate than its tetracycline counterpart and this seems to be the reason for its higher cytotoxic activity.
Supplementary Information
Supplementary Information is available free of charge at http://jbcs.org.br, as PDF ile.
Acknowledgments
This work was supported by grants from CNPq (Conselho Nacional de Desenvolvimento Cientíico e Tecnológico, Brazil), Instituto Nacional de Ciência e Tecnologia de Catálise em Sistemas Moleculares e Nanoestruturados (INCT-Catálise), Instituto Nacional de Ciência e Tecnologia de Biologia Estrutural e Bioimagem (INBEB)and FAPEMIG (Fundação de Amparo à Pesquisa de Minas Gerais, Brazil). Figure 10. Amount of platinum bound to DNA as a function of the
concentration of complex 1 (open squares) or complex 2 (illed squares) added to the incubation medium. 1×10⁶ K562 cells were incubated with
different concentrations of complexes ranging from 0 to 300 µmol L-1 for
2 h. The values are averages of three separate measurements.
References
1. Rosenberg, B. L.; Camp, V.; Cancer Res. 1970, 30, 1799. 2. Lippert, B.; Cisplatin: Chemistry and Biochemistry of a Leading
Anticancer Drug, VHCA and Wiley-VCH: Weinheim, 1999.
3. Rosenberg, J. E.; Carrol, P. R.; Small, E. J.; J. Urol. 2005,
174,14.
4. Pisters, K. M.; Le Chevalier, T.; J. Clin. Oncol.2005, 23, 3270. 5. Jamieson, E. R.; Lippard, S. J.; Chem. Rev.1999, 99, 2467. 6. Fichtinger-Schepman, A. M. J.; Van der Veer, J. L.; Den Hartog,
J.H.J.; Lohman, P. H. M.; Reedijk. J.; Biochemistry,1985, 24, 707. 7. Dzamitika, S.; Salerno, M.; Pereira-Maia, E.; Le Moyec, L.;
Garnier-Suillerot, A.; J. Bioenerg. Biomembr. 2006, 38, 11. 8. Gately, D. P.; Howell, S. B.; Br. J. Cancer. 1993,67, 1171. 9. Pereira-Maia, E.; Garnier-Suillerot, A.; J. Biol. Inorg. Chem.
2003,8, 626.
10. Ishida, S.; Lee, J.; Thiele, D. J.; Herskowitz, I.; Proc. Natl.
Acad. Sci. USA2002, 99, 14298.
11. Katano, K.; Kondo, A.; Safaei, R.; Holzer, A.; Samimi, G.; Mishima, M.; Kuo, Y; Rochdi, M.; Howell, S. B.; Cancer Res. 2002, 62, 6559.
12. César, E.; Almeida, M.; Fontes, A. P.; Pereira-Maia, E.; Garnier-Suillerot, A.; Couri, M.; Felício, E.; J. Inorg. Biochem.2003,
95, 297.
13. Couria, M. R. C.; Almeida, M.; Fontes, A. P.; Chaves, J. A. S.; César, E. T.; Alves, R. J.; Pereira-Maia, E. C.; Garnier-Suillerot,
A.; Eur. J. Inorg. Chem. 2006, 1868.
14. de Paula, F. C. S.; Carvalho, S.; Duarte, H. A.; Paniago, E.; Mangrich, A. S.; Pereira-Maia, E. C.; J. Inorg. Biochem. 1999, 76, 221. 15. Brion, M.; Berthon, G.; Fourtillan, J. B.; Inorg. Chim. Acta
1981, 55, 47.
16. Lambs, L.; Venturini, M.; Decock-Le Révérend, B.; Kozlowski, H.; Berthon, G.; J. Inorg. Biochem. 1988, 33, 193.
17. Chopra, I.; Drug Resist. Updat.2002, 5, 119.
18. Salyers, A. A.; Speer, B. S.; Shoemaker, N. B.; Mol. Microbiol. 1990, 4, 151.
19. Davies, J.; Science1994, 264, 375. 20. Nikaido, H.; Science1994, 264, 382.
21. Saenger, W.; Orth, P.; Kisker, C.; Hillen, W.; Hinrichs, W.;
Angew. Chem. Int. Ed. 2000, 39, 2042.
22. Chartone-Souza, E.; Loyola, T. L.; Bucciarelli-Rodriguez , M.; Menezes, M. A.; Rey, N.A.; Pereira-Maia, E. C.; J. Inorg.
Biochem. 2005,99, 1001.
23. Guerra, W.; Azevedo, E. A.; Monteiro, A. R. S.; Chartone-Souza, E.; Nascimento, A. M. A.; Bucciarelli-Rodriguez, M.; Fontes, A. P. S.; Le Moyec, L.; Pereira-Maia, E. C.;J. Inorg. Biochem. 2005,99, 2348.
24. Guerra, W.; Silva, I. R.; Azevedo, E. A.; Monteiro, A. R. S.; Bucciarelli-Rodriguez, M.; Chartone-Souza, E.; Silveira, J. N.; Fontes, A. P. S.; Pereira-Maia, E. C.; J. Braz. Chem. Soc. 2006,
17, 1627.
25. Santos, H. F.; Marcial, B. L.; Miranda, C. F.; Costa, L. A. S.; Almeida,W. B.; J. Inorg. Biochem. 2006, 100, 1594. 26. Marcial, B. L.; Costa, L. A. S.; De Almeida, W. B.; Dos Santos,
H. F.; J. Braz. Chem. Soc.2008, 19, 1437.
27. Egeblad, M.; Werb, Z.; Nat. Rev. Cancer2002,2, 161. 28. Overall, C.M.; Lopez-Otin, C.; Nat. Rev. Cancer2002, 2, 657. 29. Garcia, R. A.; Pantazatos, D. P.; Gessner, C. R.; Go, K. V.; Woods
Jr., V. L.; Villarreal, F. J.; Mol. Pharmacol. 2005, 67, 1128. 30. Khan, A. M.; Musarrat, J.; Int. J. Biol. Macromol. 2003, 33, 49. 31. Khan, A. M.; Mustafa, J.; Musarrat, J.; Mut. Res. 2003,525, 109. 32. Tan, M. W.; Rahme, L. G.; Sternberg, J. A.; Tompkins, R. G.;
Ausubel, F. M.; Proc. Natl. Acad. Sci. USA1999, 96, 2408. 33. Rey, N. A.; Neves, A.; Silva, P. P.; Paula, F. C. S.; Silveira, J. N.;
Botelho, F. V.; Vieira, L. Q.; Pich, C. T.; Terenzi, H.; Pereira-Maia, E. C.; J. Inorg. Biochem.2009,103, 1323.
34. Silva, H.; Barra, C. V.; Costa, C. F.; Almeida, M.; César, E. T.; Silveira, J. N.; Garnier-Suillerot, A.; Paula, F. C. S.; Pereira-Maia, E. C.; Fontes, A. P.; J. Inorg. Biochem. 2008, 102, 767. 35. Kumar, R. S.;Arunachalam, S.; Periasamy, V. S.; Preethy, C.
P.; Riyasdeen, A.; Akbarsha, M. A.; J. Inorg. Biochem. 2009,
103, 117.
36. Garbett, N. C.; Ragazzon, P. A; Chaires, J. B.; Nature Protocols
2007, 2, 3166.
37. Chen, Z.; Wang, X.; Li, Y.; Guo, Z.; Inorg. Chem. Comm. 2008,
11,1392.
38. Chen, L. M.; Liu, J.; Chen, J. C.; Shi, S.; Tan, C. P.; Zheng, K. C.; Ji, L. N.; J. Mol. Struct. 2008, 881, 156.
39. Keck, M. V.; Lippard, S. J.; J. Am. Chem. Soc. 1992,114, 3386. 40. Mitsopoulou, C. A.; Dagas, C. E.; Makedonas, C.; J. Inorg.
Biochem.2008, 102, 77.
41. Tian, T.; Mutikainen, I.; Gilles, P. van W.; Aliaga-Alcalde, N.; Reedijk, J.; J. Inorg. Biochem. 2009, 103, 1221.
42. Keene, F. R.; Smith, J. A.; Collins, J. G.; Coord. Chem. Rev.
2009, 253, 2021.
43. Otero, L.; Smircich, P.; Vieites, M.; Ciganda, M.; Cardoso, S. P.; Terenzi, H.; Cerecetto, H.; Gambino, D.; Garat, B.; J. Inorg.
Biochem. 2007, 101, 74.
44. Xu, Z.; Zhang, Y.; Xue, Z.; Yang, X.; Wu, Z.; Guo, Z.; Inorg.
Chim. Acta2009, 362, 2347.
45. Halámiková, A.; Heringová, P.; Kašpárková, J.; Intini, F. P.; Natile, G.; Nemirovskic, A.; Gibsonc, D.; Brabec, V.; J. Inorg.
Biochem. 2008, 102, 1077.
46. Brabec, V.; Christois, P.; Slámová, M.; Kostrhunová, H.; Nováková, O.; Najajreh, Y.; Gibson, D.; Kašpárková, J.;
Biochem. Pharmacol. 2007, 73, 1887.
47. Liu, Y.; Ramamurthy, N. S.; Marecek, J.; Lee, H. M.; Chen, J. L.; Ryan, M. E.; Rifkin, B. R.; Golub, L. M.; Curr. Med. Chem. 2001,8,243.
Su
pp
le
m
enta
ry
Inf
or
m
ati
on
0103 - 5053 $6.00+0.00
*e-mail: [email protected]
# Present Address: Instituto de Química, Universidade Federal de
Uber-lândia, Brazil
Platinum(II) Compounds of Tetracyclines as Potential Anticancer Agents:
Cytotoxicity, Uptake and Interactions with DNA
Priscila P. Silva,a Flávia C. S. de Paula,a Wendell Guerra,a ,# Josianne N. Silveira,b
Françoise V. Botelho,c Leda Q. Vieira,c Tiago Bortolotto,dFranciele L. Fischer,d
Giselle Bussi,d Hernán Terenzid and Elene C. Pereira-Maia*,a
aDepartamento de Química, bDepartamento de Análises Clínicas e Toxicológicas, cDepartamento de Bioquímica e Imunologia, Universidade Federal de Minas Gerais,
Av. Antônio Carlos, 6627 - Pampulha, 31270-901 Belo Horizonte - MG, Brazil dCentro de Biologia Molecular Estrutural, Departamento de Bioquímica, Universidade Federal de Santa Catarina, Campus Reitor João David Ferreira Lima,
Bairro Trindade, 88040-970 Florianópolis - SC, Brazil
Figure S2. ESI-MS spectrum of complex 1 in positive mode.
![Figure 1. Proposed structures for compounds 1, [PtCl 2 (dox)], and 2, [PtCl 2 (tc)].8899 1010 77 66 121255 11 22 3344OHOHOOH COOCH3 NH 2 O PtDCBA11 Cl ClNCH3H3CH+HO88991010776612125511223344OHOHOOHCOOCH3NH2OPtDCBA11Cl ClOHNCH3H3C+HComplex 1Comple](https://thumb-eu.123doks.com/thumbv2/123dok_br/18994158.461665/2.892.486.760.108.462/proposed-structures-compounds-ohohooh-ohohoohcooch-optdcba-clohnch-hcomplex.webp)