Impact of Democratic/Non-Democratic Regimes on
Foreign Direct Investment in Pakistan: Pre and Post
September 11, 2001 Scenarios
Tahir Nawaz (Corresponding Author)
Lecturer, Department of Statistics, The Islamia University of Bahawalpur, Pakistan E-mail: [email protected]
Masood Amjad khan
Associate Professor, Department of Statistics, Government College University, Lahore, Pakistan
Muhammad Akbar Ali Shah
Associate Professor, Department of Statistics, The Islamia University of Bahawalpur, Pakistan
E-mail: [email protected] Muhammad Aleem
Chairman and Professor Department of Statistics, The Islamia University of Bahawalpur, Pakistan
E-mail: [email protected] Abstract
1. Introduction
Foreign direct investment is a form of international capital flows (Assaf and Efrain, 2007). Pakistan being a developing country requires FDI to develop its different sectors like Industrial Sector, Agricultural Sector, Science and Technology, and to reduce unemployment in order to emerge as a developed country. The importance of FDI can be judged from the rapid growth of the neighboring countries of Pakistan like China and India which are the economic hub of Asia and are receiving the bulk of foreign investment. There are many factors in economic theory which can affect FDI like Foreign Exchange Rate (EXR), Foreign Exchange Reserves, Inflation Rate (CPI), Trade Balance, Privatization Policies, Local Investments, Natural Resources, Political stability, Competitiveness, infrastructure and etc. Pakistan has the history of politically unstable country as frequent Non-Democratic takeover and an ordinary law and order situation abandoned the FDI inflows in Pakistan. Moreover, the tense situation on borders especially on Eastern borders after September 11, 2001 incident and more recently the war against terror also played its part. It is reported in the Pakistan Economic Survey 2001-2003 that FDI decreased by 66.5 % in 2001. Only in period of three months (October – December 2001), Pakistan has lost billions in exports and imports orders that resulted in the increase in unemployment and deterioration in capital and current account deficit (Khan, 2001).
Bulk of literature is available on the impact of FDI in a country’s economic growth. Dondeti and Mohany (2007) report that foreign direct investment promotes economic growth, and further provided an estimate that one dollar of FDI adds about 3.27 dollars in GDP of each of the four countries China, India, Malaysia and Singapore. (Minjung (2004) reported that inconsistent causal relationship exists between FDI inflow and GDP growth. It is found that FDI cannot be considered as an independent variable for GDP growth ignoring other important factors that contributes to economic growth in the long run and shocks in GDP are tend to be explained by its own shocks, which mean that FDI has a little effect on variance of GDP. Impulse response function depicts that response of FDI to a shock in GDP is not significant. As far as the case of Pakistan is concerned Khan (2007); Falki (2009) and Mahmud (2009) investigated the impact of FDI on GDP and found it a significant factor along with other factors. Ghumro and Hakro (2007) reported that the stability of macroeconomic indicators, country’s risk profile, improved environment for investment and cost related factors are the real determinants for attraction of FDI.
Non-Democratic regimes are likely to reduce the capital formation and domestic saving ratios, foreign direct investment and the pace of economic growth. Moreover, the share of Government Expenditures in the GDP, monetary growth and the inflation rate tend to rise. Non-Democratic regimes generally worsen the balance of payments and the current account deficit (Odedokun, 1995).
69
Price moments (CPI), wage rate, skilled and educated labor can also be a significant factor for attracting FDI inflows in developing countries like Pakistan. Usually CPI is very high in developing countries and it attracts the foreign investors to invest (Hara and Razafimaheefa, 2005 and Jaumotte, 2004).
2. Methodological Framework and Data
The variables; foreign direct investment (FDI), foreign exchange rate (EXR), consumer price index number (CPI) and two dummy variables, one for the incidence of September 11, 2001 incident and there after war on terror (
D
1 ) and other for Democratic or Non-Democratic rule (D
2 ) are used in this study. Quarterly based data over the period of 1976Q1 to 2006Q4 for the variable FDI, EXR and CPI is obtained from International Financial Statistics (IFS) CD-ROM 2008. This study is divided into two parts to investigate the pattern of FDI, one is scenario of pre-September 11, 2001 and the other is post September 11, 2001 scenario (including pre-September 11, 2001 observations). At first, a well known econometric technique, Step wise regression is employed to get an idea about the relationship between the variables. Then more advanced techniques, like ARIMA models and GARCH models are employed to estimate the mean as well as variation in FDI.2.1 Pre September 11, 2001 Scenario
Along with Step-wise regression we have employed Box and Jenkins (1970) methodology for pre September 11, 2001 scenario by including explanatory variables along with the conventional AR and MA terms.
2 2
0 1 t 2 2 t 1 3 4 5 2 t
FDI
FDI
CPI
EXR
D
Where
t/
I
t1~
N
(0, )
h
t (1)2
FDI
is 2nd order stationary series of FDI;D
2 is the dummy variable for Democratic / Non-Democratic rule.
EXR
represents the 1st difference series of foreign exchange rate (EXR) where as
CPI
represents the 1st difference series of CPI.
2FDI
t2 is the AR(2) termwhereas
t1 is the MA(1) term included in the model.2.2 Post September 11, 2001 Scenario
2 2
0 1 t 2 2 t 1 3 4 1 5 2 t
FDI
FDI
EXR
D
D
t/
I
t1~
N
(0, )
h
t
h
t
0 1EXR
2CPI
3D
1
4D
2
t21
h
t1 (2) Where 2FDI is 2nd order stationary series of FDI.D D
1,
2 are the dummy variables for September 11, 2001 incident and thereafter war against terror and Democratic / Non-Democratic rule respectively.
EXR
represent the 1st difference series of foreign exchange rate (EXR) where as
CPI
represents the 1st difference series of CPI.
2FDI
t2 is the AR(2) term whereas
t1 is the MA(1) term included in the model.I
t is representing the information set through timet
1
;
t is the error term. Model-2 consists of 3 equations, equation (1) of the model (the “mean” equation) analyzes
2FDI
as a function of exchange rate effect (EXR), dummy variablesD D
1,
2 effect and also the effect of MA(1) and AR(2); equation (2) explains that the residuals of the fitted regression will be modeled as a GARCH process; and equation (3) models the conditional FDI volatility,h
t, as a function of ARCH and GARCH effects, dummy variables, exchange rate and CPI. The parameters of the fitted model will be estimated by using the Quasi-Maximum Likelihood (QML) approach developed by Bollerslev and Wooldridge (1992), which provides standard errors which are robust to non-normality in the density function that underlying the residuals.3. Empirical Results
In this section we will discuss in detail the results obtained after the analysis of the data by employing the methodological framework explained in Section-2.
3.1 Pre September 11, 2001 Scenario
71
Table 1: ANOVA Table by Step-wise Regression Analysis (Pre September 11 Scenario)
Model
Sum of
Squares df Mean Square F-value Sig.
1
Regression 78004.349 1 78004.349 3370.035 .000 Residual 2337.792 101 23.146
Total 80342.141 102
2
Regression 79037.479 2 39518.740 3029.041 .000 Residual 1304.662 100 13.047
Total 80342.141 102
3
Regression 79092.305 3 26364.102 2088.311 .000
Residual 1249.836 99 12.625
Total 80342.141 102
Table 2: Coefficients of model selection by Step-wise Regression (Pre September 11 Scenario)
Model
Un-standardized
Coefficients
Standardized Coefficients
t-value Sig. B
Std.
Error Beta 1
(Constant) 1.547*** .919 1.684 .095
exchange rate 1.898* .033 .985 58.052 .000
2
(Constant) 1.940* .691 2.807 .006
exchange rate 1.714* .032 .890 53.482 .000 consumer price index .061* .007 .148 8.899 .000
3
(Constant) 3.321* .949 3.498 .001
exchange rate 1.716* .032 .891 54.401 .000 consumer price index .054* .008 .130 7.016 .000 dummy
Democratic/Non-Democratic -1.762** .846 -.032 -2.084 .040 Note: *, ** and *** shows the significance at 1%, 5% and 10%level of Significance
The diagnostic checks which are not reported here but can be made available on demand, shows the existence of the problem of auto correlation and hetroskedasticity. Moreover, the value of R2 is also found to be greater than the value of Durbin Watson d-statistic which is an indication of spurious regression. Therefore, there is strong evidence for inclusion of some autoregressive terms in the model, which leads us to use well known Box and Jenkins (1970) methodology. The pre-requisite of Box-Jenkins methodology is the stationarity of the variables. The series FDI is stationary at second difference while EXR and CPI are stationary at first difference. We tried various models but only two models are being reported.
Table 3: Results of ARIMA Models for FDI (Pre September 11 Scenario)
Variables Model -I Model-II
Coefficients t-stat P-value Coefficients t-stat P-value
Constant 0.0836* 5.9402 0.0000 0.0812* 5.6579 0.0000 2
D
-0.0587* -4.9845 0.0000 -0.0577* -4.7479 0.0000D(EXR) -0.0976* -5.7573 0.0000 -0.0936* -5.4774 0.0000
D(CPI) 0.0023** 2.0053 0.0479 0.0021*** 1.8744 0.0640
AR(1) 0.0874 0.3566 0.7221 --- --- ---
MA(4) 0.2994* 3.566 0.0006 0.2655* 3.1319 0.0023
MA(2) -0.4957** -2.0770 0.0406 -0.7135* -7.3823 0.0000
MA(1) -0.7892* -3.4644 0.0008 -0.5366* -4.1595 0.0001 Diagnostic Checks
73 Ljung–Box Q-stata.
Q(5) 03.298 (0.069)
Q(10) 10.184 (0.117)
Q(15) 15.036 (0.181)
Q2(5) 03.836 (0.050)
Q2(10) 13.331 (0.038)
Q2(15) 15.349 (0.167)
03.521 (0.172) 10.396 (0.167) 15.457 (0.217) 03.485 (0.175) 14.339 (0.054) 16.671 (0.162)
Skewness 0.236 0.250 Kurtosis 2.759 2.810 Jarque–Bera test Prob. 0.558 0.558 Notes: ( a ). Figures in parentheses are numbers of lags.
( b). *, ** and *** shows the significance at 1%, 5% and 10%level of Significance respectively.
From the results reported in Table-3 shows that in Model-I except the term AR(1), rest of the coefficients are statistically significant. The negative sign of
D
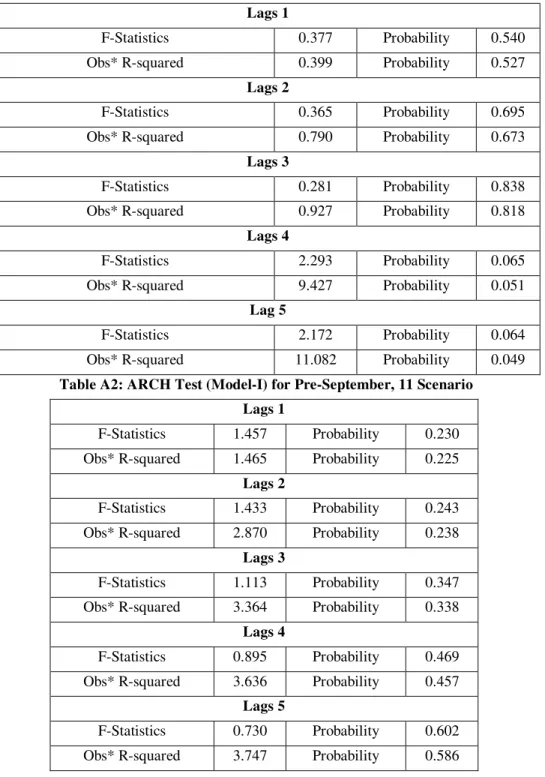
2 shows the impact of non-democratic takeovers is severely bad on the FDI in Pakistan. Similarly the depreciation of the local currency also has a negative impact on FDI in pre September 11, 2001 scenario. However, the impact of CPI is positive which means that higher CPI will have a positive impact on FDI. The Ljung-Box (1978) Q-stats and the Breusch Godfrey Serial Correlation LM-Test, presented in Table-A1 in Appendix-A, shows the problem of autocorrelation which stimulates that we should improve our modelIn Model-II, we have eliminated AR (1) term as it is insignificant in Model-I. All the variables in Model-II are also significant and the nature of impact of these variables on FDI is same as in Model-I. The S.E of regression, AIC and SBC have been improved as compared to Model-I. The problem of auto correlation has also been removed as indicated by the Ljung-Box Q-stats and Breusch Godfrey Serial Correlation LM-Test (Table A3). Moreover, the ARCH effect has also been removed as indicated by the ARCH-LM Test (Table-A4) and Q2-Stats.
3.2 Post September 11, 2001 Scenario
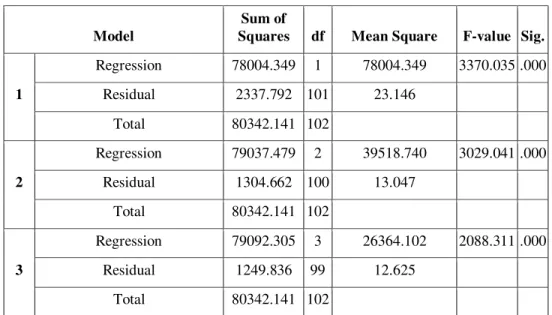
Table 4: ANOVA Table by Step-wise Regression Analysis (Post September 11 Scenario)
Model Sum of Squares Df Mean Square F Sig.
1
Regression 169117.014 1 169117.014 3725.180 .000
Residual 5538.599 122 45.398
Total 174655.613 123
2
Regression 172121.109 2 86060.554 4108.625 .000
Residual 2534.504 121 20.946
Total 174655.613 123
3
Regression 172365.166 3 57455.055 3010.157 .000
Residual 2290.447 120 19.087
Total 174655.613 123
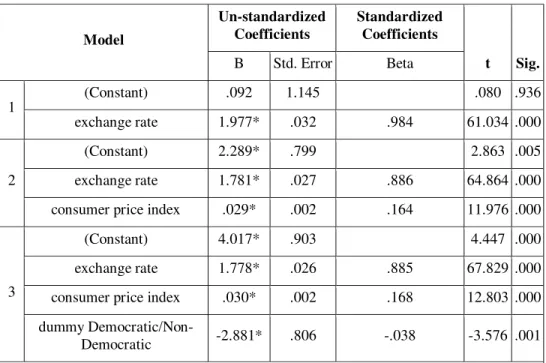
Table 5: Coefficients of model selection by Step-wise Regression (Post September 11 Scenario)
Model
Un-standardized Coefficients
Standardized Coefficients
t Sig. B Std. Error Beta
1 (Constant) .092 1.145 .080 .936
exchange rate 1.977* .032 .984 61.034 .000
2
(Constant) 2.289* .799 2.863 .005
exchange rate 1.781* .027 .886 64.864 .000 consumer price index .029* .002 .164 11.976 .000
3
(Constant) 4.017* .903 4.447 .000
exchange rate 1.778* .026 .885 67.829 .000 consumer price index .030* .002 .168 12.803 .000 dummy
75
The results show that the dummy variable for September 11, 2001 has been eliminated and the significance and nature of EXR and CPI is same as in the case in pre-September 11 scenario. However, there is also a problem of autocorrelation and presence of ARCH effect in this model and the value of R2 is also found to be greater than the value of Durbin Watson d-statistic which is an indication of spurious regression We then tried ARIMA models (which are not reported in this paper) but the problem of ARCH effect could not be sorted out and finally the GARCH type models are employed to effectively overcome this problem. Various GARCH models were tried out but only two are reported here.
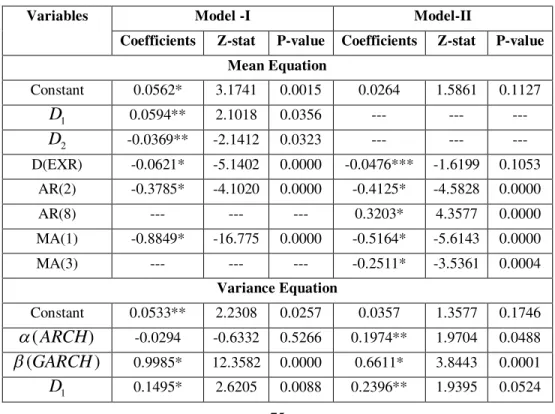
The results are reported in Table-6, the mean equation of Model-I show that all the parameters estimated are statistically significant at 5% level of significance. The variable D2 has negative significant impact which means that the transition from Democratic to Non-Democratic government causes decrease in FDI. Same is the case with exchange rate. By increasing the EXR, depreciating local currency, the FDI is decreased. However,
1
D
has a positive significant impact, which indicates that inflows of FDI in Pakistan have been increased due to the September 11, 2001 incident and on-going war against terrorism.The variance equation of this model has some problems. The negative insignificant ARCH term indicates improper specification of the model and needs improvement. The low value of Durbin-Watson statistic (1.5362) and Ljung Box Q-statistic shows the presence of autocorrelation. Moreover, Table B-1 in Appendix-B shows significant ARCH effect at lag 2.
Table 6: Results of GARCH Models for FDI (Post September 11 Scenario)
Variables Model -I Model-II
Coefficients Z-stat P-value Coefficients Z-stat P-value Mean Equation
Constant 0.0562* 3.1741 0.0015 0.0264 1.5861 0.1127 1
D
0.0594** 2.1018 0.0356 --- --- ---2
D
-0.0369** -2.1412 0.0323 --- --- ---D(EXR) -0.0621* -5.1402 0.0000 -0.0476*** -1.6199 0.1053 AR(2) -0.3785* -4.1020 0.0000 -0.4125* -4.5828 0.0000
AR(8) --- --- --- 0.3203* 4.3577 0.0000
MA(1) -0.8849* -16.775 0.0000 -0.5164* -5.6143 0.0000
MA(3) --- --- --- -0.2511* -3.5361 0.0004
Variance Equation
Constant 0.0533** 2.2308 0.0257 0.0357 1.3577 0.1746
(
ARCH
)
-0.0294 -0.6332 0.5266 0.1974** 1.9704 0.0488(
GARCH
)
0.9985* 12.3582 0.0000 0.6611* 3.8443 0.0001 12
D
-0.0389** -2.3297 0.0198 --- --- ---D(EXR) -0.0418* -2.6331 0.0085 --- --- ---
D(CPI) -0.0023* -2.9843 0.0028 -0.0016* -4.8965 0.0000 Diagnostic Checks
S.E. of regression 0.6454 0.6104 Log Likelihood -90.2642 -84.3670
Table 6: Continued…
Durban-Watson Stat 1.5362 2.0578 Akaike info Criterion 1.7211 1.7183 Schwarz Criterion 2.0230 1.9868 F-Statistic 4.6055 6.0043 Probability 0.0000 0.0000
Ljung–Box Q-stata.
Q(5) 8.8203 (0.032) Q(10) 18.629 (0.017) Q(15) 26.559 (0.014) Q2(5) 07.957 (0.047) Q2(10) 12.814 (0.118) Q2(15) 16.203 (0.238)
2.9096 (0.088) 6.2737 (0.393) 14.371 (0.213) 0.7788 (0.378) 6.4423 (0.332) 9.3774 (0.587) Skewness 0.292 0.268 Kurtosis 2.745 3.091 Jarque–Bera test Prob. 0.361 0.502
Notes: (a). Figures in parentheses are numbers of lags.
(b)*, ** and *** shows the significance at 1%, 5% and 10%level of Significance respectively.
77
incident and on-going war on terror, the volatility in foreign direct investment is increased by 0.239. Moreover, negative sign of D (CPI) indicates that the volatility in foreign direct investment is decreases by 0.001 due to CPI.
The S.E of regression and the sum of squared residuals of this model is less than that of previous model-I. Moreover, AIC and SBC and Log Likelihood have also been improved. The ARCH and GARCH effects, both are positive and significant, indicating the satisfaction of standard test of robustness of the Model-II. The GARCH effect
(
0.661)
is comparatively a bit higher than the ARCH effect(
0.197)
which describes that the shocks to the conditional variances are quite persistent. Furthermore, the model is showing stability as the sum of ARCH and GARCH terms is less than one, that is(
1)
.4. Conclusion and Recommendations
The step-wise regression is used to get an idea about the relationship between the variables and for the justification of using auto-regression models. We tried to overcome the problem of auto-correlation and hetroskedastic residuals that we face during fitting step-wise regression but the problem could not be fully resolved which stimulates us to use GARCH models.
There are some policy implications of this study which can be useful in attraction of foreign direct investment in Pakistan. The State bank of Pakistan should strictly monitor the foreign exchange rate and should take necessary steps to stop the depreciation and to stabilize the local currency against dollar in order to build the confidence of the foreign investors moreover, the continuous depreciation in local currency give rise to inflation. The non-democratic takeovers also increase the volatility in foreign direct investment therefore these should be avoided.
REFERENCES
Aggarwal, J.P.I. (1980). Determinants of Foreign Direct Investment, welsirstchaftiches Archiv,116, 739-773.
Aqeel, A. and Nishat, M. (2004). The determinants of foreign direct investment in Pakistan. The Pakistan Development Review, 43, 651-664.
Assaf and Efrain (2007), Foreign Direct Investment: An analysis of aggregate flows.
Princeton: Princeton University Press.
Bollerslev, T and Jeffery M.W. (1992), Quasi-Maximum Likelihood Estimation and Inference in Dynamic Models with Time Varying Co-variances. Econometric Reviews, 11, 143-172.
Bollerslev, T. (1986). Generalized Auto Regressive Conditional Hetroskedasticity.
Journal of Econometrics, 31, 307-327.
Box, G.E.P and Pierce, D.A. (1970). Distribution of the residual autocorrelations in autoregressive-integrated moving-average time series models. Journal of the American Statistical Association, 65, 1509-1526.
Box, G.E.P. and Jenkins, G.M. (1970). Time Series Analysis, Forecasting and Control.
San Francisco, CA: Holden-Day.
Brzozowski, M. (2003), Exchange Rate Variability and Foreign Direct Investment – Consequences of EMU Enlargement, © CASE – Centre for Social and Economic Research, Warsaw, ISSN 1506-1701, ISBN: 83-7178-313-2.
Dondeti, V.R. and Mohanty B.B. (2007). Impact of Foreign Direct Investment on the Gross Domestic Product, Exports and Imports of Four Asian Countries. Delhi Business Review,8(1), 3-23.
Ghumro , A.A. and Hakro, A.N. (2007). Foreign Direct Investment, Determinants and Policy Analysis: Case Study of Pakistan. Paper provided by Department of Economics, University of Glasgow in its series [Working Papers] with number 2007_04.
Haider, M. (2009), Application of Endogenous Growth Model to the Economy of Pakistan: A Cointegration Approach. Pakistan Journal of Commerce and Social Sciences, 2, 16-24.
79
Khan, M.A (2007). Foreign Direct Investment and Economic Growth: The Role of Domestic Financial Sector, PIDE [working Papers] 2007:18
Kyereboah-Coleman, A. and Agyire-Tettey, K.F. (2008). Effect of exchange-rate volatility on foreign direct investment in Sub-Saharan Africa: the case of Ghana. (Case study). Journal of Risk Finance, 9, 52-70.
Ljung G.M. and Box, G.E.P. (1978). On a Measure of a Lack of Fit in Time Series Models. Biometrika, 65, 297-303.
Minjung, K. (2004). Does a causal link exists between foreign direct investment and economic growth in asia nies, A thesis presented to the faculty of international studies of Ohio University.
Nawaz, T. (2009). Impact of Civil/Military Rule on FDI before and after September 11, 2001 and Forecast Model for FDI, [Unpublished M.Phil thesis], Govt. College University Lahore.
Nuzhat, F. (2009). The Impact of Foreign Direct Investment on Economic Growth in Pakistan. Presented in 10th International Business Research Conference, Dubai, 16-17 April, 2009.
Appendix-A
Table A1: Breusch Godfrey Serial Correlation LM-Test (Model-I) for pre-September, 11 Scenario
Lags 1
F-Statistics 0.377 Probability 0.540
Obs* R-squared 0.399 Probability 0.527
Lags 2
F-Statistics 0.365 Probability 0.695
Obs* R-squared 0.790 Probability 0.673
Lags 3
F-Statistics 0.281 Probability 0.838
Obs* R-squared 0.927 Probability 0.818
Lags 4
F-Statistics 2.293 Probability 0.065
Obs* R-squared 9.427 Probability 0.051
Lag 5
F-Statistics 2.172 Probability 0.064
Obs* R-squared 11.082 Probability 0.049
Table A2: ARCH Test (Model-I) for Pre-September, 11 Scenario Lags 1
F-Statistics 1.457 Probability 0.230 Obs* R-squared 1.465 Probability 0.225
Lags 2
F-Statistics 1.433 Probability 0.243 Obs* R-squared 2.870 Probability 0.238
Lags 3
F-Statistics 1.113 Probability 0.347 Obs* R-squared 3.364 Probability 0.338
Lags 4
F-Statistics 0.895 Probability 0.469 Obs* R-squared 3.636 Probability 0.457
81
Table A3: Breusch Godfrey Serial Correlation LM-Test (Model-2) for pre-September, 11 Scenario
Lags 1
F-Statistics 0.066 Probability 0.797 Obs* R-squared 0.049 Probability 0.823
Lags 2
F-Statistics 0.161 Probability 0.851 Obs* R-squared 0.329 Probability 0.848
Lags 3
F-Statistics 0.126 Probability 0.944 Obs* R-squared 0.395 Probability 0.941
Lags 4
F-Statistics 2.235 Probability 0.071 Obs* R-squared 9.108 Probability 0.058
Lags 5
F-Statistics 1.932 Probability 0.096 Obs* R-squared 9.872 Probability 0.078
Table A4: ARCH Test (Model-II) for Pre- September, 11 Lags 1
F-Statistics 1.490 Probability 0.225 Obs* R-squared 1.498 Probability 0.220
Lags 2
F-Statistics 1.296 Probability 0.278 Obs* R-squared 2.603 Probability 0.272
Lags 3
F-Statistics 0.997 Probability 0.397 Obs* R-squared 3.024 Probability 0.387
Lags 4
F-Statistics 0.815 Probability 0.518 Obs* R-squared 3.322 Probability 0.505
Lags 5
Appendix-B
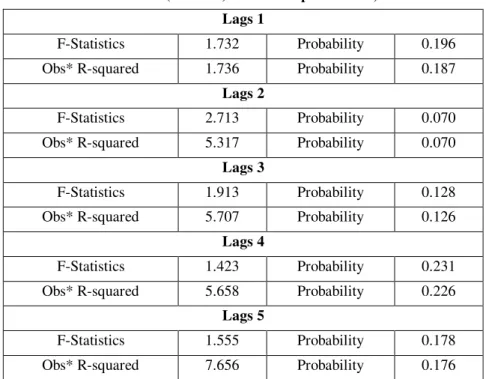
Table B1: ARCH Test (Model-I) for Post-September 11, 2001 Scenario Lags 1
F-Statistics 1.732 Probability 0.196 Obs* R-squared 1.736 Probability 0.187
Lags 2
F-Statistics 2.713 Probability 0.070 Obs* R-squared 5.317 Probability 0.070
Lags 3
F-Statistics 1.913 Probability 0.128 Obs* R-squared 5.707 Probability 0.126
Lags 4
F-Statistics 1.423 Probability 0.231 Obs* R-squared 5.658 Probability 0.226
Lags 5
F-Statistics 1.555 Probability 0.178 Obs* R-squared 7.656 Probability 0.176 Table B2: ARCH Test (Model-II) for Post-September 11, 2001 Scenario
Lags 1
F-Statistics 0.0085 Probability 0.926 Obs* R-squared 0.0086 Probability 0.925
Lags 2
F-Statistics 0.0397 Probability 0.961 Obs* R-squared 0.0817 Probability 0.959
Lags 3
F-Statistics 0.0976 Probability 0.9611 Obs* R-squared 0.303 Probability 0.959
Lags 4