Accounting for Experimental Noise Reveals
That mRNA Levels, Amplified by
Post-Transcriptional Processes, Largely Determine
Steady-State Protein Levels in Yeast
Gábor Csárdi1☯, Alexander Franks1☯, David S. Choi1, Edoardo M. Airoldi1,2
*, D. Allan Drummond3,4*
1Dept. of Statistics, Harvard University, Cambridge, Massachusetts, United States of America,2The Broad Institute of Harvard & MIT, Cambridge, Massachusetts, United States of America,3Dept. of Biochemistry & Molecular Biology, University of Chicago, Chicago, Illinois, United States of America,4Dept. of Human Genetics, University of Chicago, Chicago, Illinois, United States of America
☯These authors contributed equally to this work.
*[email protected](EMA),[email protected](DAD)
Abstract
Cells respond to their environment by modulating protein levels through mRNA transcription and post-transcriptional control. Modest observed correlations between global steady-state mRNA and protein measurements have been interpreted as evidence that mRNA levels de-termine roughly 40% of the variation in protein levels, indicating dominant post-transcrip-tional effects. However, the techniques underlying these conclusions, such as correlation and regression, yield biased results when data are noisy, missing systematically, and
collin-ear—properties of mRNA and protein measurements—which motivated us to revisit this
subject. Noise-robust analyses of 24 studies of budding yeast reveal that mRNA levels ex-plain more than 85% of the variation in steady-state protein levels. Protein levels are not proportional to mRNA levels, but rise much more rapidly. Regulation of translation suffices to explain this nonlinear effect, revealing post-transcriptional amplification of, rather than competition with, transcriptional signals. These results substantially revise widely credited models of protein-level regulation, and introduce multiple noise-aware approaches essen-tial for proper analysis of many biological phenomena.
Author Summary
Cells respond to their environment by making proteins using transcription and translation of mRNA. Modest observed correlations between global steady-state mRNA and protein measurements have been interpreted as evidence that mRNA levels determine roughly 40% of the variation in protein levels, indicating dominant post-transcriptional effects. However, the techniques underlying these conclusions, such as correlation and regression, yield biased results when data are noisy and contain missing values. Here we show that
a11111
OPEN ACCESS
Citation:Csárdi G, Franks A, Choi DS, Airoldi EM, Drummond DA (2015) Accounting for Experimental Noise Reveals That mRNA Levels, Amplified by Post-Transcriptional Processes, Largely Determine Steady-State Protein Levels in Yeast. PLoS Genet 11 (5): e1005206. doi:10.1371/journal.pgen.1005206
Editor:Michael Snyder, Stanford University School of Medicine, UNITED STATES
Received:June 24, 2014
Accepted:April 10, 2015
Published:May 7, 2015
Copyright:© 2015 Csárdi et al. This is an open access article distributed under the terms of the Creative Commons Attribution License, which permits unrestricted use, distribution, and reproduction in any medium, provided the original author and source are credited.
Data Availability Statement:All raw input and processed output data have been uploaded to Dryad as indicated in the manuscript. doi:10.5061/dryad. rg367; doi:10.5061/dryad.d644f
when methods that account for noise are used to analyze much of the same data, mRNA levels explain more than 85% of the variation in steady-state protein levels. Protein levels are not proportional to mRNA levels as commonly assumed, but rise much more rapidly. Regulation of translation achieves amplification of, rather than competition with, tran-scriptional signals. Our results suggest that for this set of conditions, mRNA sets protein-level regulation, and introduce multiple noise-aware approaches essential for proper anal-ysis of many biological phenomena.
Introduction
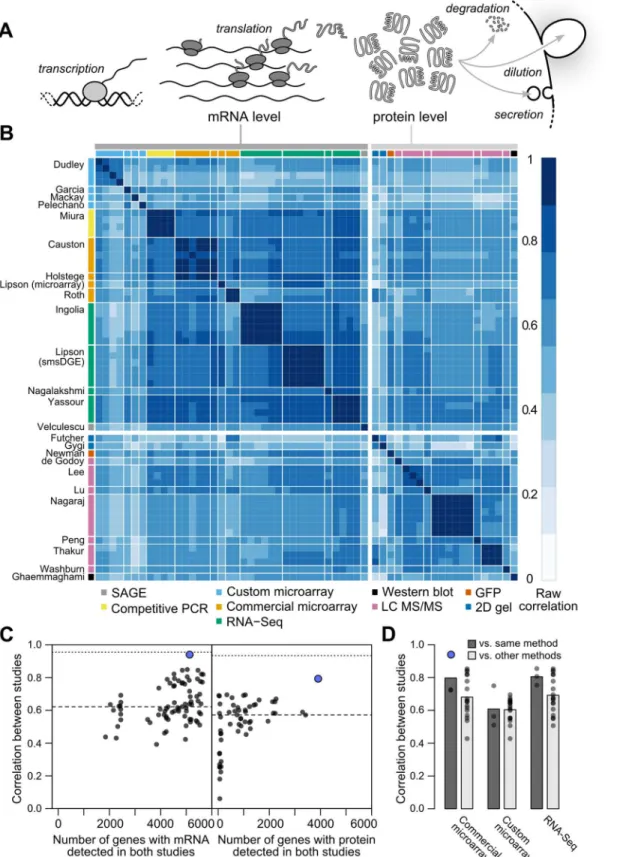
Cellular protein levels reflect the balance of mRNA levels, protein production by translation initiation and completion, and protein removal by degradation, secretion, and dilution due to growth [1–3](Fig 1A). A standard quantitative model for protein-level regulation [4,5] is
@Pi
@t ¼tiMi diPi ð1Þ
wherePiis the cellular protein level (molecules per cell) of genei,Miis the mRNA level, andτi andδiare the mRNA translation and net protein removal rates, respectively. According to this model, at steady-state, protein levels will be proportional to mRNA levels with proportionality constants ofτi/δi:
Pi ¼
ti
diMi ð2Þ
such that if rates of translation and removal did not vary by gene, and in the absence of experi-mental noise or other variation, steady-state mRNA and protein levels would correlate perfect-ly [1]. Consequently, the mRNA–protein correlation observed in global measurements of mRNA and protein levels has been intensely studied, and deviations from perfect correlation used to quantify the contribution of post-transcriptional processes to cellular protein levels [1,3,6–9].
The consensus across these studies holds that, in a wide array of organisms, transcriptional regulation explains 30–50% of the variation in steady-state protein levels, leaving half or more to be explained by post-transcriptional regulatory processes [3,7,9–16]. Higher correlations are observed, generally for subsets of less than half the genome [1,9,17]. Low observed mRNA–protein correlations have motivated the search for alternate forms of regulation capa-ble of accounting for the majority of protein-level variability [3,9,13]. In one proposal, mRNA levels serve mainly as an on-off switch for protein expression, imposing coarse control over protein levels which is then tuned by post-transcriptional mechanisms [9]. Recent studies have indeed uncovered wide between-gene variation in post-transcriptional features such as inferred translation rates [18] and protein degradation rates [3].
However, as frequently noted [1,7,9,10,19–21], noise in measurements can cause many of the observations attributed to post-transcriptional regulation. Here, noise encompasses vari-ability due to cell-to-cell variation, growth conditions, sample preparation and other effects due to experimental design [22], and measurement biases and error [10,21,23]. Uncorrelated noise between mRNA and protein measurements will reduce the observed mRNA–protein cor-relation relative to the true value [24], while inflating the variation in measurements of transla-tional efficiency and other post-transcriptransla-tional processes.
Most studies, particularly of protein levels, cover only a subset of known genes, due to fac-tors such as signal-to-noise limitations, method biases, and continual revision of the coding-se-quence annotations used to design and analyze assays. Limited and variable transcriptome and proteome coverage complicate analyses further, making it difficult to compare studies and to synthesize a holistic view of regulatory contributions. Missing data tends to reduce the preci-sion of estimates, if data are missing at random (MAR). However, most quantification methods are biased toward detection of more abundant mRNAs and proteins [9]. Data which are not missing at random (NMAR) in this way have reduced variance or restricted range. Range re-striction, in turn, tends to systematically attenuate (reduce in absolute magnitude toward zero) the observed correlations and regression coefficients relative to complete data [25,26]. That is, biased detection produces biased estimates of the mRNA–protein correlation, leading to incor-rect conclusions about regulatory contributions [27].
In many comparisons of the roles of transcriptional and post-transcriptional regulation, protein levels are correlated with or regressed on various predictors (mRNA level and half-life, codon usage, amino-acid usage,etc.) to determine relative contributions to protein-level varia-tion [1,3,4,14,18,21]. If mRNA levels are found to explain a certain percentage, sayX, in pro-tein levels, then the other predictors are asserted to explain no more than 100−Xpercent of the variance [3,9,21,28,29]. A basic assumption of such analyses is that transcriptional and post-transcriptional regulation vary independently between genes. Several of the same studies report that high-expression genes show signs of more efficient translation [3,4,18] (reviewed in [1]), raising concerns about the validity of this assumption.
A related assumption of these analyses, one encoded in the standard functional model above, is that mRNA and protein levels are proportionally or linearly related [1,5]; the slope of this line is the mean number of proteins per mRNA. More often, the data are plotted on a log-log scale, where linearity appears as a slope of 1. Consistent with this, ordinary least-squares linear regression shows that the slope is quite close to 1 forE. coli(0.96) and budding yeast (1.08) [17], and estimates of proteins per mRNA have been reported roughly constant across mRNA expression levels in a prominent study [30].
However, like correlations, slopes estimated by standard linear regression are biased down-ward by noise in mRNA level measurements, an effect calledregression dilution bias[31] which affects any regression where the independent variable is measured with error. A frequently en-countered case is that, given two measurementsXandY, the slope from regressingYonXis not the inverse of the slope of regressingXonY[32–34]; this is regression dilution bias at work. Consequently, linear regression cannot be used to estimate the functional relationship between mRNA and protein levels, raising the question of what the true functional relationship is. Use of nonparametric methods avoids assumptions of linearity [1], at the cost of destroying genu-ine information about the dynamic range of gene expression and its determinants.
Analytical solutions to many of these problems exist—notably, Spearman introduced a cor-rection for noise-induced attenuation of correlation estimates more than a century ago [24]—
yet have largely failed to find their way into the hands of groups carrying out gene-regulation experiments and analyses (with a few exceptions [15]). Some problems remain almost entirely unaddressed, such as providing accurate estimates of the functional relationship between vari-ables measured many times with correlated noise yielding variably and systematically missing values.
different methods (dark and light gray bars, respectively), using mRNA datasets with5000 genes (4,595 genes quantified by all datasets). For example, the second column from the left shows the 18 correlations between each of three commercial microarray studies and six studies using custom microarrays or RNA-Seq.
Here, we develop and integrate approaches to address all of these challenges, with the aim of providing more comprehensive and rigorous estimates of the relationship between mRNA and protein levels than have previously been possible. To do so, we take advantage of the rapid, continual progress made in global measurement of mRNA and protein levels by multiple meth-ods [6,17,30,35–41]. All of these methods were first employed at the genome scale in studies profiling gene expression during log-phase growth of budding yeast in rich medium, ade facto
standard. These studies often compare results against previous studies, evaluating agreement, precision, coverage, and dynamic range while pointing out relative advantages of each ap-proach (e.g.[17,18,30,37,38,40]).
Our efforts to synthesize these data into a coherent whole are grounded in the stance that all these works constitute measurements of the same underlying quantities—average mRNA and protein levels in a large cell population prepared under narrowly defined conditions—whether or not such measurements were the study goal. Systematic differences between approaches due to experimental choices will introduce variation which may not be distinguishable from simple inaccuracy in measurement. We treat this variation as experimental noise without prejudice. Distinctions between biological variability, measurement error, method bias, and other sources of noise are of course important, particularly in deciding how to control or manage noise. These distinctions may also depend on one’s perspective. For example, unintentional differ-ences in growth conditions may lead two groups following the same protocol to make measure-ments on samples which inevitably are, in truth, biologically different, such that error-free measurement would reveal differences in mRNA and protein levels. In one sense, these differ-ences reflect biological variability; in an equally valid sense, they represent experimental noise. Similarly, intentional protocol differences that are not meant to alter measurement accuracy (such as use of new methods intended to make measurements more precise), yet carry known and unknown biases, may also introduce noise. Here, we take an empirical approach to noise which does not involve divining intent. Versions of this approach are taken, often implicitly, by the many previous analyses that integrate experiments from multiple groups [8,9,17,18,30].
Our results reveal that, once noise is accounted for, mRNA and protein levels correlate much more strongly under these experimental conditions than previously appreciated, with a correlation coefficient ofr= 0.93. We find that protein levels are not proportional to mRNA levels, but instead are more steeply related, an effect we show is consistent with measurements of translational activity. Transcriptional and post-transcriptional regulation act in a concerted, non-independent manner to set protein levels, inconsistent with common attempts to divvy up and assign protein-level variance to each mechanism. As a byproduct, we generate what by sev-eral measures is the most complete and accurate quantitative transcriptome and proteome available, in average molecules per haploid cell, for this widely studied organism under these well-studied conditions. Finally, we highlight and introduce methods for analyzing correlations and functional relationships between measured data which may be used broadly.
Results
Correlations and coverage range widely across datasets
wide range of correlations between studies (Fig 1B, Pearson correlations on log-transformed values with zeros and missing values omitted).
Although correlations of replicates within studies are quite high [9], with medianr= 0.97 for mRNA and 0.93 for protein levels, between-study correlations are far more modest,r= 0.62 for mRNA measurements and 0.57 for protein measurements (Fig 1C). That is, data from a typical mRNA study explains 39% of the variance in another study (r2= 0.39) and a typical protein study’s results explain only 32% in another study’s variance, consistent with previous studies reporting wide variation between studies [16]. Strong outliers indicate high reproduc-ibility for a two pairs of studies (Fig 1C), but each such outlier is a correlation between separate studies done by the same research group, suggesting the presence of additional variability sources between groups. Coverage of the 5,887 verified protein-coding genes in yeast [42] also varies widely across pairs of studies (Fig 1C).
Coupled with high withstudy reproducibility, the low between-study reproducibility in-dicates the presence of large systematic errors between studies. In a single study [38], mRNA levels in a commercially prepared sample were measured using two methods, a commercial mi-croarray and single-molecule RNA sequencing. These measurements correlate withr= 0.86 (73% of the variance explained in one measurement by the other), quite similar to ther= 0.84
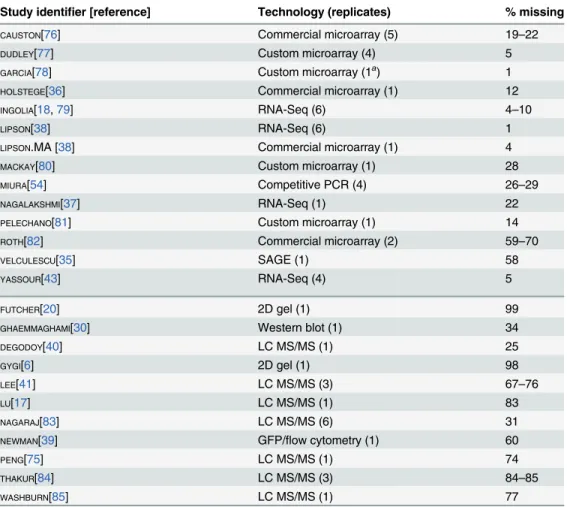
Table 1. Measurements of mRNA (above the midline) and protein (below the midline) analyzed using structured covariance modeling.
Study identifier [reference] Technology (replicates) % missing
CAUSTON[76] Commercial microarray (5) 19–22
DUDLEY[77] Custom microarray (4) 5
GARCIA[78] Custom microarray (1a) 1
HOLSTEGE[36] Commercial microarray (1) 12
INGOLIA[18,79] RNA-Seq (6) 4–10
LIPSON[38] RNA-Seq (6) 1
LIPSON.MA [38] Commercial microarray (1) 4
MACKAY[80] Custom microarray (1) 28
MIURA[54] Competitive PCR (4) 26–29
NAGALAKSHMI[37] RNA-Seq (1) 22
PELECHANO[81] Custom microarray (1) 14
ROTH[82] Commercial microarray (2) 59–70
VELCULESCU[35] SAGE (1) 58
YASSOUR[43] RNA-Seq (4) 5
FUTCHER[20] 2D gel (1) 99
GHAEMMAGHAMI[30] Western blot (1) 34
DEGODOY[40] LC MS/MS (1) 25
GYGI[6] 2D gel (1) 98
LEE[41] LC MS/MS (3) 67–76
LU[17] LC MS/MS (1) 83
NAGARAJ[83] LC MS/MS (6) 31
NEWMAN[39] GFP/flow cytometry (1) 60
PENG[75] LC MS/MS (1) 74
THAKUR[84] LC MS/MS (3) 84–85
WASHBURN[85] LC MS/MS (1) 77
a
Average of three replicates.
correlation of the single-molecule measurement with an independent RNA-Seq dataset on RNA from a different study [43]. These data hint, coupled with similar observations in other biological systems [44], that high within-study reproducibility is likely to reflect reproducible biases associated with use of a single measurement technique in addition to reproducible fea-tures of the biological sample.
Correlations are modest even between studies using similar methods (e.g.,r= 0.81 between two RNA-Seq datasets using Illumina instruments [18,43]). Comparing mRNA studies per-formed using similar or different methods on a shared set of 4,595 genes revealed a consistent bias toward higher median correlations between studies using similar methods, but these dif-ferences were not statistically distinguishable (Fig 1D, not-testP<0.05 for differences in cor-relation when comparing studies employing shared methods versus independent methods after false discovery rate correction).
Between-study correlations quantify the studies’mean ratio of true variance to total vari-ance, termed the reliability [15,45,46] (seeMethods). In turn, setting aside sampling error, the maximum observable correlation between any two datasets is equal to the geometric mean of their reliabilities. Because virtually all reported global mRNA–protein correlations involve mRNA and protein levels measured in separate studies, between-study reliabilities are the rele-vant quantity. The modest reliability values—setting aside those of the same group reporting two studies, which we exclude from this analysis—sharply limit the maximum observable mRNA–protein correlations. This limit has startling consequences: if steady-state mRNA and protein levels actually correlated perfectly (truer= 1.0), then given the median observed be-tween-study correlations inFig 1C, we would expect to observe mRNA–protein correlations of onlyr¼ ffiffiffiffiffiffiffiffiffiffiffiffiffiffiffiffiffiffiffiffiffiffiffi
0:570:62 p
¼0:60.
The data reveal a wide range of modest mRNA–protein correlations with a median of
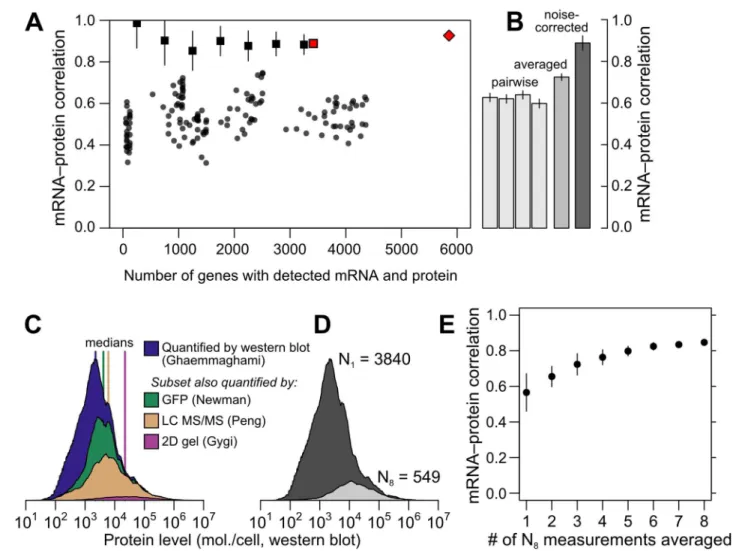
r= 0.54 (Fig 2A) quantified either by the Pearson correlation between log-transformed mea-surements or the nonparametric Spearman rank correlation (S1 Fig; both measures produce similar results and we employ the former throughout). The largest pair of datasets covers 4,367 genes and shows an mRNA–protein correlation ofr= 0.618 (r2= 0.38, 38% of protein-level variance explained by mRNA levels), close to consensus values [9]. The largest dataset contain-ing replicated measurements of mRNA and protein in at least two studies yields similar corre-lation values; notably, averaging paired measurements together and correlating the averages increases the apparent correlation (Fig 2B).
mRNA level (from 33% to 72%) simply by averaging together more measurements of the same genes. These data strongly indicate that experimental noise substantially reduces the apparent correlation between mRNA and protein levels.
Corrections for noise yield sharply higher correlation estimates
The foregoing analyses involve estimates uncorrected for noise, which as described in the In-troduction do not properly estimate the true correlation between the variables being measured. We will first incorporate noise-aware estimates of the true correlation, and then address the
Fig 2. Correlations between mRNA and protein levels vary widely and are systematically reduced by experimental noise.A, Datasets vary widely in coverage of 5,887 yeast coding sequences and in resulting estimates of the mRNA–protein correlation. Shown are all pairwise correlations between 14 mRNA and 11 protein datasets, with within-study replicates averaged if present. Correlations are shown between mRNA and protein levels reported without correction (dots); using Spearman’s correction on pairs of datasets (binned, boxes show mean and bars indicate standard deviation); using Spearman’s correction on the largest set of paired measurements (red box); and as estimated by structured covariance modeling for 5,854 genes with a detected mRNA or protein (red diamond). B, Correlations obtained for the largest set of paired measurements, two of mRNA and two of protein levels (N= 3,418), computed individually, after averaging, and after correcting for noise using Spearman’s correction. C, Data are missing non-randomly. The distribution of protein levels, in molecules per cell, detected by western blotting [30] are shown, along with the subsets of these data corresponding to proteins detected by GFP-tagging and flow cytometry [39], LC MS/MS [75], and 2D gel [6]. D, Distribution of protein-level measurements, assessed by western blotting [30], with at least one protein-level measurement (dark gray, number of genesN1= 3840) and in the subset of genes with at least 8 mRNA and 8 protein measurements (light gray, number of genesN8= 549). E, mRNA–protein correlations between averaged mRNA and protein levels over subsets of at most 1, 2, 3,. . ., 8 measurements
each of mRNA and protein levels drawn at random from theN8set. Error bars show the standard deviation of correlations from 50 random samples of the indicated number of measurements.
more challenging problem of accounting for missing data to arrive at a true genome-scale esti-mate of the mRNA–protein correlation.
Reduction of correlations by noise can be corrected using information from repeated mea-surements, assuming the noise is uncorrelated across measurements [24,46]. Quantitative cor-rections for correlation attenuation were first introduced more than a century ago by
Spearman [24], are widely used in the social sciences [46–48], and have found recent applica-tions in biology [15,45,49–52]. Given two measurements each of variablesXandY, each with uncorrelated errors, the true correlation can be estimated using only correlations between the four measurementsX1,X2,Y1,Y2(seeMethods):
^rtrue
XY ¼
4 ffiffiffiffiffiffiffiffiffiffiffiffiffiffiffiffiffiffiffiffiffiffiffiffiffiffiffiffiffiffiffiffiffiffi
rX1Y1rX2Y2rX1Y2rX2Y1
p
ffiffiffiffiffiffiffiffiffiffiffiffiffiffiffiffiffi rX1X2rY1Y2
p ð3Þ
The correction reflects a simple intuition: the denominator quantifies the reliabilities of the measurements, which determine the maximum observable correlation, and the numerator quantifies the observed correlation using a geometric mean of four estimates and is divided by this maximum value to yield an estimate for the true value. The estimate is not itself a correla-tion coefficient, and may take values outside (−1,1) due to sampling error [46]. Also note that there is noP-value associated with this estimate; statistical testing for significant association using uncorrected correlation measures remains valid.
To demonstrate and test Spearman’s correction, we applied it to simulated data generated to mimic key features of mRNA and protein data, but with a known underlying correlation and known measurement reliability. We generated data for 5,000 simulated genes with a range of correlations and fixed reliability; a fixed correlation and a range of reliabilities; and a fixed correlation and reliability with a range of data missing at random, or non-randomly, with a de-tection bias against low-expression genes. We then measured the observed correlation, uncor-rected for noise, and used Spearman’s correction to estimate the true correlation. At each set of parameters, we generated 50 transcriptome/proteome pairs to assess reproducibility.
As shown in Fig3A–3C, noise reduces correlations in a non-negligible way. Given an actual correlation of 0.9, and a reliability of 0.7, higher than the mean values for real data (cf.Fig 1C), the observed correlation has a mean of 0.631±0.009 (standard deviation), whereas Spearman’s correction yields a median value of 0.901±0.007, closely matching the true value. Spearman’s correction performs well over a wide range of reliabilities (Fig 3B) and when data are missing at random (Fig 3C), cases where observed correlations provide a wide range of estimates that are all systematically incorrect. Smaller datasets lead to increased variability of the Spearman estimate due to sampling error (Fig 3C). When faced with data biased toward detection of high-abundance mRNAs and proteins, Spearman’s correction systematically underestimates the true correlation (Fig 3D), as expected due to restriction of range effects.
Using Spearman’s correction on real data, we estimated mRNA–protein correlations for pairs of mRNA- and protein-level studies, obtaining a median corrected correlation of 0.92. Variability due to sampling error was large for small datasets as expected (cf. Fig3Cand3D), and decreased as dataset size increased, with estimates stabilizing for large datasets (>3000 genes) at a mean ofr= 0.88±0.02 (Fig 2A). This value is echoed by consideration of the largest dataset with two mRNA [38,43] and two protein [30,40] measurements each (Fig 2B). For these data, the four observed mRNA–protein correlations arer= 0.60, 0.63, 0.62 and 0.64, and the correlation between mRNA and protein measurements arermRNA= 0.86 andrprotein= 0.57 respectively, yielding the corrected estimate^rtrue
¼p4ffiffiffiffiffiffiffiffiffiffiffiffiffiffiffiffiffiffiffiffiffiffiffiffiffiffiffiffi0:600:630:620:64
ffiffiffiffiffiffiffiffiffiffiffiffiffi
0:850:57
As demonstrated, Spearman’s correction, while useful, does not address biases due to data that are systematically missing. Spearman’s correction also assumes uncorrelated errors, and thus has no mechanism for handling correlated errors arising due to, for example, protocol similarities within a study or use of similar measurement techniques between studies. Actual datasets show evidence for all of these effects (Fig 1).
A structured covariance model yields estimates of underlying correlation
and of mRNA and protein levels
Extending estimates to the full genome, accounting for structured noise and non-randomly missing data, requires a more sophisticated approach. Even seemingly simple approaches to re-duce noise, such as averaging measurements normalized to the same scale, are unworkable as strategies for estimating genome-scale mRNA–protein relationships: only 16 proteins are de-tected by all 11 protein quantification studies, and these proteins are all highly abundant. Throwing out smaller datasets discards potentially valuable measurements, and it is unclear when to stop, since all datasets are incomplete to some degree.
To address these challenges, we adapted structural equation modeling to admit nonran-domly missing data (seeMethods). We introduce a structured covariance model (SCM), adapted with important modifications from recent work [27], that explicitly accounts for struc-tured noise arising from replicates and use of shared measurement techniques, explicitly esti-mates noise at multiple levels and the nonlinear scaling factors linking underlying variables, and allows inferences of latent covariance relationships with imputation of missing data (Fig 4).
The SCM accurately estimates true correlations in simulated data when substantial data are missing nonrandomly, a case on which Spearman’s correction produces severely biased esti-mates (Fig 3D). Fitting the SCM to real data yields estimates of whole-genome steady-state mRNA–protein correlation ofr= 0.926±0.004 across all 5,854 genes for which an mRNA has been detected in at least one of the 38 mRNA quantitation experiments (Fig 2A). That is,
Fig 3. Correlation estimates show widely varying performance on simulated data.(N= 5000“genes”) against the known true correlations used to generate the data (dotted line). 50 replicates were performed at each parameter value. A, Varying true correlation from 0.1 to 1.0 with a fixed reliability (ratio of true to total variance) of 0.7. B, Varying reliability from 0.1 to 1.0 with a fixed true correlation of 0.9. C, Varying the number of genes with detected gene products from 100 (2%) to 5000 (100%) with a fixed reliability of 0.7 and fixed correlation of 0.9, with gene data missing at random. D, As in C, but with gene data missing non-randomly according to the sigmoidal model described inMethods, such that low-expression gene products are less likely to be detected.
mRNA levels explain 86% of variation in protein levels at the whole-genome scale. We empha-size that the SCM does not involve any attempt to maximize the mRNA–protein correlation or any assumptions about the strength of the correlation.
To examine the influence of low-coverage datasets on the correlation estimate, we re-fit the SCM on data restricted to studies with no more than 60% or 80% missing values (cf.Table 1), resulting in essentially unchanged correlation estimates ofr= 0.919 andr= 0.933, respectively. Including these smaller datasets does not alter these estimates significantly.
Comparisons indicate accurate estimates and plausible imputations of
mRNA and protein levels
The SCM integrates all data to produces mean and variability estimates of mRNA and protein levels, yielding a dataset in which mRNA levels have been quantified for 5,854 genes and pro-tein levels have been quantified for 4,990 genes in at least one study.
To evaluate the accuracy of these estimates, we linearly scaled them to molecules per haploid cell using high-quality published values for mRNA per cell and protein per cell. Estimates of the number of mRNA molecules per cell range from 15,000 to 60,000 molecules per cell [36,
53]. A more recent study argued that the earlier, lower estimate resulted from misestimation of
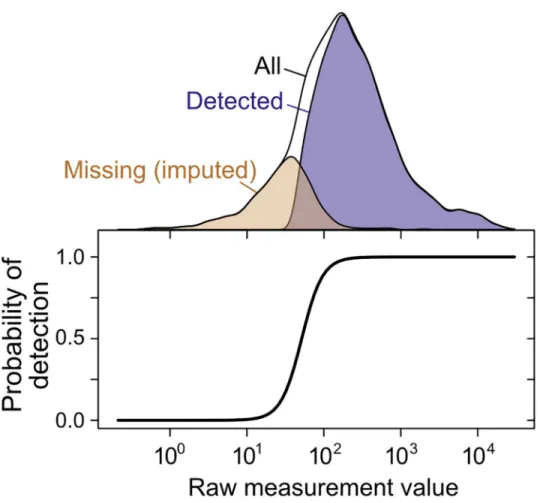
Fig 4. Imputation of non-randomly missing data.The probability of gene or protein detection is modeled in the SCM as an increasing, step-like (logistic) function of the mRNA or protein level (seeMethods). Lower panel shows the inferred probability of detection as a function of the measurement value for a single mRNA dataset [76]; top shows the distribution of detected, missing (imputed), and all genes.
mRNA mass per cell and average mRNA length, with 36,000 molecules per cell as a revised es-timate also supported by independent measurements [54]. The higher estimate resulted from rescaling the lower estimate to match expression of five genes measured by single-molecule fluorescencein situhybridization (FISH) [53]. We adopted the 36,169 mRNA molecules per cell estimate [54]. Scaled to 4μg of protein in 1.5×10⁶cells (2.7pg protein per yeast cell in cells roughly 30μm3in size) [55], SCM protein levels sum to just over 35 million protein molecules per haploid cell, similar to the 50 million molecules per cell estimated previously [20] within the variation in total protein extraction from haploid yeast cells (cf. [56], which estimates 4.95pg per cell).
Scaled SCM per-gene means provide the best point-estimates of molecules per cell (Fig 5A), although the correlation between estimates of means is necessarily higher than the estimated true correlation, since each estimate contains error. For a more representative global view of mRNA and protein levels, we draw a sample from the SCM estimates according to each gene’s mean and variance in levels (Fig 5B). Correlations between sampled mRNA and sampled pro-tein levels (r= 0.923) are consistent with the inferred underlying correlation.
We then compared scaled SCM estimates to small-scale gold-standard, independent mea-surements of absolute mRNA and protein levels not used in our analysis. (No genome-scale gold-standard measurements of mRNA or protein levels exist for yeast or any other organism.) SCM estimates of absolute mRNA levels matched FISH measurements well [53] (average dif-ference of 1.2-fold between estimated and measured levels [Fig 5B], with one outlier estimate overshooting the FISH value by 1.7-fold). Notably, these results demonstrate that the FISH esti-mates are compatible with roughly 36,000 mRNA molecules per cell during exponential growth as reported [54], and do not require the almost two-fold higher number of cellular mRNAs ex-trapolated in the FISH study.
Absolute protein levels for a set of 21 proteins differing up to 25,000-fold in cellular abun-dance have been measured using single-reaction monitoring (SRM) spiked with stable-isotope standards [57]. SCM estimates correlate better with these absolute levels (r= 0.94 between log-transformed values) than does any individual dataset. This includes the only study, using west-ern blotting [30], which reports levels for all 21 proteins (r= 0.90) (Fig 5C, average difference of 1.4-fold between SCM estimates and SRM measurements, compared to 1.8-fold using west-ern blotting). Relative protein levels estimated by integrating multiple datasets using an alter-native approach in which noise is not modeled [16] correlate with absolute levels less well (r= 0.88) than do the SCM estimates. The structured covariance modeling approach thus esti-mates steady-state cellular mRNA and protein levels with an unmatched combination of com-pleteness and accuracy.
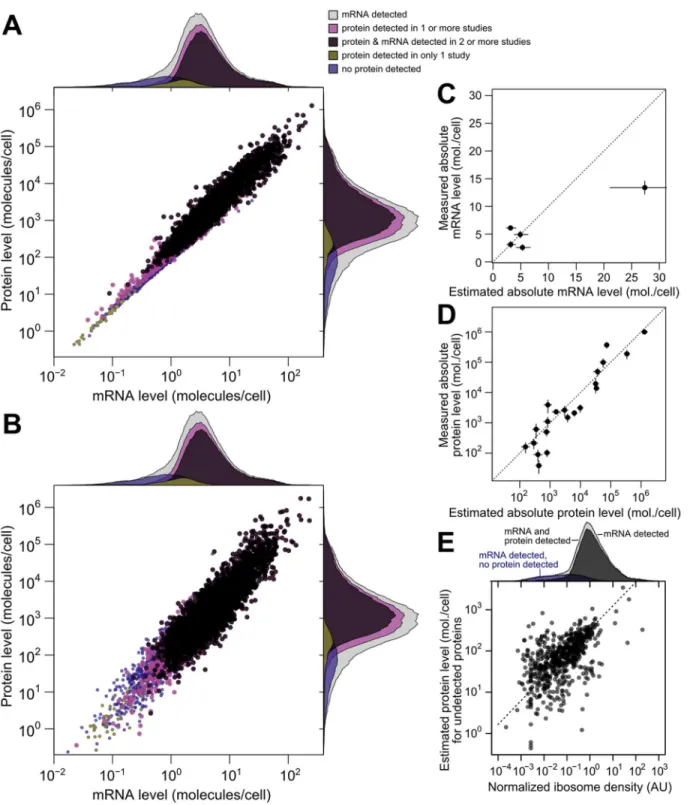
Fig 5. Integrated estimates of mRNA and protein levels using a structured covariance model (SCM).A, Integrated estimates of mean steady-state protein and mRNA levels across 58 global measurements reveal a strong genome-wide dependence between (r= 0.93). Estimates are produced for any gene with a detected mRNA (gray marginal densities), and other densities characterize subsets by mRNA and protein detection. B, A single sample from the SCM estimates provides a representative view of mRNA and protein levels. Colors and marginal densities are the same as in A. C, Absolute mRNA level estimates versus single-molecule fluorescencein situhybridization counts [53]. D, Absolute protein level estimates versus stable-isotope-standardized
single reaction monitoring measurements [57]. Dotted lines in B and C show perfect agreement. E, Evidence for active translation of undetected proteins inferred from ribosome profiling. Dashed line shows ranged major-axis regression best fit. Marginal densities show ribosome density (median across five studies, seeMethods) for all detected mRNAs (light gray), all mRNAs with a detected mRNA and protein (dark gray), and transcripts with no detected protein (blue).
Translational regulation widens the dynamic range of protein
expression
Our results indicate that the true correlation between steady-state mRNA and protein levels in exponentially growing budding yeast is far higher than previously recognized, explaining the vast majority of variation in protein levels on a log scale. In many previous analyses, this would be equivalent to demonstrating a minor role for other forms of regulation: if the variation in protein levels were a pie, and mRNA levels took a slice, other forms of variation would get only the leftovers. As we will show, such competition is largely illusory.
Positive evidence exists for strong post-transcriptional contributions to protein levels. The dynamic range of protein abundance is wider than mRNA abundance, which must reflect dy-namic-range amplification by post- transcriptional regulation [9]. Indeed, wide per-gene varia-tion exists in measurements of translavaria-tional efficiency [18,58,59].
The report that translational activity, estimated by ribosome profiling, explained more than twice the protein-level variation than did measured mRNA levels [18] prompted us to more closely examine these results. We reproduced these comparisons, and found that subsequent ri-bosome-profiling studies [58–61] confirmed the strong predictive power of ribosome density for the protein levels originally employed, which came from a single study [40] (Fig 6A). We wondered whether these findings might reflect experimental noise that differed between the mRNA and ribosome-footprint measurements in the original study. Correlations using SCM-estimated protein levels are substantially higher for both SCM-SCM-estimated mRNA levels and ri-bosome density measured in all studies, consistent with reduction of noise in the SCM esti-mates (Fig 6A). SCM-estimated mRNA levels predict protein levels better (r= 0.926) than any of the individual ribosome profiling studies (Fig 6A). This likely reflects remaining noise and systematic bias in the profiling studies, since using Spearman’s correction to estimate the true correlation between ribosome density and protein level yields correlations ofr= 0.88 against SCM-estimated protein levels andr= 0.91 using the largest two largest protein-level datasets, measured by mass-spectrometry and western blotting. These results suggest that, contrary to previous reports, measures of translation and mRNA level have essentially equivalent and quite strong predictive power for protein levels.
However, major contributions to protein levels from mechanisms other than mRNA level become obvious upon inspection of the data. The dynamic range of protein expression (from fewer than 50 to more than 1,000,000 molecules per cell [30,57]) is wider than that of mRNA levels (e.g.from 0.1 to 89 molecules per cell in a landmark early study [36]). In the SCM esti-mates, the full range of mRNA expression is roughly 10,000-fold (0.02 to 253 molecules per cell on average), whereas the range of protein expression is more than 1,000,000-fold (an average of 0.4 molecules to 1.3 million molecules per cell). Since both mRNA and protein are roughly lognormally distributed, the ratio of log-transformed ranges, 1.6, yields a rough measure of rel-ative variation. (This relrel-ative variation is unchanged when attention is restricted to the central 95% of the mRNA and protein distributions to mute outlier effects.) Individual mRNA and protein datasets vary but confirm similar differences in dynamic range (S3 Fig). We address more representative estimates of relative dynamic range below. As previously noted [9], this dynamic-range amplification must involve post-transcriptional variation.
Fig 6. Transcriptional and translational regulation act coherently to set protein levels.A, Left, the correlation of mRNA (orange) and ribosome footprint density (green) with protein levels [40] as originally reported [18]. Results of four subsequent ribosome footprint density datasets (gray) from other groups are shown for comparison. Right, the same correlations employing SCM-estimated protein levels. The SCM mRNA–protein correlation is shown for comparison (blue). All bars show Pearson correlations between log-transformed values. B, The exponent relating protein and mRNA levels, or equivalently the slope relating log-transformed values, estimated by noise-blind (ordinary least-squares, OLS) and noise-aware (ranged major-axis, RMA) regression analyses. Gray points, all pairs of datasets; black points, pairs of datasets covering at least half the detected transcriptome (>2927 genes). Dotted line shows perfect
agreement; dashed line marks integrated SCM estimate (1.69). C, Cumulative distributions of slopes computed by OLS and RMA regression (solid lines), with medians indicated by dotted lines and the SCM slope estimate indicated by a dashed line, cf.S2 Fig. D, Relative translational activity (TA) measured by ribosome density (normalized, median over five datasets,N= 4435) correlates strongly and nonlinearly with mRNA level (SCM estimate). Dotted gray line
shows linear (slope = 1) fit. Solid gray line shows RMA regression fit (slope = 1.68). E, Relative translational efficiency (TE) (ribosome density divided by mRNA level) increases with SCM mRNA level (Spearmanr= 0.65). F, RMA-estimated slopes for translational activity (ribosome density) and protein level versus SCM-estimated mRNA level (left) and recent RNA-seq mRNA level (right). Dashed line shows SCM estimate of protein vs. mRNA slope. G, Distributions of per-gene steady-state levels of mRNAs (blue; SCM estimates [solid] and independent recent RNA-seq estimates [dotted]), ribosomes on steady-state mRNAs (dotted yellow), and proteins (magenta).
repression (leakiness). Here, estimates of levels reflect the measurements but confer no particu-lar interpretation. We note that no obvious break or cutoff exists in the data or the SCM esti-mates to suggest a gene-expression threshold below which the biology changes qualitatively.
Translational regulation multiplies transcriptional signals with high
fidelity
A consequence of two facts—the higher dynamic range of protein levels than of mRNA levels, and the strong log-log linear correlation between the two—is that steady-state protein levels cannot be (even noisily) proportional to steady-state mRNA levels at the genome scale. In the standard model (Pi¼
ti
diMiwith proteinPand mRNAMfor genei, cf.Eq 2), steady-state
pro-tein levels will be roughly proportional to steady-state mRNA levels on a log-log scale assuming translation rates and degradation rates are uncorrelated with mRNA levels. This is most easily seen considering the case of constant translation and degradation rates (τi=τandδi=δ, re-spectively) across all genes, such thatPi¼
t
dM
1
i where we have made explicit the exponent of 1.
In this case, lnPi ¼1lnMiþln
t
d . Deviations from proportionality can be captured by de-viations from a log-log slope of 1.
As described in the Introduction, several studies have estimated slopes very near 1, but have not accounted for error-induced systematic underestimation of slopes due to regression-dilu-tion bias [31]. We therefore used a noise-tolerant regression technique closely related to princi-pal component analysis known as ranged major-axis (RMA) regression [33], which yielded a range of slopes systematically higher than the ordinary least-squares regression slopes (Fig6B
and6C) and have a median of 1.54. Unlike OLS, RMA regression permits error in both vari-ables and is symmetric, such that regression ofYonXproduces the inverse slope to that ob-tained by regression ofXonY. Other techniques with the same symmetry property but different technical assumptions each yield slopes substantially larger than 1 and larger than OLS estimates (S2 Fig). The estimated slopes for individual pairs of datasets span a wide range, even using RMA and limiting attention to large datasets (Fig 6B), suggesting the existence of systematic biases, toward increased and decreased variance, separating these studies. The pres-ence of such biases in protein-quantitation studies, though not their precise source, has been previously described [62].
The SCM approach, which accounts for both noise and missing data, yields an estimated slope of 1.69, compatible with the range of estimates from noise-aware methods on individual pairs of datasets (Fig6Band6C) and also similar to the expectation (1.6) derived from exami-nation of the relative dynamic ranges above. Steady-state protein levels therefore reflect a dra-matic multiplication of the transcriptional signal: rather than competing with transcriptional regulation as often assumed, post-transcriptional regulation cooperates.
If translational activity drives much of this cooperative amplification, higher-expressed mRNAs must tend to be more highly translated. Such an effect was noted in passing in the ear-liest ribosome-profiling study [18]. Several additional such studies satisfying our experimental criteria have been performed since [58–61], which allows us to more thoroughly quantify the relationship between levels of translation and expression. The coverage of these datasets is ex-cellent, so we focus on the 4,435 genes for which all five studies report ribosome
density measurements.
some evidence for a ceiling or saturation effect at high expression levels. These results provide strong evidence that highly expressed genes generate highly translated mRNAs.
RMA regression of ribosome density against SCM mRNA levels yielded a slope of 1.70, compared to a slope of 1.72 of SCM protein levels against mRNA levels (Fig 6F), suggesting that increases in translational activity accompanying elevated mRNA expression are sufficient to generate the broader dynamic range of protein levels relative to mRNA levels.
A subtle possibility is that the SCM estimates have a compressed dynamic range relative to true values, which would inflate both the slope of the translational-activity–mRNA relationship and the correlation between TE and mRNA levels. To address this possibility, we exploited the fact that three of the accompanying mRNA-level measurements in the ribosome-profiling studies [58,60,61] were not used in our SCM estimates and therefore constitute an indepen-dent, modern, replicated mRNA dataset. The median of these recent measurements correlate well with our SCM estimates (r= 0.90, Pearson correlation on log-transformed values) and the SCM and recent measurements have statistically indistinguishable distributions (S4 Fig). High-and low-expression genes deviate slightly consistent with experimental error in RNA-seq at the low end and compression of the SCM estimates at the very high end. We regressed ribosome densities and protein levels against these recent mRNA levels. Slopes were lower but substan-tially above 1.0 (1.46±0.02 and 1.49±0.03 [95% confidence intervals] for translational activity and SCM protein levels versus recent mRNA measurements, respectively,Fig 6F). Importantly, calculation of the slope of translational activity versus recent mRNA level does not involve our SCM measurements at all, and thus provides independent evidence that translational activity levels have a wider dynamic range than mRNA levels.
To provide an overall view of relative dynamic ranges, we plotted the distribution of esti-mated numbers of steady-state mRNAs and proteins per gene. We used ribosome density mea-surements to estimate the number of ribosomes engaged in translating each mRNA species in a typical haploid cell (Fig 6G), assuming 200,000 ribosomes per cell [63] of which 85% are en-gaged in active translation (seeMethods). Both SCM and recent mRNA levels show a similar dynamic range for most mRNA species, and a narrower distribution than ribosome or protein levels.
In summary, measured variation in translational activity correlates strongly with mRNA level and is sufficient to quantitatively account for the strong nonlinear relationship between mRNA levels and protein levels.
A toy model illustrates non-independent contributions from transcription
and translation
The analysis above illustrates a fundamental asymmetry: although absence of post-transcrip-tional regulatory processes would produce a perfect mRNA–protein correlation [1], a perfect mRNA–protein correlation need not indicate a negligible post-transcriptional contribution to relative protein levels.
Contrary to the conclusions of many analyses, it is possible for mRNA levels and (for exam-ple) translation rates to each explain more than 50% of protein-level variation. Both processes could each contribute 100% of protein-level variation. All that is required is that their contribu-tions not be independent.
To see this, consider the following toy model for regulation of protein levels which does not involve assuming that translation rates are independent of mRNA levels:
@Pi
with
di¼d ti¼aðMiiÞ
g
lni Nð0;sÞ
constant degradation rate
translation rate rises nonlinearly with mRNA level
noisy evolved correlation between mRNA levels and translation rates
Despite appearances, the functional relationship between translation rates and mRNA levels does not imply or depend on mechanistic properties of transcription and translation. All vari-ance in this model (as in all analyses in the present work) derives from differences between genes, so the functional relationship merely describes an empirical correlation. As described in more depth in the Discussion, such a correlation can arise if genes have evolved differential translational efficiencies tuned to multiply transcriptional signals.
In this toy model, withεi= 1 (or more generallyσ= 0), translation rates and mRNA levels reinforce each other perfectly albeit nonlinearly. Under these conditions, steady-state mRNA levels explain 100% of the steady-state protein-level variation on a log scale. Translational regu-lation also explains 100% of the protein-level variation.
Pi ¼
aMg
i
d Mi¼
a dM
1þg
i steady state protein levels
lnPi ¼ ln
a
dþ ð1þgÞlnMi log protein levels are linearly related to log mRNA levels
¼ ln da
1
g
þ 1þ1
g
lnti log protein levels are linearly related to log translation rates
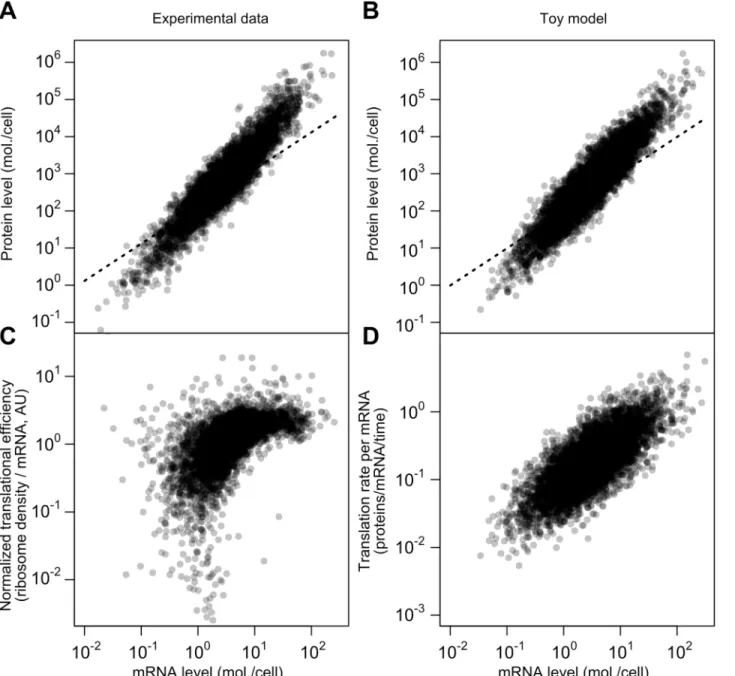
Adding variation to translation rates (σ>0) and fixing other parameters allows close repro-duction of the SCM estimates on several dimensions (Fig7Aand7B; source code including pa-rameters presented inMethods). Both datasets have similar mRNA–protein correlations (r= 0.926 for experimental data,r= 0.922 for toy model), similar log-log slopes (1.69 for both), and similar dynamic ranges for mRNA and protein levels.
The critical difference between this model and the standard model for protein-level varia-tion,Eq 1, is the evolved strong positive correlation between mRNA levels and translational ef-ficiency. This, too, is evident in experimental data when calculating translational efficiency (Fig 7C, RMA slope = 0.71, Spearmanr= 0.62). The correlation is mirrored by the toy model, where translation rate per mRNA and mRNA level can be directly compared (Fig 7D; RMA slope = 0.74, Spearmanr= 0.74). The experimental data are substantially missing at the low end, which will tend to attenuate the correlations.
The toy model does not capture the apparent saturation of translational efficiency at high mRNA levels (Fig 7C). Assuming this effect is real, other mechanisms, such as decreased rates of protein turnover, must be added to the toy model to even better reflect the data, which we leave for future detailed modeling.
Discussion
Our results demonstrate that the frequently reported result that steady-state mRNA levels ex-plain less than half (30–50%) of the variation in protein levels constitutes a significant underes-timate. In exponentially growing budding yeast, the best-studied system and source of many of these claims, we find that the true value at the whole-genome scale, taking into account the re-ductions in correlation due to experimental noise and missing data, is closer to 85%.
versions of Spearman’s correction [15], contended with differences in dynamic range by adopt-ing nonparametric approaches [1,17], and integrated multiple datasets [8,11,16,17]. All of these works have reached conclusions which differ from the portrait assembled here.
Our analysis transcends these studies on several fronts. The present study incorporates more measurements than any previous work. We distinguish between correlations between measurements and estimates of underlying correlations accounting for between-study reliabili-ty, a critical difference that has largely eluded previous work. The structured covariance model
Fig 7. A simplified model captures major features of the steady-state mRNA–protein relationship.A, mRNA and protein levels estimated by the structured covariance model (cf.Fig 5B). Dotted line shows a linear relationship. B, mRNA and protein levels generated according to a toy model (see text andMethods). Dotted line shows a linear relationship. C, Normalized translational efficiency (ribosome density per mRNA) compared to steady-state mRNA levels. D, Translation rate per mRNA versus mRNA level in the toy model.
natively handles nonrandomly missing data to provide more complete and accurate molecules-per-cell estimates than previous studies. Most importantly, we have not relied on the common but mistaken assumption that different modes of regulation act independently.
A consistent approach in the literature has been to pit transcriptional and post-transcrip-tional variation against each other, both analytically and rhetorically (e.g.,“transcriptional reg-ulation is only half the story”[28]). As we have shown, the data do not fit this competitive paradigm, and even invalidate some of its analytical assumptions, such as independence and non-collinearity. The competitive versus cooperative aspects of post-transcriptional regulation come to the fore when considering the dynamic ranges of gene expression. A wider range of protein than mRNA levels is well-established in a range of organisms [3,15,64], and our re-sults further cement this observation. However, dynamic-range variation could be achieved in different ways, captured by two extremes. At one extreme, post-transcriptional regulatory vari-ation is uncorrelated with transcriptional regulvari-ation, reducing the contribution of mRNA levels to protein levels. At the other extreme, post-transcriptional variation correlates strongly with transcriptional regulation, multiplying the transcriptional signal with little interference. In both cases, post-transcriptional regulation amplifies the dynamic range of gene expression, but only in the latter case does it also faithfully amplify the mRNA signal itself. Our data clearly and convergently indicate that the biology, at least for this organism under these conditions, lies toward the latter, cooperative extreme.
Coordinated transcriptional and translational signal amplification may explain a range of other observations, particularly regarding proteins-per-mRNA (PPM) ratios, which are fre-quently used to isolate signs of post-transcriptional regulation. Because post-transcriptional amplification correlates strongly with mRNA levels, PPM will remain correlated with mRNA, and as a consequence, any sequence features correlated with mRNA will tend to correlate with PPM as well. As an example, amino-acid composition correlates with PPM in yeast [17], with valine/alanine/glycine frequencies higher in high-PPM sequences and leucine/asparagine/ser-ine frequencies lower in high-PPM sequences. These are precisely the same amino acids previ-ously shown to vary most strongly in frequency, in the same directions, with increasing mRNA abundance [65]. Similarly, many other correlates of PPM are also correlates of mRNA levels (codon bias, tRNA adaptation), including mRNA level itself [1,11]. For features such as codon bias, which arises in response to selection for translational efficiency [66], association with in-creased PPM might seem an obvious causal link, but because codon bias strongly associates with mRNA level, the null expectation is that it will correlate with PPM even if codon bias had no effect on translational activity at all. Analyses of the determinants of protein levels must contend with the collinearity and non-independence of contributing processes.
An important intermediate case between the evolutionary and mechanistic cases is variation in mRNA and protein levels in individuals across a genetically diverse population. The poten-tial for correlations between mRNA and protein relies upon substanpoten-tial true variance in mRNA levels. In population-variation studies, one expects relatively few variants and resulting varia-tion far lower than the orders of magnitude considered here. Correspondingly, in such studies mRNA-change–protein-change correlations may be low even given a strong underlying link between mRNA and protein levels.
If the nonlinear multiplication of mRNA levels into protein levels is an evolved property, what mechanism(s) has evolution exploited? The present work supports a particular class: the increased density of ribosomes on high-expression mRNAs, with variation sufficient to account for the nonlinearity, suggests increased rates of translation initiation as the major contributor. Correspondingly, recent work has shown that in yeast and a wide range of other organisms, the stability of mRNA structures in the 5’region weakens as expression level increases, favoring more efficient translation initiation [67], and wide variation in heterologous protein levels can be achieved by varying mRNA stability near the initiation site [68,69].
Several limitations still attend our approach. By assuming single multiplicative errors per experiment, we ignore variation in per-gene error which may be systematically different be-tween low- and high-expression genes and/or systematically affect particular measurement techniques [62]. For example, limitations in the dynamic range of a measurement technique will tend to compress the resulting measurements, causing such systematic errors. Our model does not contend with distortions possibly imposed by alterations to 3’regulatory signals (e.g.
tagging with affinity epitopes [30] or fluorescent proteins [39] to enable protein detection), or with variability in quantification due to propensities of particular mRNAs to be more efficient-ly sequenced or for their protein products to be unusualefficient-ly amenable to mass-spectrometric de-tection. The lack of any gold-standard genome-scale measurements hinders detection of such biases. Our results underscore the urgent need for such standard measurements of absolute mRNA and protein levels to enable identification and correction of systematic errors in estab-lished and emerging gene-expression measurement techniques. More sophisticated models for experimental error at many levels, which would be informed by but need not wait for such gold-standard measurements, also promise to provide higher-fidelity biological estimates from existing data.
We infer a higher mRNA–protein correlation (r= 0.93) here than when using an earlier, re-lated model [27] (r= 0.82), a difference we attribute to two factors. First, the present analysis stratifies by measurement technology using all data, whereas the previous estimate did not, al-though in that study, stratifying by technology on a reduced dataset yieldedr= 0.86 [27]. Here, using all data and treating technology-related experimental noise separately from other sources of noise, we are able to average out more systematic technology biases, likely producing superi-or estimates of the associated measurement variability and reducing noise-induced attenuation of the mRNA–protein correlation. Second, in the present analysis, population-averaged protein levels and mRNA levels are constrained to each have a single underlying variance, whereas in the earlier study each experimental replicate had a separate variance. Inference of artificial ex-periment-specific variances spread variability across experiments (overfitting), where in the present analysis, we adopt the more biologically plausible stance that the true underlying mRNA and protein population-average distributions each have a characteristic variance which is measured by each experimental replicate. The present model, deprived of extra parameters, infers higher correlations.
other settings and other organisms. An influential study on mouse fibroblasts measured mRNA and protein levels and degradation rates for thousands of genes [3], concluding that mRNA levels explained 41% of the variation in protein levels, with most variation instead ex-plained by translational regulation. Our results indicate many ways in which the results of this study could be profitably revisited. Indeed, a recent follow-up study concluded that, once ef-fects of error and missing data were accounted for, mRNA levels explain 75% or more of the protein-level variation in these data [21].
The protein regulatory environment of rapidly dividing cells differs from that of many other cellular states. The faster cells divide, the more rapidly protein molecules partition into daugh-ter cells, adding an approximately constant amount to all protein removal rates and conse-quently reducing between-gene variation in these rates. This will tend to increase the dependence of protein levels on mRNA levels, and decrease the dependence on degradation rates, during proliferation.
In addition to cellular state, regulatory contributions depend on timescale. Post-transcrip-tional processes must dominate protein-level changes within seconds to a few minutes of a stimulus or signal; transcriptional responses, particularly in eukaryotes, where transcription and translation are uncoupled, are all but powerless at this timescale. As such, the notion of general determinants of protein levels without regard to timescale has questionable utility. A final theme emerging from our study is that careful empirical studies, coupled with noise-aware analyses, are needed to determine regulatory contributions for any cellular condition of interest at any timescale.
Methods
Reliability
Let us assume we wish to measure latent variablesϕandψbut, due to noise, actually observe variablesX=ϕ+εXandY=ψ+εYwhere the random noise variablesεXandεYare uncorrelated and mean zero. The reliability
aX¼VarðfÞ
VarðXÞ¼
VarðfÞ
VarðfÞ þVarðXÞ ð4Þ
quantifies the ratio of signal variance to total (signal plus noise) variance inX. Given two ran-dom variablesX1andX2representing replicate measurements ofϕ, the latent (true) variance is Cov(X1,X2) = Cov(ϕ+εX1,ϕ+εX2) = Cov(ϕ,ϕ) = Var(ϕ), where the error terms vanish because
they are uncorrelated by assumption. Thus, the Pearson correlation between replicates is
rX1;X2 ¼
CovðX1;X2Þ
ffiffiffiffiffiffiffiffiffiffiffiffiffiffiffiffiffiffiffiffiffiffiffiffiffiffiffiffiffiffiffiffi
VarðX1ÞVarðX2Þ
p ¼
Covðf;fÞ ffiffiffiffiffiffiffiffiffiffiffiffiffiffiffiffiffiffiffiffiffiffiffiffiffiffiffiffiffiffiffiffi
VarðX1ÞVarðX2Þ
p
¼
ffiffiffiffiffiffiffiffiffiffiffiffiffiffiffiffiffiffiffiffiffiffiffiffiffiffiffiffiffiffiffiffiffi
VarðfÞ
VarðX1Þ
VarðfÞ
VarðX2Þ
s
¼ ffiffiffiffiffiffiffiffiffiffiffiffia
X1aX2
p ; ð
5Þ
Spearman
’
s correction
We wish to infer the Pearson correlation coefficient between latent variablesr;c¼
Covð;cÞ ffiffiffiffiffiffiffiffiffiffiffiffiffiffiffiffiffiffi
VarðÞVarðcÞ
p
but, due to noise, we observe random variables
rX;Y ¼
CovðX;YÞ
ffiffiffiffiffiffiffiffiffiffiffiffiffiffiffiffiffiffiffiffiffiffiffiffiffiffiffiffiffi
VarðXÞVarðYÞ
p
¼ ffiffiffiffiffiffiffiffiffiffiffiffiffiffiffiffiffiffiffiffiffiffiffiffiffiffiffiffiffiffiffiffiffiffiffiffiffiffiffiffiffiffiffiffiffiffiffiffiffiffiffiffiffiffiffiffiffiffiffiffiffiffiffiffiffiffiffiffiffiffiffiffiffiffiffiffiffiffiCovðf;cÞ
ðVarðfÞ þVarðXÞÞðVarðcÞ þVarðYÞÞ
p
rfc:
ð6Þ
with equality only when Var(εX) = Var(εY) = 0 (i.e.there is no noise).
Uncorrelated noise has no average effect on the numerator because errors cancel (see above), but the error terms in the denominator do not cancel. This effect additively inflates the variances in the denominator, biasing the observed correlations downward relative to the truth. Given the reliabilitiesαXandαY, Spearman’s correction is given by
rfc¼
rXY ffiffiffiffiffiffiffiffiffiffi aXaY
p ð7Þ
To estimateρϕψ, we need estimates ofρXY,αXandαY. A natural estimator replaces these population quantities with the sample correlation coefficients,rxy,^a
xanda^ywith ^
ax ¼ rx1;x2
^
ay ¼ ry1;y2
wherex1,x2are realizations ofXandy1,y2are realizations ofY. These replicates are used to estimate reliabilities.
The true correlation,ρϕ,ψ, can then be estimated using only correlations between
measure-ments:
^r
fc ¼
ffiffiffiffiffiffiffiffiffiffiffiffiffiffiffi rx1y1rx2y2 rx1x2ry1y2 s
¼
ffiffiffiffiffiffiffiffiffiffiffiffiffiffiffi rx1y1rx2y2
^
axa^ y
s
We extend this estimate to
^
rfc¼
4 ffiffiffiffiffiffiffiffiffiffiffiffiffiffiffiffiffiffiffiffiffiffiffiffiffiffiffiffiffiffi
rx1y1rx2y2rx1y2rx2y1
p
ffiffiffiffiffiffiffiffiffi
^
axa^ y
q
which has the further desirable properties of exploiting all pairwise correlations and being in-dependent of the choice of indices.
Taking this approach to its logical conclusion, given a set ofNmeasurements ofϕandM
measurements ofψ, we propose the estimator
^
rfc¼
QN;M
i;j rxi;yj
1
NM
QN i<i0rxi;xi0
1
N Nð 1Þ QM j<j0ryj;yj0
1
MðM 1Þ
where the numerator is the geometric means of all pairwise correlations, and the demoninator is the square root of the product of the geometric means of the pairwise reliability estimates (correlations between measurements) for each variable.
Data collection
We gathered 38 measurements from 13 studies measuring mRNA expression, and 20 measure-ments from 11 studies measuring protein concentrations, yielding a total of 58 high-through-put measurements of mRNA and protein levels from a maximum of 5,854 genes in budding yeast. The measurements were taken using different technologies including custom and com-mercial microarrays, competitive PCR, high-throughput RNA sequencing, flow cytometry, western blotting, scintillation counting of35S-labeled protein on 2D gels, and liquid chroma-tography coupled to tandem mass spectrometry (LC-MS/MS) using a range of labeling and quantification techniques. All yeast cultures were haploidS.cerevisiaegrowing in shaken liquid rich medium with glucose between 22°C and 30°C and sampled during the exponential growth phase. Details of the datasets are summarized inTable 1.
For analytical purposes, we treat data from one study [38] which performed two indepen-dent measurements using different methods as two studies (RNA-Seq and microarray), one per method. This study’s RNA-Seq employed a single-molecule sequencing method, smsDGE; we treat this as an RNA-Seq dataset.
We downloaded ribosome-profiling data from the primary sources for five studies [18,58– 61]. Within-study replicates were averaged; for one study of translational inhibitors [59], the no-inhibitor and 1×-inhibitor replicates were averaged. Summary ribosome density and mRNA levels for these datasets were computed by log-transforming all instances of each type of measurement, subtracting the grand median value, and exponenentiating the per-gene me-dian of the resulting values. To ensure the measurements were independent of SCM estimates, we excluded the mRNA levels from Ingolia and colleagues from the mRNA estimates, leaving three studies (one ribosome-profiling study did not report mRNA levels [59]). To preserve the measured dynamic range in the data, no scaling of variance was performed. Translational effi-ciency was computed as the median normalized ribosome density (five studies) divided by the median normalized mRNA level (three studies), ensuring these results are independent of the SCM estimates.
To estimate the number of ribosomes translating each mRNA species, we multiplied median ribosome densities (which are proportional to ribosomes per nucleotide) by gene length, then normalized the resulting distribution to sum to 200,000 ribosomes per haploid cell [63]. We further assumed that approximately 85% of ribosomes are engaged in active translation during rapid growth [70].
Raw data (with missing values), data normalized and imputed using the SCM, and merged molecules-per-cell estimates are archived in Dryad (http://datadryad.org) with DOI doi:10. 5061/dryad.d644f.
Statistical analysis
The structured covariance model (SCM)
The model has two components: an observation modelp(Ii,jjXi,j), which provides the probabili-ty of observing a value for mRNA/proteiniin replicatej, given the underlying mRNA/protein level, and a hierarchical modelp(Xi,jj. . .) for the underlying mRNA/protein levels themselves. The full model is specified as
Xi;j ¼ Li;l½jGl½jþTi;t½j þEi;k½jþRi;jþnj
ð8Þ
Li N2ð0;CÞ ð9Þ
Ti;t NNTð0;ttÞ ð10Þ
Ei;k Nð0;xkÞ ð11Þ
Ri;j Nð0;yjÞ ð12Þ
pðIi;j¼0jXi;j¼xÞ ¼
1
1þ expð Z0 k½j Z
1 k½jXi;jÞ
: ð13Þ
Random variablesLi,lcorrespond to the true denoised protein (l= 1) and mRNA (l= 2) lev-els, for mRNAs and proteinsi= 1,. . .,N, andLi= [Li,1,Li,2]0. The random variablesTi,tandEi,k
capture common technological variation and batch effects, respectively,t= 1,. . .,Nt,k= 1,. . .,
NE.Ri,jare experimental noise for replicatej= 1,. . .,NR.
Both technology effects and batch effects between experiments are assumed to be indepen-dent, Cov(Ti1,t1,Ti2,t2) = 0 ift16¼t2, and Cov(Ei1,k1,Ei2,k2) = 0 ifk16¼k2. Measurement noise is
in-dependent between replicates, Cov(Ri1,j1,Ri2,j2) = 0 ifj16¼j2.
The parametersνjcorresponds to the normalizing constants of the mRNAs/proteins within a replicate (on the log-scale, normalizing constants become offsets). The coefficientGl repre-sents the log-variance of the denoised true mRNA or protein. The ratioA¼Gabund
Gabundrepresents
the amount of post-transcriptional amplification of mRNA to protein. At steady state we expect
Pi MAi
for proteinPiand mRNAMi.
This model falls into the class of models that were extensively studied in an earlier work [27]. The results are largely insensitive to deviations from parametric modeling assumptions and to several details of prior specifications.
Missing data model. Eq 13models the probability that measurementXi,jis missing,p(Ii,j = 0jXi,j=x), as a logistic function of the value of the measurement. This data isnotmissing at random (NMAR) since the probability of missingness is a function of the (possibly missing) value. Such a missingness model is said to benon-ignorable. The parameters of the missing data mechanism,Z0
kandZ 1
k, and value,Xi,j, uniquely determine the probability that the
mea-surement is observed. For instance, whenXi;j¼
Z0
Z1, then the missingness probabilityp(Ii,j= 0jXi,
j=x) = 0.5.
Prior specifications. To complete the model specifications we place priors onC,τt,ξk,θj,
Z0 kandZ
1