ACPD
8, 453–488, 2008Long-term solar UV radiation reconstructed by
ANN
U. Feister et al.
Title Page
Abstract Introduction
Conclusions References
Tables Figures
◭ ◮
◭ ◮
Back Close
Full Screen / Esc
Printer-friendly Version
Interactive Discussion
Atmos. Chem. Phys. Discuss., 8, 453–488, 2008 www.atmos-chem-phys-discuss.net/8/453/2008/ © Author(s) 2008. This work is licensed
under a Creative Commons License.
Atmospheric Chemistry and Physics Discussions
Long-term solar UV radiation
reconstructed by Artificial Neural
Networks (ANN)
U. Feister1, J. Junk2, and M. Woldt3
1
Deutscher Wetterdienst, Richard Aßmann Observatorium Lindenberg, Am Observatorium 12, 15848 Lindenberg, Germany
2
Public Research Centre – Gabriel Lippmann, Department of Environment and Agro-Biotechnologies (EVA), 41, rue du Brill, 4422 B Grand-Duchy of Luxembourg, Luxembourg
3
Brandenburgische Technische Universit ¨at Cottbus, Lehrstuhl f ¨ur Umweltmeteorologie, Burger Chaussee 2, Haus 4/3, 03044 Cottbus, Germany
Received: 4 December 2007 – Accepted: 4 December 2007 – Published: 10 January 2008
Correspondence to: U. Feister ([email protected])
ACPD
8, 453–488, 2008Long-term solar UV radiation reconstructed by
ANN
U. Feister et al.
Title Page
Abstract Introduction
Conclusions References
Tables Figures
◭ ◮
◭ ◮
Back Close
Full Screen / Esc
Printer-friendly Version
Interactive Discussion
Abstract
Artificial Neural Networks (ANN) are efficient tools to derive solar UV radiation from measured meteorological parameters such as global radiation, aerosol optical depths and atmospheric column ozone. The ANN model has been tested with different com-binations of data from the two sites Potsdam and Lindenberg, and used to reconstruct
5
solar UV radiation at eight European sites by more than 100 years into the past. Annual totals of UV radiation derived from reconstructed daily UV values reflect in-terannual variations and long-term patterns that are compatible with variabilities and changes of measured input data, in particular global dimming by about 1980–1990, subsequent global brightening, volcanic eruption effects such as that of Mt. Pinatubo,
10
and the long-term ozone decline since the 1970s. Patterns of annual erythemal UV radiation are very similar at sites located at latitudes close to each other, but different patterns occur between UV radiation at sites in different latitude regions.
1 Introduction
Reconstruction of solar global UV radiation for the past decades has gained scientific
15
interest, because regular spectral UV radiation measurements started only less than two decades ago in the 1990s (Bais and Lubin, 2007). For the reconstruction of UV radiation, models can be used that simulate the radiative transfer of solar radiation on its way through the atmosphere, in particular by simulation of scattering and absorp-tion of radiaabsorp-tion by atmospheric gases and particles using physically-based laws and
20
parameterizations, or – as a different approach that has been applied in this study – by statistical relations between UV radiation and those atmospheric parameters that are closely related to UV radiation, and that have been measured over long time periods. Due to the lack of appropriate microphysical and macrophysical cloud input data, radia-tive transfer models are often applied in a mixed mode, i.e. clear sky UV irradiance is
25
ACPD
8, 453–488, 2008Long-term solar UV radiation reconstructed by
ANN
U. Feister et al.
Title Page
Abstract Introduction
Conclusions References
Tables Figures
◭ ◮
◭ ◮
Back Close
Full Screen / Esc
Printer-friendly Version
Interactive Discussion
derived from measured global radiation data.
Based on experience with an earlier approach that used a non-linear statistical model to reconstruct solar UV radiation (Feister et al., 2002), Artificial Neural Networks (ANN) have been used in this study. The ANN are capable of simulating even highly non-linear and complex relationships between an arbitrary number of input data (predictors), and
5
between input and output data (predictands), and are therefore commonly applied in different fields of science (Chevallier et al., 1998; Oliveira et al., 2006). It is one of the advantages of this method that the relationship between input data and output data does not need to be pre-described or a-priori known. This implies that physical laws, parameterizations of atmospheric processes, or empirical relations derived from
exper-10
iments can be neglected, because they are implicitly derived from the variability and covariance between input and output parameters by the training of the ANN. There-fore, assumptions on the input parameters that have usually not been measured in the past such as aerosol and cloud characteristics (optical depths, single scattering albedo, phase functions, size distributions etc.) need not be made in the ANN, because the
15
complex relationship between the input parameters and UV radiation will be simulated and “learned” by the ANN in the training process. On the other hand, a suitable sample size of concurrent input and output data that covers their typical variability in time – and if applied in the spatial domain, in space – is needed to finally provide small uncer-tainties of the ANN model output. It is another advantage of the ANN that the model
20
performance and reliability may be further improved by re-training such that changes in the statistical distribution and types of atmospheric conditions that did not occur in the first training period are accounted for in the improved ANN model version.
ANN models can be applied to any number of input parameters including geographic parameters such as latitude and height above sea level, provided that adequate
train-25
ing samples of data are available. Examples of the site-independent use of ANN for the reconstruction of UV radiation that illustrate this feature have been shown in an earlier study (Feister and Junk, 2006). An advantage of ANN compared to some other statistical modeling approaches is their capability of not being bound to a certain type
ACPD
8, 453–488, 2008Long-term solar UV radiation reconstructed by
ANN
U. Feister et al.
Title Page
Abstract Introduction
Conclusions References
Tables Figures
◭ ◮
◭ ◮
Back Close
Full Screen / Esc
Printer-friendly Version
Interactive Discussion
of statistical distribution of data. Therefore, tests on the statistical distribution functions of input and output parameters have not been performed in this study.
Our study will focus on the description of the data used, including small-scale spatial characteristics that have been derived from data at two sites with small spatial distance, briefly describe the ANN method, discuss the uncertainties of reconstructed UV
irra-5
diation, and finally show general features and patterns of reconstructed UV irradiation for different European sites over more than 100 y.
2 Input data
2.1 UV radiation
Predictands in this study are daily totals of erythemal UV radiation. The erythemal
10
action spectrum is based on the weighting function by CIE (1987). For two sites, where the needed input data have been available, integrated daily UV irradiation in the regions UV-B (280–315 nm) and UV-A (315–400 nm) has also been reconstructed. Broad-band UV radiation was either integrated from spectral solar irradiance measured by different types of spectroradiometers, or directly measured by broad-band UV filter radiometers.
15
As we are focusing on two close sites in this study, Table 1 shows an overview of the UV radiation data for those sites Potsdam and Lindenberg, in particular, the instruments used, their spectral range, step width, full bandwidth at half maximum (FBHM), the method used to extend measured spectra to the wavelength of 400 nm, the number of spectra per day, the method of cosine correction, calibration sources of instruments,
20
and the method of frequent calibration checks.
2.1.1 Brewer spectra at Potsdam
ACPD
8, 453–488, 2008Long-term solar UV radiation reconstructed by
ANN
U. Feister et al.
Title Page
Abstract Introduction
Conclusions References
Tables Figures
◭ ◮
◭ ◮
Back Close
Full Screen / Esc
Printer-friendly Version
Interactive Discussion
from 1995 to April 2003 about one to two times per h. As the Brewer spectra extend only from 290 to 325 nm (#030) or 363 nm (#118), spectral irradiance up to 400 nm, which is needed to derive UV-A and erythemal irradiance, was derived by the algo-rithm of Slaper et al. (1995). Calibration of the instruments was based on Secondary Standard Lamps of the type DXW 1000 W (tungsten halogen) that were calibrated once
5
to two times per year from Primary Standard Lamps of the type FEL 1000 W Osram Sylvania calibrated at Physikalisch-Technische Bundesanstalt (PTB). The cosine error of the Brewer instruments was accounted for by a correction applied to the measured Brewer spectra by estimating the components of direct and diffuse irradiance from measured global UV irradiance with the help of “spectral optical depths” that were
de-10
rived from concurrent broad-band UV filter radiometer measurements, and application of the cosine correction to the radiation components (Feister et al., 1997). This method of cosine correction takes the effect of cloud conditions on UV irradiance during the time of the Brewer scan (5 to 8 min) into account. For the purpose of comparison, UV radiation values derived from spectra measured with a Bentham DM 150 instrument
15
between 2000 and 2003 were used.
2.1.2 Brewer spectra at Lindenberg
Spectral UV irradiance at Lindenberg (52◦12′31′′N, 14◦7′17′′E, 127 m a.s.l.) has been measured since 1995 by Brewer spectroradiometer #078 (MKIV). The instrument was calibrated in August 1994 by an FEL 1000 W lamp (Nagel and Leiterer, 1995), and
20
about annually thereafter by International Ozone Services (IOS) with either 50 W or DXW 1000 W lamps. The calibration report of 29–31 August 1996 mentions that the Brewer #078 response files were found 9% low in 1996, and that a forward correction of the files, but no backward correction had been applied. Therefore, the Brewer UV values were increased by 9% for our study during the period January 1995 to August
25
1996. Further annual instrument calibrations by IOS in the period between 1997 and 2003 reported differences and forward corrections of UV response files by less than 4 to 5%.
ACPD
8, 453–488, 2008Long-term solar UV radiation reconstructed by
ANN
U. Feister et al.
Title Page
Abstract Introduction
Conclusions References
Tables Figures
◭ ◮
◭ ◮
Back Close
Full Screen / Esc
Printer-friendly Version
Interactive Discussion
UV spectra of instrument #078 had not been corrected for cosine errors of the instru-ment at the site. The method of cosine correction applied to Brewer instruinstru-ments #030 and #118 at Potsdam could not be used, because the required concurrent broad-band UV radiation data were not available at Lindenberg. Therefore, the cosine correction method described by Bais et al. (2005) that does not require additional measured input
5
data was kindly applied by A. Kazantzidis and A. Bais to the all UV spectra of Brewer instrument #078 between 1995 and 2004.
From 2005 onwards, spectral irradiances taken by fast-scanning spectroradiometers of the type SPECTRO 320D were used (Feister et al., 2005). Calibrations of those instruments have been based on lamps of the type FEL 1000 W that were calibrated
10
by PTB with a stated absolute uncertainty of±3%. On-site checks of calibration levels have been performed monthly by a 200 W lamp with ventilated housing (Metzdorf et al., 2003). Due to the improved characteristics of the instrument’s cosine diffuser with an integral cosine error of less than 2.5% (Schreder, 2003), a cosine correction to spectral irradiances has not been applied. Spectral coverage from 290 to 450 nm with
15
an oversampling stepwidth of 0.2 nm did not require a spectral extension. Spectral scans, which take about 23 s each, are taken every min. Every three h the instrument’s dark current is measured and removed from the raw data.
2.1.3 Hourly and daily UV irradiation
Hourly and daily band UV irradiation can be derived from the individual
broad-20
band data by summing up individual irradiances. For the one-minute time steps of SPECTRO 320D data, the short-term variability of UV irradiance is correctly reflected in the hourly and daily doses. However, for the non-equidistant longer time steps of Brewer data, assumptions on the variability of UV irradiance between two subsequent scans need to be taken. If the variability is not taken into account, the additional
un-25
ACPD
8, 453–488, 2008Long-term solar UV radiation reconstructed by
ANN
U. Feister et al.
Title Page
Abstract Introduction
Conclusions References
Tables Figures
◭ ◮
◭ ◮
Back Close
Full Screen / Esc
Printer-friendly Version
Interactive Discussion
In addition to geographical factors determining solar zenith angle and station-height above sea level, as well as absorption by atmospheric ozone, UV irradiance is affected by scattering of solar radiation
– due to clouds via their macrophysical features such as cloud cover, cloud optical depth, cloud pattern, cloud vertical extension, and cloud distance to the apparent
5
position of the sun (in particular, if they occlude direct beam radiation), and also via microphysical attributes such as type and size distribution of cloud droplets or particles,
– due to the type and features of aerosols (optical depth, size distribution, single scattering albedo, phase function, etc.),
10
– due to the albedo of the ground, especially the occurrence of snow.
Global irradiance in the visible (VIS) and near infrared (NIR) region is also scattered, though with different wavelength dependence and to a different extent. In addition, water absorption plays a role for global irradiance. If fast front passages or drifting pollutant plumes are excluded, atmospheric conditions typically change on time scales
15
of hours. Fast changes within minutes down to seconds do occur for changing cloud patterns, cloud optical depths and clouds occluding or not occluding the sun. In addi-tion, diurnal variations of ratios between clear sky UV and global irradiance (G) show a typical pattern with increasing values towards noon time and decreasing values in the afternoon, and higher values with cloudy conditions. An example of the varying ratios
20
UV/G for 16 July 2006 is shown in Fig. 1.
Concurrent cloud fraction (CF) derived from Whole Sky Imager measurements shows that the short-term variability of UV/G ratios is not closely correlated to CF, which is close to 100% between about 10:00 and 16:00 UTC, but is mainly due to varying cloud optical depths, and the position of clouds occluding or not occluding the
25
sun, as is illustrated in Fig. 1 by the one-minute values of sunshine duration (SD). We used the ratios UV/G to derive hourly and daily totals of UV radiation to account for the
ACPD
8, 453–488, 2008Long-term solar UV radiation reconstructed by
ANN
U. Feister et al.
Title Page
Abstract Introduction
Conclusions References
Tables Figures
◭ ◮
◭ ◮
Back Close
Full Screen / Esc
Printer-friendly Version
Interactive Discussion
short-term variability between spectral UV scans. For that purpose, values of global irradiance available at time steps of one minute were averaged over the time intervals of UV scans. The UV/G ratios were assumed to be constant between two consecutive UV scans, and the broad-band UV irradiance between the UV scans was estimated from ratios between measured UV and measured global irradiances, and summed up
5
to hourly and daily totals. Therefore, both the dependence on solar zenith angle and the short-term cloud variability is taken into account for hourly and daily UV radiation totals. This approach was applied to derive daily UV irradiation at Potsdam and Lin-denberg only. Different methods to derive daily totals of erythemal radiation have been applied at the other sites.
10
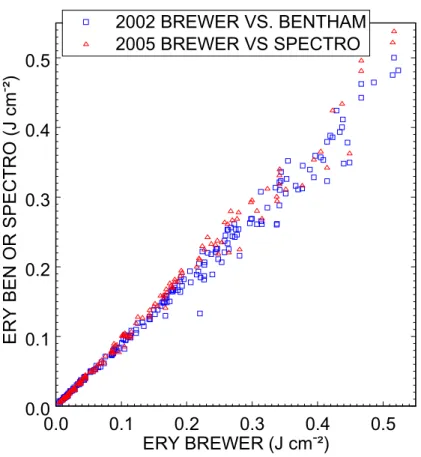
A comparison between daily erythemal irradiation derived from Brewer measure-ments by this method, and daily values derived from Bentham spectra that are avail-able at time steps of 6 min at Potsdam, and from SPECTRO 320D spectra measured at one-minute time steps is shown in Fig. 2.
The uncertainty of daily erythemal UV irradiation from Brewer spectra as described
15
above was derived from the comparison with Bentham measurements to be about 12 to 14%. Daily erythemal irradiation derived by that method is shown for Lindenberg together with global irradiation for the period 1995 to 2006/2007 in Fig. 3.
2.2 Meteorological predictors
An advantage of neural networks is their capability of selecting the best combination of
20
available predictors. Different sets of meteorological input data have been tentatively used as predictors. Not only their correlation with UV irradiation, but also their daily and long-term availability, representativeness of typical atmospheric conditions, and rate of change are important in the selection of potential parameters. Cloud cover observa-tions have been performed for many decades. Unfortunately, cloud observaobserva-tions in the
25
ACPD
8, 453–488, 2008Long-term solar UV radiation reconstructed by
ANN
U. Feister et al.
Title Page
Abstract Introduction
Conclusions References
Tables Figures
◭ ◮
◭ ◮
Back Close
Full Screen / Esc
Printer-friendly Version
Interactive Discussion
been used as predictors. In addition, information on cloud variability and aerosol ex-tinction is contained in global and diffuse irradiation. Snow depth was used a predictor, though due the very few days with snow cover, its effect at low-levels sites in Central Europe is small in most cases. Depending on the availability of input data over certain time periods in the past, different versions or training sets of neural networks were
cho-5
sen. The following parameters were finally used as predictors in this study: global and diffuse irradiation, sunshine duration, column ozone, horizontal visibility, snow height, surface albedo, and minimum solar zenith angle of the day, as well as number of the month.
2.3 Short and long-term variability of data
10
The distance of only 73 km between the two sites Potsdam and Lindenberg provides a chance to look at small-scale features of input parameters, and also perform checks on their consistency. Figure 4 shows a scatter plot of daily erythemal irradiation derived from measurements at Potsdam as compared to Lindenberg.
There is a close correlation of 0.97 for all cases, and a still higher correlation of 0.99
15
for “sunny” cases, where the latter are defined here by the condition of ratios between daily diffuse and global irradiation of less than 0.5. Most of the outliers in the scatter plots occur for cloudy cases, the extremes of which are circled in Fig. 4. Looking at the scatter plot in Fig. 5 that shows the percentage ratios between daily erythemal and global radiation at Potsdam compared to Lindenberg, the same circled extreme
20
cases are no outliers any more. This implies that they are mainly due to different cloud conditions prevailing for most of the day at the two sites. For sunny cases, different aerosol conditions can play a role as well because of their different location to the big city of Berlin (Lindenberg southeast of the city, and Potsdam southwest of Berlin). The highest ratio between erythemal and global irradiation at both sites occurred on a dim
25
day (13 August 2001) with 8 Okta of Sc during the whole day, and very small values of daily global irradiation of 363 J cm−2at Potsdam and 452 J cm−2at Lindenberg.
ACPD
8, 453–488, 2008Long-term solar UV radiation reconstructed by
ANN
U. Feister et al.
Title Page
Abstract Introduction
Conclusions References
Tables Figures
◭ ◮
◭ ◮
Back Close
Full Screen / Esc
Printer-friendly Version
Interactive Discussion
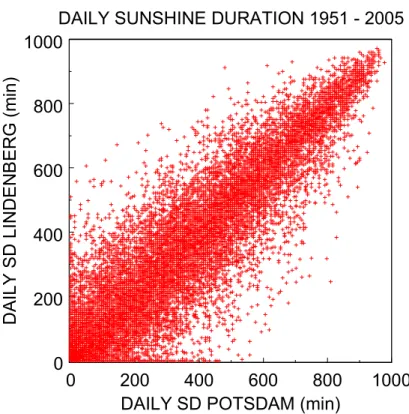
which compares daily sunshine duration of Potsdam and Lindenberg, shows a strong scatter, although the correlation coefficient of 0.95 is quite high. If we look at monthly totals of sunshine duration, the scatter between sunshine duration at both sites is much smaller, and the correlation with 0.99 still higher.
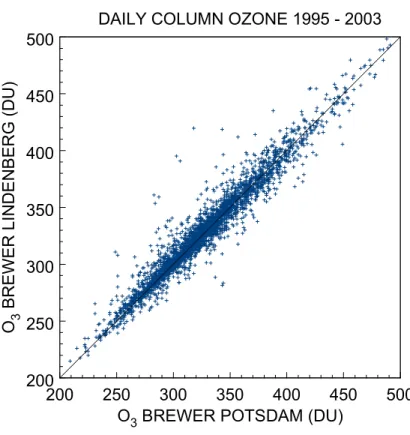
Different to sunshine duration, atmospheric column ozone varies on much larger
5
spatial scales, as is shown in Fig. 7. Therefore, ozone values at both sites show a close correspondence in the majority of cases, but in some cases larger differences can be observed that may occur at times of frontal passages, or that may be due smaller scale stratospheric patterns.
The monthly mean ozone values in Fig. 8 show the seasonal ozone variation and
10
long-term changes that the ANN must cope with and that should be reflected in the reconstructed erythemal und UV-B radiation.
3 Reconstruction of UV irradiation by Artificial Neural Networks (ANN)
3.1 The ANN method
A neural network imitates the human brain’s own problem solving ability. It applies
15
knowledge gained from past experience and previously solved examples to new prob-lems or situations by building a system of “neurons” that takes new decisions and provides predictions. In this project, the NeuroShell 2 software, release 4 by Ward Systems Group, Inc. has been used to design different neural network versions for each set or combination of input parameters. In addition to the advantages of ANN
20
discussed in Sect. 1, it needs to be taken into account that all features of the input data, i.e. not only the complex atmospheric variability, but also errors and uncertainties of measurements, for example cosine errors of UV radiation measurements or errors in the UV radiation dose values that are used for training, will be transferred to the ANN, and can be reflected in the model results. More details on the ANN method, as it is
25
ACPD
8, 453–488, 2008Long-term solar UV radiation reconstructed by
ANN
U. Feister et al.
Title Page
Abstract Introduction
Conclusions References
Tables Figures
◭ ◮
◭ ◮
Back Close
Full Screen / Esc
Printer-friendly Version
Interactive Discussion
Input data of the ANN are connected to output data by hidden layers. Each data set consisting of measured daily UV irradiation and a combination of predictors was divided into a training set (15% of the data), a production set (70% of the data), and a test set (15% of the data). Due to the interrelation between predictors, each combination of input data that covers a certain time period at a site, had to be trained separately.
5
Table 2 shows that 10 predictors and 6 combinations of input data were selected ac-cording to their availability over certain time periods at the Potsdam site. When going back in time, the number of input parameters becomes smaller. Also shown are the resulting uncertainties (bias and RMS) in reconstructed daily UV irradiation in depen-dence of the ANN version. It can be seen in Table 2 that the most pronounced RMS
10
increases occur, if “important” predictors are left, such as for column ozone (between ANN#3 and ANN#4), and global and diffuse radiation (between ANN#1 and ANN#2). If global and diffuse irradiation is available, the RMS between measured and recon-structed UV irradiation is between 11% and 17%. It increases to the range of 16% to 22%, if sunshine duration is the only measured input parameter, in addition to month
15
and minimum solar zenith angle. With the relative standard deviation of daily UV irra-diation of between 75% and 95%, even the ANN versions using a small set of input parameters and resultant higher uncertainties do provide a gain of information on the day-to day variation of solar UV irradiation as compared to the use of climatological averages.
20
3.2 Sensitivity tests
A few sensitivity tests were performed to illustrate the effect of variations of input pa-rameters to the reconstructed UV radiation. Cloud effects on the reconstruction can be seen in Fig. 9 that shows a scatter plot between measured and reconstructed erythe-mal irradiation at Potsdam for cases with sunny, cloudy and overcast (or heavy cloudy)
25
conditions, as defined by ratios between daily diffuse and global irradiation. A cloud effect on the reconstruction quality is not obvious in Fig. 9.
ACPD
8, 453–488, 2008Long-term solar UV radiation reconstructed by
ANN
U. Feister et al.
Title Page
Abstract Introduction
Conclusions References
Tables Figures
◭ ◮
◭ ◮
Back Close
Full Screen / Esc
Printer-friendly Version
Interactive Discussion
months for ozone amounts changed by −20%, −10%, . . . , +10%, +20% is shown in Fig. 10. As is reasonable, the ozone effect is negligible for UV-A radiation. For erythemal irradiation, an ozone change of 10% results in a change of about 10%, and of between 5% to 20% for UV-B irradiation. The latter shows a more pronounced seasonal dependence with a higher effect in the winter months, and smaller values in
5
summer than erythemal radiation.
A third test showed that the use of climatological averages of daily column ozone values instead of neglecting ozone as a predictor does not significantly improve the reconstruction of erythemal UV radiation. This result is somewhat surprising, because the seasonal ozone variation at mid-latitudes is comparable or even higher than its
10
general day-to-day variability. On the other hand, the sensitivity test was performed with data of the period 1995 to 2003. As can be seen in Fig. 8, due to the reduced ozone values after the Mt. Pinatubo eruption in 1991 and the long-term ozone decline since about 1970, the seasonal ozone variation at the end of the last century and beginning of the present century appears to be somewhat smaller compared to earlier
15
years before that period.
4 Results
4.1 Reconstructed UV radiation at Potsdam
Using the different ANN versions for the time periods, daily UV irradiation was recon-structed backwards in time. Figure 11 shows the reconrecon-structed erythemal irradiation
20
together with measured sunshine duration, global radiation and column ozone for the site Potsdam in the period 1893 to 2003. In this plot, monthly running averages were derived from the reconstructed daily values to remove the seasonal variation, and bet-ter reveal long-bet-term features in the data records. In addition to the running averages, polynomial fits have been added just to show more clearly long-term variations. They
25
ACPD
8, 453–488, 2008Long-term solar UV radiation reconstructed by
ANN
U. Feister et al.
Title Page
Abstract Introduction
Conclusions References
Tables Figures
◭ ◮
◭ ◮
Back Close
Full Screen / Esc
Printer-friendly Version
Interactive Discussion
dimming” effect between about 1960 and 1990 (Ohmura and Lang, 1989), the subse-quent increase known as “global brightening” (Wild et al., 2005) that are also obvious in measured global radiation, and the decline of atmospheric ozone since about 1970, as well as the effect of the Mt. Pinatubo aerosols on ozone in the 1990s are reflected in the reconstructed erythemal radiation. Lowest vales of sunshine duration can be
5
noticed in the first decade of the 19th century. Though it remains to be speculative, a connection to volcanic eruptions cannot be excluded that occurred in Central Amer-ica in 1902. The volcanoes Mount Pel ´ee (14.82◦N, 61.17◦W) on Martinique island and Soufri `ere on Saint Pierre (13.33◦N, 61.18◦W) erupted shortly one after the other in May 1902. Those eruptions were followed by the huge eruption of Santa Maria (14.76◦N,
10
91.55◦W) in Guatemala in October 1902 (Kelly et al., 1996). The ash cloud of the latter volcano with a volcanic explosivity index (VEI) of 6 reached a height of 28 km, and was comparable in magnitude with that of the Mt. Pinatubo eruption in 1991.
Annual totals of reconstructed erythemal, UV-B and UV-A radiation for the whole period 1893 to 2003 are shown in Fig. 12. The systematic deviations mentioned in
15
Table 2 for the different ANN versions and thus certain time periods have been removed from the values of irradiation. It would have been preferable to remove the systematic deviation in the ANN versions in the training process, though tests runs with removed systematic deviations showed that the ANN would have provided worse results of daily irradiation and thus higher rms values in extreme situations. Therefore, the bias was
20
removed only after reconstruction.
Percentage relative deviations from the overall mean values (1893–2003) for erythe-mal, UV-B and UV-A are shown in Fig. 13. UV radiation increases by a few per cent by the middle of the 1930s, and drops to low values in the 1940s. After a higher peak in the second half of the 1940s, UV radiation slowly decreases by a few per cent by the
25
second half of the 1980s. This latter decrease of UV radiation may have been a results of increasing cloud cover and/or cloud optical depths, and an effect of aerosols. The upper panel of Fig. 13 shows the ratios of diffuse to global radiation that increase from the end of the 1930s to the middle of the 1980s by about 10% to 15%, and decrease
ACPD
8, 453–488, 2008Long-term solar UV radiation reconstructed by
ANN
U. Feister et al.
Title Page
Abstract Introduction
Conclusions References
Tables Figures
◭ ◮
◭ ◮
Back Close
Full Screen / Esc
Printer-friendly Version
Interactive Discussion
by about the same amount in the years thereafter, probably as a result of changing cloud cover. The UV increase beginning at the end of the 1970s seems to be the result of decreasing cloudiness that affected all three components. The additional effect of low ozone values in the 1990s led to an additional enhancement of UV-B and erythe-mal radiation by about 5% to 10% in the 1990s in correspondence to earlier estimates
5
(Feister and Grewe, 1995).
4.2 Reconstructed UV radiation at European sites
The ANN was applied to data measured at other sites that have been collected and made available through the European SCOUT-O3 project and the COST 726 action. Overviews of the site input data sets as well as the results of comparisons between
10
different modeling approaches are given by Josefsson (2006), Koepke et al. (2006), and den Outer et al. (2008)1.
Different sets of input data were available for 8 European sites at latitudes between 41◦N and 67◦N over different time periods. Training of the ANN was performed with dif-ferent combinations of each site’s input data needed for the reconstruction over certain
15
time periods in the past. According to the focus of this study to get optimum recon-struction results for the past at each site, a site-independent approach was not applied, as was shown to be possible in an earlier study (Feister and Junk, 2006).
Table 3 shows the relative rms differences between modeled and measured daily values of erythemal radiation that range from 7% to 14%. Referred to the standard
20
deviation of measured erythemal irradiation, which is quite different at the individual sites, the ANN model gain shown in the last column of Table 3 is between 85% and 92%.
An overview of the variation of reconstructed erythemal irradiation in space and time
1
ACPD
8, 453–488, 2008Long-term solar UV radiation reconstructed by
ANN
U. Feister et al.
Title Page
Abstract Introduction
Conclusions References
Tables Figures
◭ ◮
◭ ◮
Back Close
Full Screen / Esc
Printer-friendly Version
Interactive Discussion
is shown in Fig. 14. Annual totals were derived from monthly totals that were summed up from the reconstructed daily totals. For 1 to 7 missing daily totals the monthly mean value of the same month was included to derive the monthly total, while for more than 7 d of missing data, long-term monthly averages were included to derive annual totals of UV radiation.
5
The reconstructed records of erythemal UV radiation show long-term patterns and interannual variations that reveal both similarities and differences. First, a latitudinal gradient can be seen that is mainly due to geographical differences determining so-lar zenith angle and day length. This effect combined with differences in cloudiness and the influence of other contributors leads to an annual erythemal radiation that is
10
for example at Thessaloniki (41◦N) about 2.5 as much as in Sodankyl ¨a (67◦N). The four sites Bilthoven, Hradec Kralove, Lindenberg and Potsdam with small latitudinal differences in Central Europe show very similar long-term patterns and even similar interannual variations in annual erythemal UV that can be more clearly seen in Fig. 15 showing the percentage annual anomalies derived from the annual totals referring to
15
the overall mean values at the individual sites. The long-term decrease between the 1950s and about 1980 is followed by a subsequent increase at the four sites. Opposite to the Central European sites, the sites in Finland show increasing values in the period between 1951 and the end of the 1960s, and a long-term behavior similar to the sites in Central Europe in the remaining period. Reconstructed erythemal radiation at the
20
Southern European site Thessaloniki seems to have slightly increased between 1974 and 2000. This increase appears to be smaller than at the other sites. UV radiation at Thessaloniki strongly decreases after 2000. Similarly, the short-term variation of annual erythemal radiation at Thessaloniki is different to that at the other sites. While some strong peaks such as the one in 1998 occur at all sites in Central and Northern
25
Europe, the Greek site does not show any similarity. This difference may be explained by the different amount and different effect of clouds to UV radiation in the summer months.
ACPD
8, 453–488, 2008Long-term solar UV radiation reconstructed by
ANN
U. Feister et al.
Title Page
Abstract Introduction
Conclusions References
Tables Figures
◭ ◮
◭ ◮
Back Close
Full Screen / Esc
Printer-friendly Version
Interactive Discussion
5 Conclusions
Application and use of the ANN model for the reconstruction of daily solar UV irra-diation has shown that this method is capable of modelling the complex relationship between broad-band solar UV radiation and meteorological input data. Modelled daily totals of solar UV were used to derive monthly and annual doses that show interannual
5
and decadal long-term UV variations compatible with corresponding variations of input parameters, for example global dimming, global brightening, the UV effect of long-term ozone decline, and the pulse-type effects of volcanic eruptions to the atmosphere. In-dependent application of the ANN method to 8 different sites spread across Europe shows a gain of information for modeled UV radiation at all sites, as compared to
us-10
ing average values as the only source of information. A remarkable correspondence referring to patterns of long-term changes and even interannual variability of recon-structed UV radiation has been found for sites located close in geographical latitude, while larger differences occur between the sites located at latitudes more than about 1000 km apart.
15
Acknowledgements. The support given by the European project SCOUT-O3 and the European
activity COST 726 is greatly acknowledged. We thank all the data providers of the individual European sites for making available the relevant UV data and meteorological data that have been a prerequisite of our modelling exercise.
References
20
Bais, A., Kazantzidis, A., Kazadzis, S., and Kouremeti, N.: Application of a model derived cosine correction method on Brewer spectral measurements, European Geosciences Union, Vienna, 24–29 April 2005, Geophysical Research Abstracts, Vol. 7, 07590, 2005, SRef-ID: 1607-7962/gra/EGU05-A-07590, U05-A-07590, 2005.
Bais, A. F. and Lubin, D.: Surface Ultraviolet Radiation: Past, Present, and Future, in: Scien-25
ACPD
8, 453–488, 2008Long-term solar UV radiation reconstructed by
ANN
U. Feister et al.
Title Page
Abstract Introduction
Conclusions References
Tables Figures
◭ ◮
◭ ◮
Back Close
Full Screen / Esc
Printer-friendly Version
Interactive Discussion Chevallier, F., Ch ´eruy, F., Scott, N. A., and Ch ´edin, A.: A Neural Network Approach for a Fast
and Accurate Computation of a Longwave Radiative Budget, J. Appl. Meteorol., 37, 1385– 1397, 1998.
CIE: A reference action spectrum for ultraviolet induced erythema in human skin. CIE Publica-tion 106/4 (ISBN 35 900 734 46 1), Research note by McKinlay, A. F. and Diffey, B. L., CIE 5
Journal, 6, 17–22, 1987.
Feister, U. and Grewe, R.: Higher UV radiation inferred from low ozone levels at northern mid-latitudes in 1992 and 1993, Global Planet. Change, 11, 25–34, 1995.
Feister, U., Grewe, R., and Gericke, K.: A method for correction of cosine errors in measure-ments of spectral UV irradiance, Sol. Energy, 60(6), 313–332, 1997.
10
Feister, U., J ¨akel, E., and Gericke, K.: Parameterization of daily solar global ultraviolet irradia-tion, Photochem. Photobiol., 76, 281–293, 2002.
Feister, U. and Junk, J.: Reconstruction of daily solar UV irradiation by an Artificial Neural Network, SPIE, Vol. 6362-94, 63622H, 1–11, 2006.
Feister, U., Kaifel A., Grewe, R.-D., Kaptur, J., Reutter, O., Wohlfart, M., and Gericke, K.: Fast 15
measurements of solar spectral irradiance – first performance results of two novel spectro-radiometers, Opt. Eng., 44(4), 041007-1–041007-9, 2005.
Josefsson, W.: UV-radiation 1983–2003 measured in Norrk ¨oping, Sweden, Theor. Appl. Clima-tol., 83(1–4), 59–76, doi:10.1007/s00704-005-0160-1, 2006.
Junk, J., Feister, U., and Helbig, A.: Reconstruction of daily solar UV irradiation from 1893 to 20
2002 in Potsdam, Germany, Int. J. Biometeorol., 51, 505–512, 2007.
Kelly, P. M, Jones, P. D., and Pengqun, J.: The spatial response of the climate system to explosive volcanic eruptions, Int. J. Climatol., 16, 537–550, 1996.
Koepke, P., Debacker, H., Bais, A., Curylo, A., Eerme, K., Feister, U., Johnsen, B., Junk, J., Krzyscin, J., Lindfors, A., Olseth, J. A., den Outer, P., Pribullova, A., Schmalwieser, A. W., 25
Slaper, H., Staiger, H., Verdebout, J., Vuilleumier, L, and Weihs, P.: Modelling solar UV radiation in the past: comparison of algorithms and input data, Remote Senisng of Clouds and the Atmosphere X1, SPIE, 6362-42, 636215-1–636215-11, 2006.
Metzdorf, J., Stock, K. D., Sperfeld, P., Sperling, A., Winter, S., and Wittchen, T.: Aspects of quality assurance in monitoring solar UV irradiance, Metrologia, 40, 66–69, 2003.
30
Nagel, D. and Leiterer, U.: Brewer Spektrophotometer MK IV: BMFT-Projekt “Optische Feldmessmethoden”: Abschlussbericht, Offenbach am Main, Deutscher Wetterdienst, Abt. Forschung 22, 1995.
ACPD
8, 453–488, 2008Long-term solar UV radiation reconstructed by
ANN
U. Feister et al.
Title Page
Abstract Introduction
Conclusions References
Tables Figures
◭ ◮
◭ ◮
Back Close
Full Screen / Esc
Printer-friendly Version
Interactive Discussion Ohmura, A. and Lang, H.: Secular variation of global radiation in Europe. In IRS ’88: Current
Problems in Atmospheric Radiation, edited by: Lenoble, J. and Geleyn, J.-F., A. Deepak Publ., Hampton, VA, Publ., 635, 298–301, 1989.
Oliveira, A. P., Soares, J., Boˇznar, M. Z., Mlakar, P., and Escobedo, J. F.: An Application of Neural Network Technique to Correct the Dome Temperature Effects on Pyrgeometer 5
Measurements, J. Atmos. Ocean. Tech., 23, 80–89, 2006.
Schreder, J.: User’s manual. UV J1002. Entrance optics for global irradiance measurements, available at:www.schreder-cms.com, 2003.
Slaper, H., Reinen, A. J. M., Blumthaler, M., Huber, M., and Kuik, F.: Comparing ground-level spectrally resolved solar UV measurements using various instruments: a technique resolving 10
effects of of wavelength shift and slit width, Geophys. Res. Lett., 22, 2721–2724, 1995. Wild, M., Gilgen, H., Roesch, A., Ohmura, A., Long, C. N., Dutton, E. G., Forgan, B., Kallis,
ACPD
8, 453–488, 2008Long-term solar UV radiation reconstructed by
ANN
U. Feister et al.
Title Page
Abstract Introduction
Conclusions References
Tables Figures
◭ ◮
◭ ◮
Back Close
Full Screen / Esc
Printer-friendly Version
Interactive Discussion
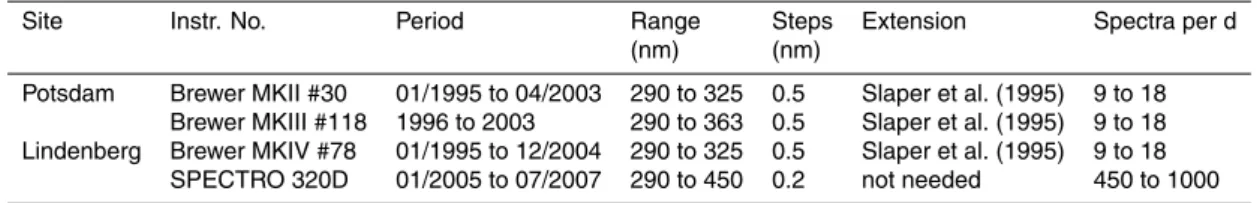
Table 1.Instruments, time periods, wavelength range, wavelength steps, extension of spectra
to 400 nm, number of spectra per d, cosine correction, calibration and calibration checks of spectroradiometers at the sites Potsdam and Lindenberg.
Site Instr. No. Period Range Steps Extension Spectra per d (nm) (nm)
Potsdam Brewer MKII #30 01/1995 to 04/2003 290 to 325 0.5 Slaper et al. (1995) 9 to 18 Brewer MKIII #118 1996 to 2003 290 to 363 0.5 Slaper et al. (1995) 9 to 18 Lindenberg Brewer MKIV #78 01/1995 to 12/2004 290 to 325 0.5 Slaper et al. (1995) 9 to 18
SPECTRO 320D 01/2005 to 07/2007 290 to 450 0.2 not needed 450 to 1000
Site Instr. No. Cosine correction Calibration Checks
Potsdam MKII #30, MKIII #118 Feister et al. (1997) DXW 1000 W 50 W Brewer lamps traceable to PTB
Lindenberg Brewer MKIV #78 Bais et al. (2005) International Ozone Services 50 W Brewer lamps Lindenberg SPECTRO 320D not needed FEL 1000 W from PTB 200 W KS03
Metzdorf et al. (2003)
ACPD
8, 453–488, 2008Long-term solar UV radiation reconstructed by
ANN
U. Feister et al.
Title Page
Abstract Introduction
Conclusions References
Tables Figures
◭ ◮
◭ ◮
Back Close
Full Screen / Esc
Printer-friendly Version
Interactive Discussion
Table 2. Predictors, time periods and resulting uncertainties of different ANN versions for the
site Potsdam. A is the percentage bias, and B the percentage RMS between measured and reconstructed daily UV-A, UV-B and erythemal irradiation.
No Predictors Period UV-A (%) UV-B (%) ERY (%)
A B A B A B
#6 1 2 3 4 5 6 7 8 9 10 * 1984–2003 −5.5 15.5 −5.4 15.2 −4.5 14.4 #5 1 2 3 4 5 6 7 8 10 1975–1983 −1.0 13.6 −1.8 14.5 −1.2 14.5 #4 1 2 3 4 5 6 7 10 1964–1974 −1.0 14.0 −5.8 14.4 −3.9 13.9 #3 1 2 3 4 5 6 10 1951–1963 0.0 13.7 1.9 17.4 −0.2 16.4
#2 1 2 3 4 10 1937–1950 2.2 11.2 9.4 15.9 5.8 15.0
#1 1 2 10 1893–1936 5.0 15.8 10.6 22.0 7.9 21.0
ACPD
8, 453–488, 2008Long-term solar UV radiation reconstructed by
ANN
U. Feister et al.
Title Page
Abstract Introduction
Conclusions References
Tables Figures
◭ ◮
◭ ◮
Back Close
Full Screen / Esc
Printer-friendly Version
Interactive Discussion
Table 3.Relative standard deviations of measured daily erythemal irradiation (RSTD), and root
mean square differences (RMS) between modeled and measured daily erythemal irradiation at different sites. Gain of information is shown in the last column.
Site RSTD RMS (1 – RMS / RSTD)*100
(%) (%) (%)
Bilthoven 89.3 12.5 86
Hradec Kralove 91.9 13.1 86
Jokioinen 76.4 8.9 88
Lindenberg 95.6 8.4 91
Norrk ¨oping 102.8 8.2 92
Potsdam 95.5 14.4 85
Sodankyl ¨a 76.9 10.9 86
Thessaloniki 61.1 6.6 89
ACPD
8, 453–488, 2008Long-term solar UV radiation reconstructed by
ANN
U. Feister et al.
Title Page
Abstract Introduction
Conclusions References
Tables Figures
◭ ◮
◭ ◮
Back Close
Full Screen / Esc
Printer-friendly Version
Interactive Discussion
!
"#$ # % &
!
'
$
Fig. 1.Erythemal UV irradiance ERY from SPECTRO 320 D measurements (lower panel),
ACPD
8, 453–488, 2008Long-term solar UV radiation reconstructed by
ANN
U. Feister et al.
Title Page
Abstract Introduction
Conclusions References
Tables Figures
◭ ◮
◭ ◮
Back Close
Full Screen / Esc
Printer-friendly Version
Interactive Discussion
% (
)
#
'
*
%
(
)
+'
# ,
-+' '*
Fig. 2. Daily erythemal UV irradiation derived from Brewer spectra compared to those derived
from Bentham spectra at Potsdam 2002, and SPECTRO 320 D spectra at Lindenberg 2005.
ACPD
8, 453–488, 2008Long-term solar UV radiation reconstructed by
ANN
U. Feister et al.
Title Page
Abstract Introduction
Conclusions References
Tables Figures
◭ ◮
◭ ◮
Back Close
Full Screen / Esc
Printer-friendly Version
Interactive Discussion
,
-"
$
"
"
#
%
"
$
"
"
#
%
(
"#$ #
Fig. 3. Daily erythemal irradiation derived from Brewer and Spectro data (lower panel) and
ACPD
8, 453–488, 2008Long-term solar UV radiation reconstructed by
ANN
U. Feister et al.
Title Page
Abstract Introduction
Conclusions References
Tables Figures
◭ ◮
◭ ◮
Back Close
Full Screen / Esc
Printer-friendly Version
Interactive Discussion * '$ - % )
"#
$
#
%
)
,
$" ' .
Fig. 4.Daily erythemal irradiation at Potsdam as compared to Lindenberg over the period 1995
to 2003 for all-weather conditions and “sunny” conditions defined by ratios between daily diffuse and global irradiation of less than 0.5.
ACPD
8, 453–488, 2008Long-term solar UV radiation reconstructed by
ANN
U. Feister et al.
Title Page
Abstract Introduction
Conclusions References
Tables Figures
◭ ◮
◭ ◮
Back Close
Full Screen / Esc
Printer-friendly Version
Interactive Discussion
* '$ - !
"#
$
#
!
&
Fig. 5.Percentage ratios between daily erythemal and global irradiation at Potsdam compared
ACPD
8, 453–488, 2008Long-term solar UV radiation reconstructed by
ANN
U. Feister et al.
Title Page
Abstract Introduction
Conclusions References
Tables Figures
◭ ◮
◭ ◮
Back Close
Full Screen / Esc
Printer-friendly Version
Interactive Discussion $ " '$ * '$ - /
$
"
'
$
"#
$
#
/
$ " ' #',"# $ " #
Fig. 6. Daily sunshine duration at Potsdam as compared to Lindenberg in the period 1951 to
2005.
ACPD
8, 453–488, 2008Long-term solar UV radiation reconstructed by
ANN
U. Feister et al.
Title Page
Abstract Introduction
Conclusions References
Tables Figures
◭ ◮
◭ ◮
Back Close
Full Screen / Esc
Printer-friendly Version
Interactive Discussion
* '$ - $
"#
$
#
$
$ " -# 0 #
ACPD
8, 453–488, 2008Long-term solar UV radiation reconstructed by
ANN
U. Feister et al.
Title Page
Abstract Introduction
Conclusions References
Tables Figures
◭ ◮
◭ ◮
Back Close
Full Screen / Esc
Printer-friendly Version
Interactive Discussion
-#
0
#
$
1 3, , )
- # , $ ' #
- # , $ ' #
- # ,
* '$
-Fig. 8.Monthly mean column ozone from Dobson observations as well as 12 months running
ozone averages of Dobson and Brewer ozone data at Potsdam.
ACPD
8, 453–488, 2008Long-term solar UV radiation reconstructed by
ANN
U. Feister et al.
Title Page
Abstract Introduction
Conclusions References
Tables Figures
◭ ◮
◭ ◮
Back Close
Full Screen / Esc
Printer-friendly Version
Interactive Discussion
$ .
. $ .
. $ .
,- ' %
,
-$
%
Fig. 9. Measured and reconstructed daily erythemal irradiation at Potsdam 1995–2003 for
ACPD
8, 453–488, 2008Long-term solar UV radiation reconstructed by
ANN
U. Feister et al.
Title Page
Abstract Introduction
Conclusions References
Tables Figures
◭ ◮
◭ ◮
Back Close
Full Screen / Esc
Printer-friendly Version
Interactive Discussion
- # ,
*
#
+
,
#
+
!
!
!
1 !
1 !
1 ! - # ,
*
#
+
,
#
, -
!
! ! 1 ! 1 ! 1 !
Fig. 10. Percentage difference between reconstructed erythemal (upper panel) and UV-B
(lower panel) for average column ozone and ozone changed by amounts between−20% and
+20%.
ACPD
8, 453–488, 2008Long-term solar UV radiation reconstructed by
ANN
U. Feister et al.
Title Page
Abstract Introduction
Conclusions References
Tables Figures
◭ ◮
◭ ◮
Back Close
Full Screen / Esc
Printer-friendly Version
Interactive Discussion
%
(
)
%
)
$
'
$
2
, - "
' #',"# $ " # "
0 # * '$
-Fig. 11.12-months running averages of monthly values of reconstructed erythemal irradiation
ACPD
8, 453–488, 2008Long-term solar UV radiation reconstructed by
ANN
U. Feister et al.
Title Page
Abstract Introduction
Conclusions References
Tables Figures
◭ ◮
◭ ◮
Back Close
Full Screen / Esc
Printer-friendly Version
Interactive Discussion
+
%
(
+
%
(
+
%
* '$ -& ## '
+ +
Fig. 12. Annual totals of reconstructed erythemal, UV-B and UV-A radiation at Potsdam
be-tween 1893 and 2003.
ACPD
8, 453–488, 2008Long-term solar UV radiation reconstructed by
ANN
U. Feister et al.
Title Page
Abstract Introduction
Conclusions References
Tables Figures
◭ ◮
◭ ◮
Back Close
Full Screen / Esc
Printer-friendly Version
Interactive Discussion
$
#
-!
+
#
-!
+ + $
Fig. 13.Anomalies, i.e. annual totals of reconstructed UV irradiation, for erythemal, UV-B and
ACPD
8, 453–488, 2008Long-term solar UV radiation reconstructed by
ANN
U. Feister et al.
Title Page
Abstract Introduction
Conclusions References
Tables Figures
◭ ◮
◭ ◮
Back Close
Full Screen / Esc
Printer-friendly Version
Interactive Discussion
#
#
,
-"
$
"
"
#
%
' $ #3 4 5 # % 3" "# # 5 # # 36*"# 5 # * '$ - 5 #
"#$ # 5 # " , + # 5 # , 3 + 5 #
, '' #"3" 5 #
Fig. 14. Annual erythemal irradiation reconstructed by the ANN method for the sites Sodankyl ¨a/Finland (67.36◦N, 26.63◦E), Jokioinen/Finland (60.81◦N, 23.49◦E), Norrk ¨oping/Sweden (58.58◦N, 16.15◦E), Potsdam/Germany (52.37◦N, 13.08◦E), Linden-berg/Germany (52.21◦N, 14.12◦E), Bilthoven/The Netherlands (52.12◦N, 5.19◦E), Hradec Kralove/Czech Republic (50.18◦N, 15.83◦E), and Thessaloniki/Greece (40.63◦N, 22.95◦E).
ACPD
8, 453–488, 2008Long-term solar UV radiation reconstructed by
ANN
U. Feister et al.
Title Page
Abstract Introduction
Conclusions References
Tables Figures
◭ ◮
◭ ◮
Back Close
Full Screen / Esc
Printer-friendly Version
Interactive Discussion
#
-!
' $ #3 4 5 #
% 3" "# # 5 #
# 36*"# 5 #
* '$ - 5 #
"#$ # 5 #
" , + # 5 #
, 3 + 5 #
, '' #"3" 5 # #
-!
Fig. 15. Relative anomalies referred to the sites’ overall averages of annual total erythemal