www.atmos-chem-phys.net/16/2493/2016/ doi:10.5194/acp-16-2493-2016
© Author(s) 2016. CC Attribution 3.0 License.
Short- and long-term variability of spectral solar UV irradiance at
Thessaloniki, Greece: effects of changes in aerosols,
total ozone and clouds
Ilias Fountoulakis1, Alkiviadis F. Bais1, Konstantinos Fragkos1, Charickleia Meleti1, Kleareti Tourpali1, and Melina Maria Zempila1,a
1Aristotle University of Thessaloniki, Laboratory of Atmospheric Physics, Thessaloniki, Greece anow at: Natural Resource Ecology Laboratory, Colorado State University, Fort Collins, USA
Correspondence to:Ilias Fountoulakis ([email protected])
Received: 24 November 2015 – Published in Atmos. Chem. Phys. Discuss.: 18 December 2015 Revised: 18 February 2016 – Accepted: 19 February 2016 – Published: 1 March 2016
Abstract. In this study, we discuss the short- and the long-term variability of spectral UV irradiance at Thessaloniki, Greece, using a long, quality-controlled data set from two Brewer spectrophotometers. Long-term changes in spectral UV irradiance at 307.5, 324 and 350 nm for the period 1994– 2014 are presented for different solar zenith angles and dis-cussed in association with changes in total ozone column (TOC), aerosol optical depth (AOD) and cloudiness observed in the same period. Positive changes in annual mean anoma-lies of UV irradiance, ranging from 2 to 6 % per decade, have been detected both for clear- and all-sky conditions. The changes are generally greater for larger solar zenith angles and for shorter wavelengths. For clear-skies, these changes are, in most cases, statistically significant at the 95 % confi-dence limit. Decreases in the aerosol load and weakening of the attenuation by clouds lead to increases in UV irradiance in the summer, of 7–9 % per decade for 64◦solar zenith
an-gle. The increasing TOC in winter counteracts the effect of decreasing AOD for this particular season, leading to small, statistically insignificant, negative long-term changes in ir-radiance at 307.5 nm. Annual mean UV irir-radiance levels are increasing from 1994 to 2006 and remain relatively sta-ble thereafter, possibly due to the combined changes in the amount and optical properties of aerosols. However, no sta-tistically significant corresponding turning point has been de-tected in the long-term changes of AOD. The absence of sig-natures of changes in AOD in the short-term variability of irradiance in the UV-A may have been caused by changes in the single scattering albedo of aerosols, which may counter-act the effects of changes in AOD on irradiance. The
anti-correlation between the year-to-year variability of the irradi-ance at 307.5 nm and TOC is clear and becomes clearer as the AOD decreases.
1 Introduction
Although ultraviolet (UV) radiation is only a small fraction (<10 %) of the total solar radiation that reaches the Earth’s surface, it is vital for the life on Earth (Asta et al., 2011; Häder et al., 2015; Lucas et al., 2015; Madronich et al., 2015; UNEP, 2010; Williamson et al., 2014). The amount of solar UV radiation reaching the atmosphere is changing periodically due to changes in the Earth–Sun distance and the solar activity. Solar radiation with wavelengths shorter than 290 nm is entirely blocked by the atmosphere, while for longer wavelengths the fraction that penetrates to the sur-face depends mainly on the solar zenith angle, the compo-sition of the atmosphere and the characteristics of the surface (Kerr and Fioletov, 2008). The interaction between the UV radiation, the atmospheric constituents and the characteris-tics of the surface is complicated and not yet fully understood (Bernhard et al., 2007; Kerr and Fioletov, 2008; Meinander et al., 2009). The geophysical parameters that mainly affect the levels of the surface UV irradiance are: ozone, clouds, surface reflectivity and aerosols (Arola et al., 2003; Bais et al., 1993; Bernhard et al., 2007; WMO, 2007).
irradi-ance (Kerr and McElroy, 1993; Madronich et al., 1998). The successful implementation of the Montreal protocol decel-erated the weakening of the ozone layer (Egorova et al., 2013; Mäder et al., 2010; Newman and McKenzie, 2011) and many recent studies indicate the first signs of recovery over the Northern Hemisphere (Kuttippurath et al., 2013; McLin-den and Fioletov, 2011; Newchurch et al., 2003; Smedley et al., 2012). Signs from the onset of ozone recovery since the late 1990s on surface UV-B irradiance have been mainly de-tected over the northern high latitudes; recent studies indi-cate that UV-B has been declining during the last 2 decades (Bernhard, 2011; Eleftheratos et al., 2014). However, dur-ing the same period, both the UV-B and the UV-A irradiance are increasing over many locations in the Northern Hemi-sphere mid-latitudes, mainly due to the negative trends in the amount of clouds and aerosols (De Bock et al., 2014; Fitzka et al., 2012; Román et al., 2015; Smedley et al., 2012; Zerefos et al., 2012). In a recent study, Fragkos et al. (2015) showed that in Thessaloniki, even under extreme high (low) total ozone column (TOC) conditions, the erythemal irradi-ance can be lower (higher) than its climatological values due to the dominant effect of aerosols. Zerefos et al. (2012) sug-gest that over Canada, Europe and Japan there is a statisti-cally significant evidence of a slowdown or even a turning point in the upward UV-B trends after 2006, which is an in-dication that since then the negative trends of aerosols are no more the main driver of the long-term changes in UV-B irradiance.
In the next decades, ozone, aerosols, clouds and surface re-flectivity are projected to undergo important changes (IPCC, 2013). Changes in these factors may alter the levels of the surface UV irradiance (Bais et al., 2015, 2011; Hegglin and Shepherd, 2009; Tourpali et al., 2009; Watanabe et al., 2011) with important impacts on human health and the balance of the ecosystems (UNEP, 2010; Williamson et al., 2014). How-ever, the uncertainties in the spatial and temporal variability, the magnitude and the direction of the projected changes of surface UV irradiance are still high (Bais et al., 2015). Thus, good quality measurements of the spectral UV irradiance and the main factors controlling its levels at the Earth’s sur-face are of great importance for achieving better understand-ing and more accurate modellunderstand-ing of the interactions among UV radiation, ozone, aerosols, clouds and surface reflectivity (García et al., 2015; Kreuter et al., 2014; Mayer and Kylling, 2005; Schwander et al., 1997).
Accurate knowledge of the levels of spectral surface UV irradiance is necessary in order to quantify effects on the health of humans (Kazantzidis et al., 2015; Webb et al., 2010) and ecosystems (Ballare et al., 2011; Häder et al., 2011), and prevent potential impacts from over- or under-exposure to UV radiation (Lucas et al., 2015). Additionally, reliable esti-mations of the trends of spectral surface UV irradiance pro-vide useful information for assessing these impacts and for adopting proper measures (Morgenstern et al., 2008; New-man and McKenzie, 2011; van Dijk et al., 2013).
Climatolo-gies and trends of surface UV irradiance (spectral or broad-band) can be derived either directly from ground-based mea-surements (Fitzka et al., 2012; Glandorf et al., 2005; Zefos, 2002), or indirectly from measurements of surface re-flectivity, ozone, aerosols and cloudiness derived either from satellites (Damiani et al., 2014; Fioletov et al., 2004; Li et al., 2000), or from ground-based instruments (Antón et al., 2011; Román et al., 2015; Walker, 2009). The uncertainties of these parameters and the applied methodologies increase the uncertainty of the indirectly derived UV irradiance, when compared to measurements (Cordero et al., 2013; Weihs and Webb, 1997). Thus, long records of good quality measure-ments of UV irradiance lead to more reliable estimations of its short-term and long-term changes (Arola et al., 2003; Weatherhead et al., 1998).
The present study aims at the quantification of the long-term changes in surface UV irradiance using spectral mea-surements which have been recorded since 1990 at Thes-saloniki (Bais et al., 2001; Garane et al., 2006; Gröbner et al., 2006), one of the longest time series globally (Glandorf et al., 2005). An important aspect is also the attribution of the trends and variability of UV irradiance to changes in the TOC, the aerosol optical depth (AOD) and cloudiness during the same period. Special emphasis is given to the reported slowdown of the positive trends of UV irradiance (Zerefos et al., 2012) and their correlation with the reported aerosol de-cline over the Northern Hemisphere (Turnock et al., 2015).
2 Instrumentation and data
In the 1980s, increased concern about stratospheric ozone de-pletion (Farman et al., 1985; Solomon et al., 1986) and its ef-fect on the levels of UV radiation at the Earth’s surface (Kerr and McElroy, 1993; Madronich et al., 1995; Zerefos, 2002) led to increased deployment of ground-based instruments worldwide (Fioletov et al., 1999), to monitor the TOC and the surface UV irradiance. Among these instruments, sev-eral Brewer spectrophotometers (Brewer, 1973; Kerr et al., 1985) were deployed at different locations including Thessa-loniki, Greece, where the first commercially available single-monochromator Brewer with serial number 005 (B005) was installed in 1982. Since then B005 has performed continuous measurements of the TOC and the columnar SO2(Bais et al.,
1993, 1985; Meleti et al., 2012; Zerefos, 1984). These mea-surements are also used to derive the aerosol optical depth at specific UV-B wavelengths (Kazadzis et al., 2007). Monitor-ing of spectral UV irradiance with B005 started in 1990 (Bais et al., 1996, 1993; Garane et al., 2006). Since 1993, a second, double-monochromator, Brewer spectrophotometer with se-rial number 086 (B086) has also operated at Thessaloniki for continuous monitoring of the spectral UV irradiance (Bais et al., 1996). Both instruments are located at the facilities of the Laboratory of Atmospheric Physics (latitude 40.634◦N,
The spectral measurements of B005 cover the wavelength range 290–325 nm in steps of 0.5 nm and spectral resolu-tion of about 0.55 nm (FWHM). The corresponding spectral range for B086 is 290–363 nm, with the same wavelength step and very similar spectral resolution. The UV data set of both instruments was quality checked and re-evaluated up to the end of 2005 (Garane et al., 2006) and has been used in different studies (Kazadzis et al., 2009; Kazantzidis et al., 2006, 2009; Meleti et al., 2009). Garane et al. (2006) pre-sented a comprehensive analysis of the uncertainties from all known sources that may affect the calibration procedures and the spectral measurements of B005 and B086. In this study the overall 1σuncertainty of the measured irradiance was es-timated to 5 % for B086 and from 6.5 % near 305 nm to 5 % near 320 nm for B005. Recently, the quality control and the re-evaluation of the post-2005 data set have been completed and the time series is now extended to the end of 2014, com-prising about 170 000 spectra for B005 and 140 000 spectra for B086.
Direct spectral irradiance measurements performed with B005 at 306.3, 310.0, 313.5, 316.8 and 320.1 nm are used to derive the TOC (Kerr et al., 1981) and the AOD (Gröb-ner and Meleti, 2004; Meleti and Cappellani, 2000). The un-certainty of the TOC measurements is estimated to about 1 % or less (Kerr et al., 1985), while for the AOD the un-certainty is of the order of 0.04 at 320 nm for air mass 1.4 (Kazadzis et al., 2007). Comparisons with AOD data for the period 2005–2014 provided from a collocated Cimel sun-photometer which is part of AERONET (http://aeronet.gsfc. nasa.gov/) revealed an overall agreement to within 0.1 for air mass values up to 3.2.
For the trend analysis, which will be discussed later, data for the 11-year solar cycle and the Quasi-Biennial Oscilla-tion (QBO) of the winds in the equatorial stratosphere have been used. Monthly means for the solar flux at 10.7 cm were downloaded from the NOAA national geophysical data cen-tre (http://www.ngdc.noaa.gov/stp/space-weather/solar-data/ solar-features/solar-radio/noontime-flux/penticton/), while for the QBO wind data were downloaded from the Freie Universität Berlin (http://www.geo.fu-berlin.de/en/met/ag/ strat/produkte/qbo/index.html).
The spectral irradiances used in this study are averages of five measurements (within ±1 nm about the nominal wave-length) and the analysis is performed for 307.5, 324 and 350 nm. The irradiance for the former two wavelengths is derived from both instruments while for 350 nm it is derived only from B086. The solar irradiance at 307.5 nm is strongly absorbed by ozone in contrast to the other two wavelengths where the ozone absorption is either weak (324 nm) or negli-gible (350 nm). In many studies, the irradiance at 305 nm has been used to estimate the effect of TOC on UVB irradiance. However, for large solar zenith angles and/or under cloudy conditions the effects from the dark signal and the stray light are very important for such low wavelength, especially for the single-monochromator Brewers (Karppinen et al., 2014).
Therefore, in the present study the irradiance at 307.5 nm has been chosen because it is stronger than at 305 nm, with sig-nificantly higher signal-to-noise ratio required for more ac-curate determination of trends, while the effect of ozone ab-sorption remains very strong. Additionally, the changes in ir-radiance for 307.5 nm are more representative of the changes in the erythemal irradiance, which is an important, human-health-related metric. Finally, the effect of SO2 absorption
in relation to the effect of ozone absorption at 307.5 nm is the weakest in the range 306–309 nm. The changes in irra-diance at 324 nm and 350 nm for clear-skies are mainly de-termined by the changes in the amount and optical proper-ties of the aerosols. Thus the effect of TOC on the long-term trends can be estimated by comparing the trend in irradiance at 307.5 nm with the trend at these longer wavelengths. In order to detect the presence of clouds during measurements and separate the data under clear-skies, data from a collo-cated pyranometer (type Kipp & Zonen CM-21) recorded at high temporal resolution (once per minute) have been used (Bais et al., 2013).
The long-term variability of the spectral UV irradiance was investigated for specific solar zenith angles, in order to minimize interferences from the different paths of radiation in the atmosphere. Specifically, averages of measurements corresponding to SZAs within±1◦about the nominal SZA were used. In order to eliminate remaining biases induced by these slightly different SZAs, correction factors were de-rived with the radiative transfer model UVSPEC, which is in-cluded in version 1.7 of the libRadtran package (Mayer and Kylling, 2005). The simulations were made for a range of TOC and AOD values within the expected range of variabil-ity over Thessaloniki: 250–550 DU for TOC and 0–1.4 for the AOD at 320 nm, using the US standard atmospheric pro-file (Anderson et al., 1986), the aerosol propro-file suggested by Shettle (1989), and typical values of the surface reflectivity, the single scattering albedo (SSA) and the asymmetry factor of 0.05, 0.85 and 0.7 respectively (Bais et al., 2005). The sim-ulations revealed that while for small SZAs and long wave-lengths the differences in clear-sky UV irradiance are small, at 305 nm the differences escalate to 60 % for a change in SZA from 69 to 71◦. The following empirical relationship
has been derived to correct the measured irradiance at SZAs different than the nominal:
I0
Iθ
=1+α(λ, θ0)·
1
cosθ− 1 cosθ0
, (1)
whereθ0is the nominal SZA,θ is the actual SZA,I0is the irradiance forθ0,Iθ is the irradiance for θ andα(λ,θ0)is
the correction factor which depends on wavelengthλandθ0. After applying the correction, the differences between irradi-ances for SZAs which differ by up to 2◦do not exceed 10 %
(±5 % about the mean) for wavelengths ranging from 290 to 400 nm and SZAs from 15 to 80◦. For the wavelengths
above 310 nm and SZAs smaller than 70◦the remaining
and wavelengths between 305 and 310 nm the remaining dis-crepancies range between 1 and 5 %. Thus for 307.5 nm, the remaining uncertainties due to differences from the nominal SZA range from 1 to 5 % for SZAs between 30 and 70◦. For
the same range of SZAs the corresponding uncertainties are lower than 2 and 1 % for 324 and 350 nm, respectively.
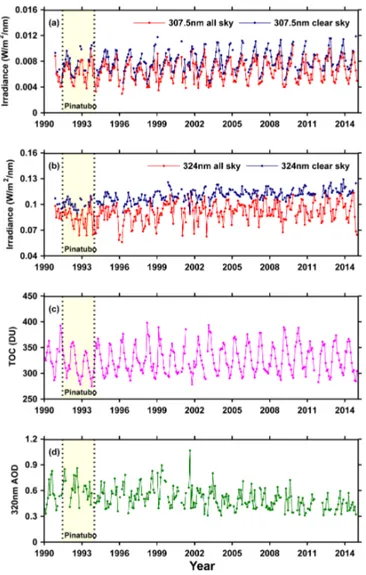
The monthly mean values of the irradiance at 307.5 nm and at 324 nm, the TOC, and the AOD derived from B005 since 1990 are presented in Fig. 1. The period from June 1991 until December 1993 has been shaded to highlight the low TOC values due to the Mt. Pinatubo volcanic erup-tion in June 1991 (Hofmann et al., 1994; Randel et al., 1995). The annual cycle of the irradiance at 307.5 nm is clearly anti-correlated with the annual cycle of TOC while for the irradi-ance at 324 nm the annual variability is mainly caused by changes in cloudiness. There is an indication of increasing tendency in irradiance, for both wavelengths since the begin-ning of the record, which will be further discussed in the fol-lowing sections. The monthly mean TOC generally ranges between about 280 and 400 DU with no obvious long-term trend. The high aerosol load over Thessaloniki is depicted in the monthly mean values of AOD that range between about 0.3 and 0.9. However, during the last two decades, the mean levels of the AOD are decreasing and its inter-annual vari-ability becomes weaker. As will be shown in the following, changes in aerosols play a key role in both the short- and the long-term variability of the UV irradiance over Thessaloniki.
3 Data analysis and results 3.1 Methodology
The present study has two main objectives: first, to quantify and discuss the long- and short-term changes in UV irradi-ance, and second, to investigate whether a turning point ex-ists in the long-term variability of the UV time series, during the period 1994–2014. Data before 1994 are not used in the analysis, to eliminate the effect on total ozone from the vol-canic eruption of Mt Pinatubo in June 1991. Large amounts of aerosols, mainly sulfuric, were injected into the strato-sphere which led to decreases in TOC in the period 1991– 1993, as can be seen from Fig. 1. In addition, measurements of spectral UV irradiance at Thessaloniki before June 1991 are sparse and available for less than 2 years.
Assuming that part of the long-term variability of the clear-sky UV irradiance is due to ozone, one would expect that there should be two modes in this trend: one for the pe-riod of decreasing total ozone and one for the pepe-riod of sta-bilized or increasing total ozone. For some Northern Hemi-sphere locations, it was found (Zerefos et al., 2012) that sur-face UV-B irradiance increases faster in the period before 2006. As shown in the following, such a turning point ex-ists also in the 20-year-long UV data series of Thessaloniki. Although quantitative estimates of the trends for each of the
Figure 1.Time series of monthly mean all-sky and clear-sky
irradi-ance at 63◦(±1◦) SZA for(a)307.5 nm and(b)324 nm. Monthly means derived from daily means are shown in (c)for TOC and (d)for AOD at 320 nm. Monthly means were calculated only for
months with at least 10 days of data.
two sub-periods have been derived they are discussed briefly and in a more qualitative way, since the two time periods are too short to consider the quantitative estimates of the trends reliable (Arola et al., 2003; Weatherhead et al., 1998). Thus, in the following analysis long-term trends are comprehen-sively discussed only for the entire period 1994–2014.
the all-sky or the clear-sky data sets. As discussed in Yang et al. (2006) removing the autocorrelation from time series with large number of gaps, as in our case for the clear-sky UV data set, can induce artificial tendencies and biases in the derived trends. In order to accurately detect the turning point in the trends of the UV irradiance and to determine its statis-tical significance, the methodology of Yang et al. (2006) was applied on the monthly mean anomalies. This study aimed at detecting a turning point in a time series of TOC with a large number of gaps using a non-autoregressive model. The addi-tional uncertainty due to the remaining autocorrelation was taken into account in the estimation of the statistical signifi-cance associated with the detection of the turning point.
For the analysis of long-term changes we calculated daily anomalies for TOC, AOD and spectral UV irradiance at dif-ferent SZAs in order to remove the effect of SZA in the an-nual variability of irradiance. These daily anomalies were calculated by subtracting from each data point the climato-logical value for that day which was derived from the entire data set. Monthly mean anomalies were calculated by aver-aging the daily anomalies for months with at least 10 days of available data. As a next step, the effects of QBO and the 11-year solar cycle were filtered from both the TOC and UV irradiance data sets, by applying a multilinear regression analysis. The procedure described in, for example, Zerefos et al. (2012) was followed with the only difference being that in the present study we did not use an autoregressive model, due to gaps in the clear-sky UV data set. It was found that the difference in the linear trends derived for the period 1994– 2014 with and without filtering the effects of these two nat-ural cycles is generally smaller than 0.5 % per decade, thus smaller than the 1σ uncertainty of the trends which ranges from about 1 to 3 % per decade. However, it is not always negligible compared to the magnitude of the derived trends which for all cases range between about −5 and 10 % per decade.
The number of gaps in the time series of the UV irradiance is higher in the first half compared to the second half of the period of study. In order to suppress the effect of the uneven distribution of the measurements, the long-term changes in UV irradiance were calculated from the yearly mean anoma-lies, instead of those derived from the multilinear model. Af-ter removing the effects of the solar cycle and the QBO from the monthly mean anomalies, the data set was recomposed and the yearly mean anomalies were calculated. It was found again that the difference in the linear trends derived from the yearly mean anomalies and directly from the multilinear model is small, with the former being higher by only 0.1– 0.4 % per decade. The statistical significance of the trends is derived from the Mann–Kendall test (Burkey, 2006). In the following, a trend is considered significant when it is statis-tically significant at the 95 % confidence level.
3.2 Comparison between the trends from the two Brewers for different SZAs
Following the re-evaluation and quality control of the entire data set, the trends of the UV irradiance were calculated sep-arately for the two Brewers operating at Thessaloniki. Mean ratios between quasi-synchronous (within±1 min) spectral UV irradiance measurements from B005 and B086 under all-sky conditions were calculated for different SZAs to evaluate the applied corrections. Instrumental characteristics of Brew-ers (e.g. the slit function) may differ for different instruments (e.g. Lakkala et al., 2008) leading to differences between, even synchronous, single-wavelength measurements. Com-paring averages over small spectral intervals partly suppress these effects. In the present study averages for 5 nm spec-tral intervals were compared instead of irradiance measure-ments at single wavelengths (or averages for narrower spec-tral intervals), because they are wide enough to suppress a great part of the effect of these characteristics, while at the same time they are narrow enough to assess whether mea-surements are properly corrected for, for example, the effects of temperature and SZA with respect to wavelength. For the wavelength range 310–325 nm the ratios are very close to 1 with a standard deviation of about 5 %. For shorter wave-lengths, the mean ratio gradually decreases and for the 300– 305 nm range it is∼0.96 with a standard deviation of about 10 %. As already discussed, the uncertainties and the devia-tions from unity arise from the different characteristics of the two instruments and from the imperfect synchronization of the measurements (Garane et al., 2006). No dependency of the ratio from the temperature or the solar zenith angle was found. The good agreement in the absolute levels of the mea-sured irradiance by the two instruments is an indication of the quality of the re-evaluated data. It should be noted, however, that the synchronous measurements represent only∼50 % of the available data. The trends from both instruments for the entire period 1994–2014 were compared for different solar zenith angles from 30 to 70◦in steps of 10◦. The results for
307.5 and 324 nm are presented in Fig. 2 both for clear-sky and all-sky conditions.
For 307.5 nm, statistically significant trends were found for clear-skies for both instruments and all SZAs, and for all-skies in B005 for 30 and 70◦ SZA. For 324 nm, only
the clear-sky trends from B005 and for 30 and 40◦SZA are
Figure 2.Linear trends (in % per decade) of spectral UV irradiance at 307.5 nm (left) and 324 nm (right) for clear-sky (upper) and all-sky
(lower) conditions derived from Brewers #086 and #005, as a function of solar zenith angle. The shaded areas represent the±1σ uncertainty
of the derived trends.
with SZA, which leads to stronger absorption from ozone or aerosols. However, for different SZAs, the data sets comprise data from different periods in the year (e.g. for SZA=30◦ data exist only from April to August, while for SZA=70◦ data are available during the entire year). Since the long-term changes of TOC, AOD and cloudiness are different for differ-ent seasons, the irradiance trends for differdiffer-ent SZAs should be affected differently by these factors.
3.3 Seasonal trends
Since the results from both instruments are generally simi-lar, only the data from B086 are used in the following, since this instrument has superior characteristics, at least with re-spect to the rejection of stray light and angular response. Sea-sonal trends of the spectral UV irradiance for 307.5, 324 and 350 nm (Fig. 3) were calculated and compared to the corre-sponding trends of the daily mean TOC and AOD (Fig. 4). The trends in AOD are statistically significant for all cases presented, in contrast to the trends in TOC which are not sta-tistically significant. For SZAs larger than 63◦data are
avail-able during the whole year – thus, the irradiance for 64◦SZA
(data ranging from 63 to 65◦) is used in the analysis of trends.
The effect of the changes in cloudiness is assessed by com-paring the trends of the clear-sky and the all-sky irradiance.
As expected, the seasonal trends for 324 and the 350 nm are similar for both, clear-sky and all-sky conditions. The changes of the solar irradiance at these wavelengths are prac-tically unaffected by the changes of TOC, while they are mainly affected by the changes in aerosols and clouds. In general, the effects of changes in aerosol amount and/or properties on UV irradiance are stronger for shorter wave-lengths. Thus, the important negative trends of the AOD at
Figure 3.Long-term changes (in % per decade) and associated 1σ
uncertainty of the seasonal and the yearly mean spectral irradiance for 307.5, 324 and 350 nm at 64◦SZA, for clear-skies(a)and all-skies(b)at Thessaloniki.
Figure 4.Long-term changes (in % per decade) and the associated
1σ uncertainty of the seasonal and the yearly mean of TOC (blue
rhombs) and the AOD at 320 nm (green rhombs). The left (blue) axis corresponds to the changes in TOC while the right (green) axis to changes in AOD.
of the aerosols (i.e. the SSA) for which no measurements are available for this period. For example, decreases in the SSA (greater absorption efficiency) counteract the effect of decreases in the AOD. As will be discussed later, the fact that the changes in clear-sky UV-A irradiance (324 and 350 nm) cannot be fully explained by the changes in the AOD is an in-dication that changes in other optical properties of aerosols, such as the SSA, may have occurred.
The greatest changes in irradiance at 324 and 350 nm were found in summer both for clear-sky and all-sky conditions. The trend for clear-skies at these wavelengths is about 3.5 % per decade, while for 307.5 nm it increases to about 5 % per decade. The main driver for the changes under clear-skies ap-pears to be the decreasing AOD, which for summer is more than 20 % per decade. For all-skies, the positive trends are almost double than those for clear-skies (about 7 % for 324 and 350 nm and about 9 % for 307.5 nm), suggesting that the attenuation of irradiance by clouds is decreasing during the last 2 decades. All these trends are statistically significant. For winter, the trends in irradiance for 324 and 350 nm are 3.5 and 3.0 % respectively both for clear-skies and all-skies, suggesting that cloud effects during the last two decades are very small in winter and changes in aerosols are the dominant factor. This conclusion is confirmed by the negative trend of the AOD shown in Fig. 4. For 307.5 nm the increases in TOC counteract the effects of changing aerosols, leading to a neg-ative trend of about −3 % per decade for irradiance under clear-skies. However, none of the trends in winter is statisti-cally significant.
For spring, the trends for clear-skies are similar to those in summer for all three wavelengths, while for all-skies trends are smaller; by 0.5–1 %. Thus, as for winter, the UV trends are due mainly to decreasing AOD. Although for that sea-son the trend in TOC is about 1 % per decade, this is not re-flected in the trend of clear-sky irradiance at 307.5 nm which is slightly larger than in the UV-A wavelengths, instead of being smaller. For this season only the trend for 350 nm is statistically significant.
For autumn, the trends in clear-sky irradiance are approx-imately 7, 3 and 1.5 % for 307.5, 324 and 350 nm respec-tively, and statistically significant only for the first two wave-lengths. For all-skies, the trends are 3–4 % lower, suggesting an increasing attenuation by clouds during this season. How-ever, the differences between the clear-sky and the all-sky trends are within the uncertainty limits of the latter. The all-sky trends for autumn are not statistically significant. One of the possible reasons for the stronger increase of the irradi-ance at 307.5 nm compared to 324 and 350 nm is the small negative trend in TOC. Additionally, the relatively large dif-ference between the trends for 324 and 350 nm is explained by the decreasing aerosols which have much stronger impact on shorter than on longer wavelengths.
Finally, the yearly averaged TOC is slightly increasing, by about 0.8 % per decade, but this change is not statistically significant. In contrast, the yearly mean AOD has been de-creasing by about 17 % per decade, and therefore AOD is the dominant driver of the changes in the yearly mean UV irra-diance. The trends in UV irradiance range from 3 to 4 % for clear-skies, while for all-skies they are about 0.5 % larger. At shorter wavelengths the trends are larger, possibly due to the negative trend in TOC and the stronger effect of aerosols on the irradiance at these wavelengths.
The results presented in Fig. 3 lead to the conclusion that the enhanced attenuation of UV radiation by clouds in sum-mer is balanced by the decreased attenuation in autumn, lead-ing to a negligible effect on the yearly mean UV irradiance. However, as in all cases presented, the differences between the trends in clear-sky and all-sky irradiance for summer and autumn are similar to (or even lower than) their 1σ uncer-tainty, which is a strong indication that the estimated changes in the attenuation of the UV irradiance by clouds are not sig-nificant.
3.4 The role of ozone and aerosols on short- and long-term variability of irradiance
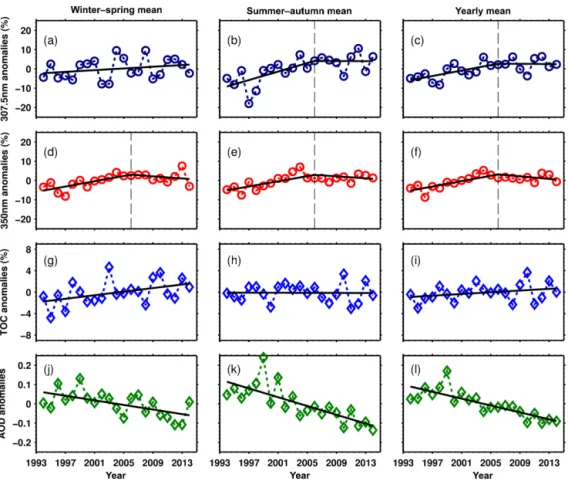
In the following we discuss in more detail the short- and long-term variability of clear-sky UV irradiance at 307.5 and 350 nm in association with the evolution of factors causing this variability. The analysis of the variability is performed on annual mean anomalies of UV irradiance at 64◦ SZA,
TOC and AOD, as well as for mean anomalies for the pe-riods December–May (winter–spring) and June–November (summer–autumn); the former being affected mainly by changes in ozone, and the latter by changes in aerosols. Furthermore, we explore a potential turning point in the time series of irradiance at Thessaloniki using monthly mean anomalies, in an attempt to confirm the findings of Zerefos et al. (2012).
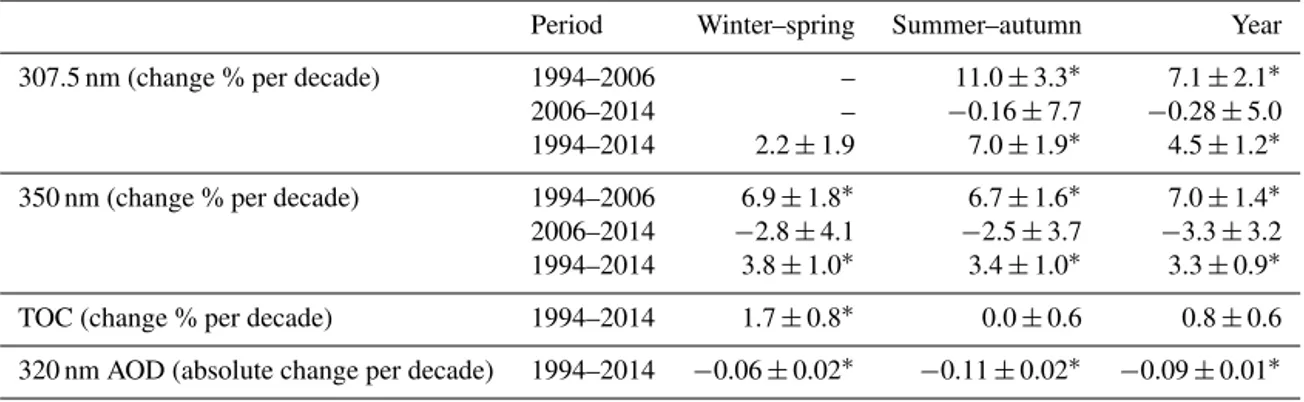
Table 1. Trends of TOC, AOD at 320 nm and spectral UV irradiance at 307.5 and 350 nm, for different periods. Asterisks denote the statistically significant trends.
Period Winter–spring Summer–autumn Year
307.5 nm (change % per decade) 1994–2006 – 11.0±3.3∗ 7.1±2.1∗
2006–2014 – −0.16±7.7 −0.28±5.0
1994–2014 2.2±1.9 7.0±1.9∗ 4.5±1.2∗
350 nm (change % per decade) 1994–2006 6.9±1.8∗ 6.7±1.6∗ 7.0±1.4∗ 2006–2014 −2.8±4.1 −2.5±3.7 −3.3±3.2 1994–2014 3.8±1.0∗ 3.4±1.0∗ 3.3±0.9∗
TOC (change % per decade) 1994–2014 1.7±0.8∗ 0.0±0.6 0.8±0.6
320 nm AOD (absolute change per decade) 1994–2014 −0.06±0.02∗ −0.11±0.02∗ −0.09±0.01∗
statistically significant at the 95 % confidence level. Since the same pattern occurs at both wavelengths and since no statis-tically significant turning point has been detected for TOC, this piece-wise trend pattern in UV irradiance has likely been caused by changes in aerosols. However, the small negative trend in UV irradiance observed after 2006 (see Table 1 and Fig. 5) does not comply with the negative monotonic trend in AOD during the whole period of study which continues also after 2006. The behaviour of aerosols after 2006 has been verified by an independent data set from a collocated Cimel sun-photometer, which revealed a decreasing trend of about 0.1 per decade in AOD at 440 nm from 2006 to 2014, simi-lar to that of B005. Thus, the only factor that could explain the small negative trend in UV irradiance during this period would be a negative trend in the SSA (Bais et al., 2005; Niki-tidou et al., 2013). This assumption cannot be easily verified since the SSA data from the Cimel and from satellite over-passes (e.g. http://disc.sci.gsfc.nasa.gov/giovanni) are sparse and inadequate to derive reliable trends. However, simula-tions with UVSPEC revealed that for SZAs greater than 60◦
and for typical aerosol properties and atmospheric conditions for Thessaloniki, the effect of a decrease in AOD at 320 nm by 0.1 can be reversed by a simultaneous decrease in SSA by less than 0.1.
As shown in Table 1, the trends for 350 nm for winter– spring, summer–autumn and the entire year are similar. For all the three cases the UV irradiance increases by about 10 % from 1994 to 2006 and then it slightly decreases from 2006 to 2014 resulting to a mean rate of increase of about 3.5 % per decade for the entire period 1994–2014. For the three cases the mean rate of decrease for the AOD is similar before and after 2006. Additionally, the year-to-year variability of the mean anomalies for the AOD is not clearly anti-correlated with the year-to-year variability of the mean anomalies for the UV irradiance at 350 nm, which can be only attributed to changes in SSA. SSA may differ importantly for different types of aerosols (Takemura et al., 2002). The aerosol mix-ture over Thessaloniki consists of several different types of aerosols (e.g. urban, continental, marine, dust) and its
com-position varies (Amiridis et al., 2005; Koukouli et al., 2006). This could lead to large variability of the SSA, even within the same day (e.g. Ialongo et al., 2010). An increase of the mean SSA in 1999 would, for example, explain why the very high annual mean levels of AOD in the specific year are not depicted in the levels of UV irradiance.
The changes of the UV irradiance at 307.5 nm are highly affected by changes in TOC and aerosols. For the winter– spring period no statistically significant turning point has been detected in the trend for this wavelength. Addition-ally, the mean trend in irradiance for the period 1994–2014 is weak (Table 1) compared to the corresponding trend for the period June–November, and is likely caused by the com-bined, but opposing, effects of a statistically significant pos-itive trend in TOC and a negative trend in AOD. For the pe-riod June–November no trend was detected in TOC, thus, as for 350 nm, the UV irradiance at 307.5 nm increases steadily from 1994 to 2006 due to decreasing AOD and after 2006 remains unchanged. A pattern which is similar to that for the period June–November appears also in the annual means, with changes in irradiance dominated again by changes in aerosols of opposite sign.
Figure 5.Yearly mean anomalies and corresponding trends for clear-sky irradiance at 307.5 nm(a, b, c)and 350 nm(d, e, f), TOC(g, h, i)and AOD at 320 nm(j, k, l)for December–May (left panels), June–November (middle panels) and for the entire year (right panels). A
piece-wise trend consisting of two linear trends has been drawn when a statistically significant turning point has been detected; otherwise a linear trend for the entire period has been drawn.
307.5 nm in 2010 is still higher than mean levels in the period 1994–1998, mainly due to the very high levels of aerosols in the atmosphere in the mid-1990s. As the AOD decreases throughout the years, the anti-correlation between the short-term variability of the TOC and the UV irradiance becomes clearer. Finally, it is noteworthy that while the mean value of AOD for 2014 in the period summer–autumn is the lowest recorded since 1994, the corresponding value for the period winter–spring is the highest of the last 7 years. These very high AOD values are probably due to the increased biomass-burning aerosols arising from a shift in the type of fuel ow-ing to the economic crisis in Greece after 2009 (Saffari et al., 2013). As a consequence of the increased aerosols, the levels of irradiance at 350 nm for winter–spring 2014 are the lowest recorded during the last decade.
Since this section aimed at attributing the short- and long-term variability of the UV irradiance to the corresponding variability of TOC and AOD, the analysis was restricted to clear-sky data. Although not shown here, a similar analy-sis has been performed for the irradiance under all-sky con-ditions and a statistically significant turning point in 2006 has also been detected in the trends of yearly mean
irradi-ance for 307.5 and 350 nm. As already discussed, changes in cloudiness do not have an important impact on the long-term changes of the UV irradiance at Thessaloniki but are the main driver of the short-term variations in the all-sky data set.
4 Summary and conclusions
be-tween the trends from the two instruments was found to be smaller than their 1σ uncertainty boundaries.
According to the results, the annual mean UV irradiance has increased during the last two decades. The increasing trends are similar for both clear-sky and all-sky data and are higher at shorter wavelengths and higher SZAs. The calcu-lated trends range between 2 and 6 % per decade, and for clear-skies are statistically significant for most SZAs. For all-skies, most of the irradiance trends are not statistically significant.
The impact of changes in TOC, aerosols and clouds on the changes in UV irradiance is different for different seasons. The negative trends in AOD, which are stronger in summer, lead to positive trends in UV irradiance at longer wavelengths (e.g. at 324 and 350 nm). For shorter wavelengths changes in TOC are also important. Thus, the effect of the small negative trend in AOD in winter is fully counteracted by the positive trend in TOC, resulting in a decreasing trend in clear-sky ir-radiance at 307.5 nm. Changes in clouds have a negligible effect on the trend of irradiance for winter and spring. The enhancement of the attenuation of irradiance by clouds in au-tumn is balanced by the reduced attenuation in summer, lead-ing to similar changes in the annual means of clear-sky and all-sky irradiance. It is important to notice that the strongest changes in UV irradiance were found for summer when hu-mans are more exposed to the Sun compared to the other seasons.
Moreover, it is shown that the period 1994–2014 can be divided in two sub-periods: during the first period (1994–2006) the annual mean UV irradiance is increasing fast while during the second period (2006–2014) the UV irradiance is relatively stable at 307.5 nm and is slightly decreasing at 350 nm. The long-term variability of UV irradiance for both short and long wavelengths is mainly driven by the changes in aerosols. The short-term variability of the clear-sky irradiance at 307.5 nm is mainly driven by the short-term variability of TOC. The effect of the TOC changes on the year-to-year variability of UV irradiance becomes clearer when AOD decreases. The short-term changes in irradiance at 350 nm cannot be fully explained by the short-term changes in AOD, as the absorption efficiency of aerosols may also change with time.
Edited by: S. Kazadzis
References
Amiridis, V., Balis, D. S., Kazadzis, S., Bais, A., Giannakaki, E., Papayannis, A., and Zerefos, C.: Four-year aerosol ob-servations with a Raman lidar at Thessaloniki, Greece, in the framework of European Aerosol Research Lidar Net-work (EARLINET), J. Geophys. Res.-Atmos., 110, D21203, doi:10.1029/2005jd006190, 2005.
Anderson, G. P., Clough, S., Kneizys, F., Chetwynd, J., and Shettle, E. P.: AFGL atmospheric constituent profiles (0–120 km), Tech. Rep. TR-86-0110, AFGL, DTIC Document, 1986.
Antón, M., Serrano, A., Cancillo, M. L., GarcÍA, J. A., and Madronich, S.: Application of an analytical formula for UV In-dex reconstructions for two locations in Southwestern Spain, Tel-lus B, 63, 1052–1058, 2011.
Arola, A., Lakkala, K., Bais, A., Kaurola, J., Meleti, C., and Taalas, P.: Factors affecting short- and long-term changes of spectral UV irradiance at two European stations, J. Geophys. Res.-Atmos., 108, 4549, doi:10.1029/2003jd003447, 2003.
Asta, J., Pål, B., Arne, D., Stefan, A.-E., Jörg, R., Kristin, M., Michael, F. H., William, B. G., and Johan, M.: Solar radiation and human health, Rep. Prog. Phys., 74, 066701, doi:10.1088/0034-4885/74/6/066701, 2011.
Bais, A. F., Zerefos, C. S., Ziomas, I. C., Zoumakis, N., Mantis, H. T., Hofmann, D. J., and Fiocco, G.: Decreases in the Ozone and the SO2Columns Following the Appearence of the El Chichon Aerosol Cloud at Midlatitude, in: Atmospheric Ozone, edited by: Zerefos, C. S. and Ghazi, A., Springer Netherlands, 1985. Bais, A. F., Zerefos, C. S., Meleti, C., Ziomas, I. C., and Tourpali,
K.: Spectral measurements of solar UVB radiation and its rela-tions to total ozone, SO2, and clouds, J. Geophys. Res.-Atmos., 98, 5199–5204, 1993.
Bais, A. F., Zerefos, C. S., and McElroy, C. T.: Solar UVB measure-ments with the double- and single-monochromator Brewer ozone spectrophotometers, Geophys. Res. Lett., 23, 833–836, 1996. Bais, A. F., Gardiner, B. G., Slaper, H., Blumthaler, M., Bernhard,
G., McKenzie, R., Webb, A. R., Seckmeyer, G., Kjeldstad, B., Koskela, T., Kirsch, P. J., Gröbner, J., Kerr, J. B., Kazadzis, S., Leszczynski, K., Wardle, D., Josefsson, W., Brogniez, C., Gillotay, D., Reinen, H., Weihs, P., Svenoe, T., Eriksen, P., Kuik, F., and Redondas, A.: SUSPEN intercomparison of ultravio-let spectroradiometers, J. Geophys. Res.-Atmos., 106, 12509– 12525, 2001.
Bais, A. F., Kazantzidis, A., Kazadzis, S., Balis, D. S., Zerefos, C. S., and Meleti, C.: Deriving an effective aerosol single scatter-ing albedo from spectral surface UV irradiance measurements, Atmos. Environ., 39, 1093–1102, 2005.
Bais, A. F., Tourpali, K., Kazantzidis, A., Akiyoshi, H., Bekki, S., Braesicke, P., Chipperfield, M. P., Dameris, M., Eyring, V., Garny, H., Iachetti, D., Jöckel, P., Kubin, A., Langematz, U., Mancini, E., Michou, M., Morgenstern, O., Nakamura, T., New-man, P. A., Pitari, G., Plummer, D. A., Rozanov, E., Shepherd, T. G., Shibata, K., Tian, W., and Yamashita, Y.: Projections of UV radiation changes in the 21st century: impact of ozone re-covery and cloud effects, Atmos. Chem. Phys., 11, 7533–7545, doi:10.5194/acp-11-7533-2011, 2011.
Bais, A. F., Drosoglou, T., Meleti, C., Tourpali, K., and Kouremeti, N.: Changes in surface shortwave solar irradiance from 1993 to 2011 at Thessaloniki (Greece), Int. J. Climatol., 33, 2871–2876, 2013.
Bais, A. F., McKenzie, R. L., Bernhard, G., Aucamp, P. J., Ilyas, M., Madronich, S., and Tourpali, K.: Ozone depletion and climate change: impacts on UV radiation, Photochem. Photobio. S., 14, 19–52, doi:10.1039/c4pp90032d, 2015.
ecosystems. Patterns, mechanisms, and interactions with climate change, Photochem. Photobio. S., 10, 226–241, 2011.
Bernhard, G.: Trends of solar ultraviolet irradiance at Bar-row, Alaska, and the effect of measurement uncertainties on trend detection, Atmos. Chem. Phys., 11, 13029–13045, doi:10.5194/acp-11-13029-2011, 2011.
Bernhard, G., Booth, C. R., Ehramjian, J. C., Stone, R., and Dutton, E. G.: Ultraviolet and visible radiation at Barrow, Alaska: Clima-tology and influencing factors on the basis of version 2 National Science Foundation network data, J. Geophys. Res.-Atmos., 112, D09101, doi:10.1029/2006jd007865, 2007.
Brewer, A. W.: A replacement for the Dobson spectrophotometer?, PAGEOPH, 106–108, 919–927, 1973.
Burkey, J.: A non-parametric monotonic trend test computing Mann-Kendall Tau, Tau-b, and Sens Slope written in Mathworks-MATLAB implemented using matrix rotations, King County, Department of Natural Resources and Parks, Science and Tech-nical Services section, Seattle, Washington, USA, 2006. Cordero, R. R., Seckmeyer, G., Damiani, A., Labbe, F., and Laroze,
D.: Monte Carlo-based uncertainties of surface UV estimates from models and from spectroradiometers, Metrologia, 50, L1– L5, doi:10.1088/0026-1394/50/5/L1, 2013.
Damiani, A., Cordero, R. R., Cabrera, S., Laurenza, M., and Rafanelli, C.: Cloud cover and UV index estimates in Chile from satellite-derived and ground-based data, Atmos. Res., 138, 139– 151, 2014.
De Bock, V., De Backer, H., Van Malderen, R., Mangold, A., and Delcloo, A.: Relations between erythemal UV dose, global solar radiation, total ozone column and aerosol optical depth at Uccle, Belgium, Atmos. Chem. Phys., 14, 12251–12270, doi:10.5194/acp-14-12251-2014, 2014.
Egorova, T., Rozanov, E., Gröbner, J., Hauser, M., and Schmutz, W.: Montreal Protocol Benefits simulated with CCM SOCOL, Atmos. Chem. Phys., 13, 3811–3823, doi:10.5194/acp-13-3811-2013, 2013.
Eleftheratos, K., Kazadzis, S., Zerefos, C. S., Tourpali, K., Meleti, C., Balis, D., Zyrichidou, I., Lakkala, K., Feister, U., Koskela, T., Heikkilä, A., and Karhu, J. M.: Ozone and Spectroradiometric UV Changes in the Past 20 Years over High Latitudes, Atmos. Ocean, 53, 117–125, doi:10.1080/07055900.2014.919897, 2014. Farman, J. C., Gardiner, B. G., and Shanklin, J. D.: Large losses of total ozone in Antarctica reveal seasonal ClOx/NOxinteraction, Nature, 315, 207–210, 1985.
Fioletov, V. E., Kerr, J. B., Hare, E. W., Labow, G. J., and McPeters, R. D.: An assessment of the world ground-based total ozone net-work performance from the comparison with satellite data, J. Geophys. Res.-Atmos., 104, 1737–1747, 1999.
Fioletov, V. E., Kimlin, M. G., Krotkov, N., McArthur, L. J. B., Kerr, J. B., Wardle, D. I., Herman, J. R., Meltzer, R., Mathews, T. W., and Kaurola, J.: UV index climatology over the United States and Canada from ground-based and satellite estimates, J. Geophys. Res.-Atmos., 109, D22308, doi:10.1029/2004jd004820, 2004. Fitzka, M., Simic, S., and Hadzimustafic, J.: Trends in spectral
UV radiation from long-term measurements at Hoher Sonnblick, Austria, Theor. Appl. Climatol., 110, 585–593, 2012.
Fragkos, K., Bais, A. F., Fountoulakis, I., Balis, D., Tourpali, K., Meleti, C., and Zanis, P.: Extreme total column ozone events and effects on UV solar radiation at Thessaloniki, Greece, Theor. Appl. Climatol., 1–13, doi:10.1007/s00704-015-1562-3, 2015.
Garane, K., Bais, A. F., Kazadzis, S., Kazantzidis, A., and Meleti, C.: Monitoring of UV spectral irradiance at Thessaloniki (1990– 2005): data re-evaluation and quality control, Ann. Geophys., 24, 3215–3228, 2006.
García, R. D., Cachorro, V. E., Cuevas, E., Toledano, C., Redondas, A., Blumthaler, M., and Benounna, Y.: Comparison of measured and modelled spectral UV irradiance at Izaña high mountain sta-tion: estimation of the underlying effective albedo, Int. J. Clima-tol., 36, 377–388, doi:10.1002/joc.4355, 2015.
Glandorf, M., Arola, A., Bais, A., and Seckmeyer, G.: Possibilities to detect trends in spectral UV irradiance, Theor. Appl. Climatol., 81, 33–44, 2005.
Gröbner, J., Blumthaler, M., Kazadzis, S., Bais, A., Webb, A., Schreder, J., Seckmeyer, G., and Rembges, D.: Quality assurance of spectral solar UV measurements: results from 25 UV moni-toring sites in Europe, 2002 to 2004, Metrologia, 43, S66–S71, doi:10.1088/0026-1394/43/2/S14, 2006.
Gröbner, J. and Meleti, C.: Aerosol optical depth in the UVB and visible wavelength range from Brewer spectrophotometer direct irradiance measurements: 1991–2002, J. Geophys. Res.-Atmos., 109, D09202, doi:10.1029/2003jd004409, 2004.
Häder, D. P., Helbling, E. W., Williamson, C. E., and Worrest, R. C.: Effects of UV radiation on aquatic ecosystems and interac-tions with climate change, Photochem. Photobio. S., 10, 242– 260, 2011.
Häder, D.-P., Williamson, C. E., Wangberg, S.-A., Rautio, M., Rose, K. C., Gao, K., Helbling, E. W., Sinha, R. P., and Worrest, R.: Effects of UV radiation on aquatic ecosystems and interactions with other environmental factors, Photochem. Photobio. S., 14, 108–126, doi:10.1039/c4pp90035a, 2015.
Hegglin, M. I. and Shepherd, T. G.: Large climate-induced changes in ultraviolet index and stratosphere-to-troposphere ozone flux, Nat. Geosci., 2, 687–691, 2009.
Hofmann, D. J., Oltmans, S. J., Komhyr, W. D., Harris, J. M., Lath-rop, J. A., Langford, A. O., Deshler, T., Johnson, B. J., Torres, A., and Matthews, W. A.: ozone loss in the lower stratosphere over the United States in 1992–1993: Evidence for heteroge-neous chemistry on the Pinatubo aerosol, Geophys. Res. Lett., 21, 65–68, 1994.
Ialongo, I., Buchard, V., Brogniez, C., Casale, G. R., and Siani, A. M.: Aerosol Single Scattering Albedo retrieval in the UV range: an application to OMI satellite validation, Atmos. Chem. Phys., 10, 331–340, doi:10.5194/acp-10-331-2010, 2010.
IPCC: Climate Change 2013: The Physical Science Basis. Contri-bution of Working Group I to the Fifth Assessment Report of the Intergovernmental Panel on Climate Change Cambridge Uni-versity Press, Cambridge, United Kingdom and New York, NY, USA, 1535 pp., 2013.
Karppinen, T., Redondas, A., García, R. D., Lakkala, K., McElroy, C. T., and Kyrö, E.: Compensating for the Ef-fects of Stray Light in Single-Monochromator Brewer Spec-trophotometer Ozone Retrieval, Atmos. Ocean, 53, 66–73, doi:10.1080/07055900.2013.871499, 2014.
Kazadzis, S., Bais, A., Arola, A., Krotkov, N., Kouremeti, N., and Meleti, C.: Ozone Monitoring Instrument spectral UV irra-diance products: comparison with ground based measurements at an urban environment, Atmos. Chem. Phys., 9, 585–594, doi:10.5194/acp-9-585-2009, 2009.
Kazantzidis, A., Bais, A., Garane, K., Kazadzis, S., and Meleti, C.: Estimation of UV irradiance from ancillary data and compari-son with measurements at Thessaloniki, Greece (40.5◦N, 23◦E), 6362, 636228, doi:10.1117/12.689813, 2006.
Kazantzidis, A., Bais, A. F., Zempila, M. M., Kazadzis, S., den Outer, P. N., Koskela, T., and Slaper, H.: Calculations of the hu-man vitamin D exposure from UV spectral measurements at three European stations, Photochem. Photobio. S., 8, 45–51, 2009. Kazantzidis, A., Smedley, A., Kift, R., Rimmer, J., Berry, J.,
Rhodes, L. E., and Webb, A.: A modeling approach to determine how much UV radiation is available across the UK and Ireland for health risk and benefit studies, Photochem. Photobio. S., 14, 1073–1081, doi:10.1039/c5pp00008d, 2015.
Kerr, J. B. and Fioletov, V. E.: Surface ultraviolet radiation, Atmos. Ocean, 46, 159–184, 2008.
Kerr, J. B. and McElroy, C. T.: Evidence for Large Upward Trends of Ultraviolet-B Radiation Linked to Ozone Depletion, Science, 262, 1032–1034, 1993.
Kerr, J. B., McElroy, C. T., and Olafson, R. A.: Measurements of ozone with the Brewer spectrophotometer, Quadrennial Interna-tional Ozone Symposium, Natl. Cent. for Atmos. Res., Boulder, Colorado, 74–79, 1981.
Kerr, J. B., Evans, W. F. J., and Asbridge, I. A.: Recalibration of Dobson Field Spectrophotometers with a Travelling Brewer Spectrophotometer Standard, in: Atmospheric Ozone, edited by: Zerefos, C. S. and Ghazi, A., Springer Netherlands, 1985. Koukouli, M. E., Balis, D. S., Amiridis, V., Kazadzis, S., Bais, A.,
Nickovic, S., and Torres, O.: Aerosol variability over Thessa-loniki using ground based remote sensing observations and the TOMS aerosol index, Atmos. Environ., 40, 5367–5378, 2006. Kreuter, A., Buras, R., Mayer, B., Webb, A., Kift, R., Bais, A.,
Kouremeti, N., and Blumthaler, M.: Solar irradiance in the het-erogeneous albedo environment of the Arctic coast: measure-ments and a 3-D model study, Atmos. Chem. Phys., 14, 5989– 6002, doi:10.5194/acp-14-5989-2014, 2014.
Kuttippurath, J., Lefèvre, F., Pommereau, J.-P., Roscoe, H. K., Goutail, F., Pazmiño, A., and Shanklin, J. D.: Antarctic ozone loss in 1979–2010: first sign of ozone recovery, Atmos. Chem. Phys., 13, 1625–1635, doi:10.5194/acp-13-1625-2013, 2013. Lakkala, K., Arola, A., Heikkilä, A., Kaurola, J., Koskela, T., Kyrö,
E., Lindfors, A., Meinander, O., Tanskanen, A., Gröbner, J., and Hülsen, G.: Quality assurance of the Brewer spectral UV measurements in Finland, Atmos. Chem. Phys., 8, 3369–3383, doi:10.5194/acp-8-3369-2008, 2008.
Li, Z., Wang, P., and Cihlar, J.: A simple and efficient method for retrieving surface UV radiation dose rate from satellite, J. Geo-phys. Res.-Atmos., 105, 5027–5036, 2000.
Lucas, R. M., Norval, M., Neale, R. E., Young, A. R., de Gruijl, F. R., Takizawa, Y., and van der Leun, J. C.: The consequences for human health of stratospheric ozone depletion in association with other environmental factors, Photochem. Photobio. S., 14, 53–87, doi:10.1039/c4pp90033b, 2015.
Mäder, J. A., Staehelin, J., Peter, T., Brunner, D., Rieder, H. E., and Stahel, W. A.: Evidence for the effectiveness of the
Mon-treal Protocol to protect the ozone layer, Atmos. Chem. Phys., 10, 12161–12171, doi:10.5194/acp-10-12161-2010, 2010. Madronich, S., McKenzie, R. L., and Caldwell, M. M.: Changes
in ultraviolet radiation reaching the earth’s surface, Ambio, 24, 143–152, 1995.
Madronich, S., McKenzie, R. L., Björn, L. O., and Caldwell, M. M.: Changes in biologically active ultraviolet radiation reaching the Earth’s surface, J. Photochem. Photobiol. B, 46, 5–19, 1998. Madronich, S., Shao, M., Wilson, S. R., Solomon, K. R.,
Longstreth, J. D., and Tang, X. Y.: Changes in air quality and tropospheric composition due to depletion of stratospheric ozone and interactions with changing climate: implications for human and environmental health, Photochem. Photobio. S., 14, 149– 169, doi:10.1039/c4pp90037e, 2015.
Mayer, B. and Kylling, A.: Technical note: The libRadtran soft-ware package for radiative transfer calculations – description and examples of use, Atmos. Chem. Phys., 5, 1855–1877, doi:10.5194/acp-5-1855-2005, 2005.
McLinden, C. A. and Fioletov, V.: Quantifying stratospheric ozone trends: Complications due to stratospheric cooling, Geophys. Res. Lett., 38, L03808, doi:10.1029/2010GL046012, 2011. Meinander, O., Wuttke, S., Seckmeyer, G., Kazadzis, S., Lindfors,
A., and Kyrö, E.: Solar zenith angle asymmetry cases in polar snow UV albedo, Geophysica, 45, 183–198, 2009.
Meleti, C. and Cappellani, F.: Measurements of aerosol optical depth at Ispra: Analysis of the correlation with UV-B, UV-A, and total solar irradiance, J. Geophys. Res.-Atmos., 105, 4971–4978, 2000.
Meleti, C., Bais, A. F., Kazadzis, S., Kouremeti, N., Garane, K., and Zerefos, C.: Factors affecting solar ultraviolet irradiance mea-sured since 1990 at Thessaloniki, Greece, Int. J. Remote Sens., 30, 4167–4179, 2009.
Meleti, C., Fragkos, K., Bais, A. F., Tourpali, K., Balis, D., and Zerefos, C. S.: Thirty years of total ozone measurements at Thes-saloniki with a MKII Brewer spectrophotometer, Quadrennial Ozone Symposium 2012, Toronto, 2012.
Morgenstern, O., Braesicke, P., Hurwitz, M. M., O’Connor, F. M., Bushell, A. C., Johnson, C. E., and Pyle, J. A.: The World Avoided by the Montreal Protocol, Geophys. Res. Lett., 35, L16811, doi:10.1029/2008gl034590, 2008.
Newchurch, M. J., Yang, E.-S., Cunnold, D. M., Reinsel, G. C., Zawodny, J. M., and Russell, J. M.: Evidence for slowdown in stratospheric ozone loss: First stage of ozone recovery, J. Geo-phys. Res.-Atmos., 108, 4507, doi:10.1029/2003jd003471, 2003. Newman, P. A. and McKenzie, R.: UV impacts avoided by the Mon-treal Protocol, Photochem. Photobio. S., 10, 1152–1160, 2011. Nikitidou, E., Kazantzidis, A., De Bock, V., and De Backer, H.: The
aerosol forcing efficiency in the UV region and the estimation of single scattering albedo at a typical West European site, Atmos. Environ., 69, 313–320, 2013.
Randel, W. J., Wu, F., Russell, J. M., Waters, J. W., and Froidevaux, L.: Ozone and temperature changes in the stratosphere following the eruption of Mount Pinatubo, J. Geophys. Res.-Atmos., 100, 16753–16764, 1995.
Saffari, A., Daher, N., Samara, C., Voutsa, D., Kouras, A., Manoli, E., Karagkiozidou, O., Vlachokostas, C., Moussiopoulos, N., Shafer, M. M., Schauer, J. J., and Sioutas, C.: Increased Biomass Burning Due to the Economic Crisis in Greece and Its Adverse Impact on Wintertime Air Quality in Thessaloniki, Environ. Sci. Technol., 47, 13313–13320, 2013.
Schwander, H., Koepke, P., and Ruggaber, A.: Uncertainties in mod-eled UV irradiances due to limited accuracy and availability of input data, J. Geophys. Res.-Atmos., 102, 9419–9429, 1997. Shettle, E. P.: Models of aerosols, clouds and precipitation for
atmo-spheric propagation studies, in: AGARD, Atmoatmo-spheric Propaga-tion in the UV, Visible, IR, and MM-Wave Region and Related Systems Aspects 14 pp., 1989.
Smedley, A. R. D., Rimmer, J. S., Moore, D., Toumi, R., and Webb, A. R.: Total ozone and surface UV trends in the United Kingdom: 1979–2008, Int. J. Climatol., 32, 338–346, 2012.
Solomon, S., Garcia, R. R., Rowland, F. S., and Wuebbles, D. J.: On the depletion of Antarctic ozone, Nature, 321, 755–758, 1986. Steinbrecht, W., Köhler, U., Claude, H., Weber, M., Burrows, J.
P., and van der A, R. J.: Very high ozone columns at north-ern mid-latitudes in 2010, Geophys. Res. Lett., 38, 1944–8007, doi:10.1029/2010GL046634, 2011.
Takemura, T., Nakajima, T., Dubovik, O., Holben, B. N., and Kinne, S.: Single-Scattering Albedo and Radiative Forcing of Various Aerosol Species with a Global Three-Dimensional Model, J. Cli-mate, 15, 333–352, 2002.
Tourpali, K., Bais, A. F., Kazantzidis, A., Zerefos, C. S., Akiyoshi, H., Austin, J., Brühl, C., Butchart, N., Chipperfield, M. P., Dameris, M., Deushi, M., Eyring, V., Giorgetta, M. A., Kinnison, D. E., Mancini, E., Marsh, D. R., Nagashima, T., Pitari, G., Plum-mer, D. A., Rozanov, E., Shibata, K., and Tian, W.: Clear sky UV simulations for the 21st century based on ozone and tempera-ture projections from Chemistry-Climate Models, Atmos. Chem. Phys., 9, 1165–1172, doi:10.5194/acp-9-1165-2009, 2009. Turnock, S. T., Spracklen, D. V., Carslaw, K. S., Mann, G. W.,
Woodhouse, M. T., Forster, P. M., Haywood, J., Johnson, C. E., Dalvi, M., Bellouin, N., and Sanchez-Lorenzo, A.: Modelled and observed changes in aerosols and surface solar radiation over Eu-rope between 1960 and 2009, Atmos. Chem. Phys., 15, 9477– 9500, doi:10.5194/acp-15-9477-2015, 2015.
UNEP: Environmental effects of ozone depletion and its interaction with climate change: 2010 assessment, report, 278 pp., Nairobi, Kenya, 2010.
van Dijk, A., Slaper, H., den Outer, P. N., Morgenstern, O., Braesicke, P., Pyle, J. A., Garny, H., Stenke, A., Dameris, M., Kazantzidis, A., Tourpali, K., and Bais, A. F.: Skin Cancer Risks Avoided by the Montreal Protocol – Worldwide Modeling Inte-grating Coupled Climate-Chemistry Models with a Risk Model for UV, Photochem. Photobiol., 89, 234–246, 2013.
Walker, D.: Cloud effects on erythemal UV radiation in a complex topography, Diss., Eidgenössische Technische Hochschule ETH Zürich, No. 18415, doi:10.3929/ethz-a-005914035, 2009. Watanabe, S., Sudo, K., Nagashima, T., Takemura, T., Kawase,
H., and Nozawa, T.: Future projections of surface UV-B in a changing climate, J. Geophys. Res.-Atmos., 116, D16118, doi:10.1029/2011jd015749, 2011.
Weatherhead, E. C., Reinsel, G. C., Tiao, G. C., Meng, X.-L., Choi, D., Cheang, W.-K., Keller, T., DeLuisi, J., Wuebbles, D. J., Kerr, J. B., Miller, A. J., Oltmans, S. J., and Frederick, J. E.: Factors af-fecting the detection of trends: Statistical considerations and ap-plications to environmental data, J. Geophys. Res.-Atmos., 103, 17149–17161, 1998.
Webb, A. R., Kift, R., Durkin, M. T., O’Brien, S. J., Vail, A., Berry, J. L., and Rhodes, L. E.: The role of sunlight exposure in deter-mining the vitamin D status of the U.K. white adult population, Brit. J. Dermatol., 163, 1050–1055, 2010.
Weihs, P. and Webb, A. R.: Accuracy of spectral UV model calcu-lations: 1. Consideration of uncertainties in input parameters, J. Geophys. Res.-Atmos., 102, 1541–1550, 1997.
Williamson, C. E., Zepp, R. G., Lucas, R. M., Madronich, S., Austin, A. T., Ballare, C. L., Norval, M., Sulzberger, B., Bais, A. F., McKenzie, R. L., Robinson, S. A., Häder, D.-P., Paul, N. D., and Bornman, J. F.: Solar ultraviolet radiation in a changing climate, Nature Clim. Change, 4, 434–441, 2014.
WMO: Scientific assessment of ozone depletion: 2006, Global Ozone Res. Monit. Proj. Rep. 50, 572 pp., 2007.
Yang, E.-S., Cunnold, D. M., Salawitch, R. J., McCormick, M. P., Russell, J., Zawodny, J. M., Oltmans, S., and Newchurch, M. J.: Attribution of recovery in lower-stratospheric ozone, J. Geophys. Res.-Atmos., 111, D17309, doi:10.1029/2005jd006371, 2006. Zerefos, C.: Evidence of the El Chichón stratospheric volcanic
cloud in Northern Greece, Geofísica Internacional, 23, 299–304, 1984.
Zerefos, C. S.: Long-term ozone and UV variations at Thessaloniki, Greece, Physics and Chemistry of the Earth, Parts A/B/C, 27, 455–460, 2002.