ISSN: 1941-7020
© 2014 R.C. Tesiero III et al., This open access article is distributed under a Creative Commons Attribution (CC-BY) 3.0 license
doi:10.3844/ajeassp.2014.45.57 Published Online 7 (1) 2014 (http://www.thescipub.com/ajeas.toc)
Corresponding Author: Raymond C. Tesiero III, Department of Computational Science and Engineering,
Mechanical Engineer and Research Coordinator for the Center for Energy Research and Technology, C.E.R.T.,North Carolina A and T State University, NC 27411,
Greensboro, USA Tel: (336) 285-3217 Fax: (336) 256-0469
LOW-COST STRATEGIES TO
SAVE ENERGY IN K-12 SCHOOLS
1
Raymond C. Tesiero III,
2Nabil Nassif,
3Harmohindar Singh and
4K.M. Flurchick
1Department of Computational Science and Engineering,
Mechanical Engineer and Research Coordinator for the Center for Energy Research and Technology, C.E.R.T., North Carolina A and T State University, NC 27411, Greensboro, USA
2Department of Civil, Architectural and Environmental Engineering,
North Carolina A and T State University, NC 27411, Greensboro, USA
3College of Engineering, North Carolina A and T State University, NC 27411, Greensboro, USA 4Department of Computational Science and Engineering and Physics,
North Carolina A and T State University, NC 27411, Greensboro, USA
Received 2014-01-30; Revised 2014-02-12; Accepted 2014-03-17
ABSTRACT
Advanced Energy Management Control Systems (EMCS) offer an excellent means of reducing energy consumption in Heating, Ventilating and Air Conditioning (HVAC) systems while maintaining and improving indoor environmental conditions. This can be achieved through the use of computational intelligence and optimization with a building automation system and multiple sensors, which can be quite expensive. However, energy awareness and proper scheduling achieve the best opportunities to save energy with little to no cost for existing facilities. These “low-tech/low-cost” ideas are easily implemented and quickly reduce utility costs. This article includes actual utility data and information gathered over the past 20 years while performing energy audits at several K-12 Schools in North Carolina, discusses well known and documented control strategies that are rarely implemented in most school districts and universities and will extrapolate savings for an entire school district based on real data. These processes can also be integrated into an EMCS to perform several intelligent functions achieving optimal system performance. This article focuses on control strategies utilizing time-of-day scheduling that can be used with 7-day programmable thermostats, electronic time controllers and a Building Automation System (BAS). These controllers (7d-prog. thermostat, electronic time controller and BAS) will achieve lower energy consumption while maintaining occupant comfort by performing and prioritizing the appropriate actions. Real savings can be achieved quickly by utilizing these common sense approaches to control existing HVAC and lighting systems in schools.
Keywords: Energy Awareness, Scheduling, Energy Reduction, HVAC and Lighting
1. INTRODUCTION
The recent global trend shows as fuel costs rise, improving energy efficiency in buildings is a major concern for owners and building managers. Several
reasons are behind the push towards a reduction in energy consumption:
• Utility rebates
• Carbon footprint awareness (Greenhouse gas emissions)
• LEED certification
Today electricity is generated mainly from non-renewable energy sources and over consumption leads to faster depletion of the energy reserves on earth. Electricity is becoming more expensive and generation of electricity from conventional fuels is extremely damaging to the environment because great quantities of carbon dioxide and monoxide, sulphur dioxide and other hazardous materials are released into the atmosphere. Reducing the consumption of electricity will prolong the existence of the natural energy reserves and limit pollution of the atmosphere while at the same time save money.
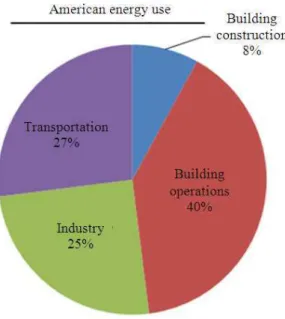
A structured approach to energy management can help to identify and implement the best ways to reduce energy costs for a facility. Today buildings in the U.S. consume 72% of electricity produced and use 55% of U.S. natural gas. Buildings account for about 48% of the energy consumed in the United States (costing $350+ billion per year), more than industry and transportation. Of this energy, heating and cooling systems use about 55% (HVAC, Ventilation and Hot Water Heating), while lights and appliances use the other 35% (Architecture, 2012) Fig. 1 and 2.
Projected world marketed energy consumption in the next 20 years is in the 600+ quadrillion BTU range (Mincer, 2011), Fig. 3. Power usage in buildings is often inefficient with regard to the overall building operability. The development of building energy savings methods and models becomes apparently more necessary for a sustainable future.
The capacity of the HVAC system is typically designed for the maximum or extreme conditions for the building. The HVAC system mainly operates in partial load from the design variables such as solar loads, occupancy levels, ambient temperatures, building and office equipment, lighting loads, etc. These variables are constantly changing throughout the course of the day. Deviation from the HVAC system design can result in drastic swings or imbalance since design capacity is greater than the actual load in most operating scenarios. Without proper HVAC programming control sequences, the system can become unstable and the building will overheat or overcool spaces. Previous research utilizing low-tech and low-cost strategies can achieve on average up to 20% savings in building HVAC energy
consumption which can equate to 35+ billion dollars and over 100 quadrillion BTU’s.
The Center for Energy Research and Technology, (C.E.R.T.) located on the campus of North Carolina A&T State University performs energy audits and assessments for facilities in North Carolina. C.E.R.T. focuses on outreach and extension activities and education relating to renewable energy, energy efficiency, alternative fuels and vehicle technologies, sustainable green building and the environment. C.E.R.T. is funded through a grant from the NC State Energy Office (NCSEO) and most activities focus on K-12 energy awareness, conferences, fairs and expositions, workshops and audits/assessments. Through the different levels of energy audits, many good investment opportunities have been discovered that can achieve payback Return On Investment (ROI), in as little as one-month to under two-years, but we will only focus on the “low-tech/low-cost” strategies that should be implemented immediately to start saving money. “low-cost” signifies that no capital expenditures are needed; however, maintenance employees’ time is required to implement these strategies. Energy costs are the largest operating expense for school districts after salaries and benefits. America’s schools spend more than $7.5 billion annually on energy, more than they spend on textbooks and computers combined and in recent years those costs have increasingly strained their budgets (USEPA, 2008).
Fig. 1. American energy use
Fig. 2. Total building energy consumption by end use
Commissioning existing buildings can reduce energy costs up to 20%. The payback for investment in low cost opportunities typically ranges from a few months to two years. The energy assessment process involves a coordinated effort between C.E.R.T. and the building operating staff. The standard information collected is:
• The building’s age (including any renovations and additions)
• A description of the typical areas or spaces within the facility
• The square footage
• The hours of occupancy or building schedule • One-year’s utility data
• Several photographs that identify equipment and document the building’s current condition
• Interviews with employees and building operators • Specifications of major electrical, mechanical and
plumbing related equipment (anything that uses energy)
Energy data and building information collected in the field are analyzed to determine the baseline energy performance of the building. Using spreadsheet-based energy calculations, C.E.R.T. estimates the energy and cost savings associated with the installation of each of the recommended Energy Conservation Measures (ECM). The energy assessment or audit report presents the results of these efforts.
2. CLASSIFICATION OF ENERGY
AUDITS OR ASSESSMENTS
Energy Analysis, Assessments and Audits can be mentioned interchangeably. As stated in ASHRAE (2004) the assessments can require different levels of effort depending on the needs and resources of the owner. These classifications are:
• Preliminary Energy Audit (PEA)-typically a spread sheet based report, identifying the top five ECMs • Level I energy audit-this report elaborates on the
PEA in a basic word document
• Level II energy audit-this is a more detailed report with several ECMs and ROI calculations
• Level III or Detailed Energy Audit (DEA)-this is a thorough report, where commissioning of the building is sought
2.1. Building Automation Systems (BAS)
Building Automation Systems (BAS) are centralized, interlinked networks of hardware and software, which monitor and control the environment in commercial, industrial and institutional facilities (KMC, 2012). While managing various building systems, the automation system ensures the operational performance of the facility as well as the comfort and safety of building occupants. Generally, building automation begins with control of Mechanical, Electrical and Plumbing (MEP) systems (KMC, 2012).
Regardless of what type of MEP system exists in a facility, it can be controlled intelligently, effortlessly and more efficiently with a BAS using typical energy management strategies are shown below:
• Time of day scheduling • Avoid conservative scheduling • Night setback
• Optimal start/stop
• Implement an energy awareness program • Economizers
• Demand limiting • Supply air reset • Chilled/hot water reset
• Separate schedules for area or zone usage • Zone temperature sensors
• Chiller/tower optimization
• Develop district energy competition (NEED) • VAV fan pressure optimization
• Systems integration
• Demand Control Ventilation (DCV) • Variable flow pump pressure optimization
These strategies can be implemented without a BAS, using thermostats and/or time control time-of-day schedulers and a bit of common sense. Typically a building’s single largest expense is energy costs. Utilizing a BAS, to monitor and manage your building’s lighting, HVAC and other systems automatically and building specific scheduling programs will gain control of energy costs.
problems. The most significant problems associated with energy inefficiency are found to be:
• Software • Hardware
• Equipment maintenance • Energy management strategies • Human factors
When a BAS is not present, a more “hands-on” approach is necessary. Training and commitment to control strategies will save money; as long as the building’s energy use systems are running properly, the systems can be controlled efficiently. Failure to utilize available features restricts equipment use, especially with controls. It is surprising how many schools spend hundreds of thousands or even millions of dollars on control implementation, but fail to use many of the features provided by the systems. The site visits and school assessments show that most schools are using only a small portion of their control capabilities. There are a number of common human factors that contribute to this problem, as shown below:
• Lack of energy conservation awareness from top-down approach
• Need to please co-workers’ individual comfort levels • Simplicity of “overriding” system parameters • Lack of fundamental HVAC theory
• Lack of programming knowledge • Failure to maintain the system • Fear of change
• Lack of training • Lack of planning • Insufficient staffing • Fear of internal politics • Failure to tune the system
By avoiding obstacles that hinder energy efficiency and following these simple low-tech/no-cost strategies, school administrators can increase the chances that the systems they purchase and install will not only meet their needs, but also help them lower the utility costs of their schools immediately.
3. LOW-TECH/LOW-COST STRATEGIES
For many years, control has been a very active area of the research and development in the HVAC field, aiming at the operation of HVAC systems in terms of reducing
overall system operating cost, satisfying thermal comfort of occupants and ensuring indoor air quality. The increase in energy consumption and demand in the last few decades encourages the investigation of new methods to reduce energy losses. The HVAC systems contribute a significant share of energy consumed in buildings. So it is advisable to find methods to reduce the rise of energy consumption in HVAC systems (Homod et al., 2012). While there are numerous effective optimal control strategies developed, growing concern for energy efficiency and costs, due to the extremely high fuel oil prices and the shortage of energy supply, has evoked society and building professionals to pay more attention to overall system optimal control and operation and provides incentives to develop the most extensive and robust supervisory and optimal control methodologies for HVAC systems (Wang and Jin, 2000).
Over the last two decades or so, efforts have been undertaken to develop supervisory and optimal control strategies for building HVAC systems thanks to the growing scale of BAS integration and the convenience of collecting large amounts of online operating data by the application of BASs. These energy or cost-efficient control settings are optimized in order to minimize the overall system energy input, or operating cost, without violating the operating constraints of each component and without sacrificing indoor environmental air quality. One of the main achievable goals of the effective use of BASs is to improve the building’s energy efficiency, lowering costs and providing better performance (Wang and Ma, 2008).
Energy savings and thermal comfort are important to both facility managers and building occupants. As a result, new innovations in the field are constantly under investigation. Commercial building HVAC systems consume large quantities of electricity. Therefore it is important for facility managers to take advantage of lower energy rates. The evolution of design, operation and maintenance of buildings has changed significantly in the past 20 years since the advancement of controls and technology.
C.E.R.T.’s suggested top three low-tech/no-cost opportunities to save energy in schools are: Develop and implement an energy awareness program, coordinate an energy competition similar to National Energy Education Development Project (NEED) and optimize HVAC and lighting through proper scheduling.
3.1. Implement an Energy Awareness Program
is essential to saving energy in schools. Four key components are:
• Planning-set goals and objectives, recruit, assess communication channels and financial resources and create data reporting and evaluation measures • Design and implementation-solicit input, identify
behaviors, develop motivational techniques, develop schedule and produce visual materials
• Evaluate and report results-obtain feedback on evaluations, document the savings and share results • Sustainability-develop ways to launch the program,
continue to implement incentives and publicly recognize accomplishments and conduct regular meetings (FEMP, 2007)
Research has uncovered that energy savings up to 10% can be achieved in a school district simply through awareness. A large school district in North Carolina claims that some schools have saved up to 40% when comparing a single month to its previous year. (Obviously there are many factors that can influence these figures including outdoor air temperatures, occupancy levels, etc.) Teachers, students, custodians and administrative staff all generate a new school spirit around saving energy by turning off lights, televisions, computers, printers and monitors, utilizing window shades and daylighting techniques. There is also proof that the participants in the program spread their newfound knowledge to the community.
3.2. Coordinate Energy Competitions
Energy competitions within a school district are educational and save utility costs. The most recognized national competition is the National Energy Education Development Project (NEED). All NEED schools have outstanding classroom-based programs in which students learn about energy. This program combines academic competition with recognition to acknowledge everyone involved in NEED during the year and to recognize those who achieve excellence in energy education in their schools and communities. The students and teachers set goals and objectives and keep a record of their activities. In April, the students combine their materials into scrapbooks and send them to their state coordinators (NEED, 2013). This competition requires reports to be submitted with proof of implementing energy conservation techniques that save money for the school and community. A district in North Carolina implemented their own “Energy Challenge” and
awards schools based on specific goals that must be met. Their program is loosely based on the NEED program and has been in place for the last 3 years. This author received e-mails reporting energy savings of between 1-30% in 2012 and 1-40% in 2013, from schools that competed in an energy awareness and conservation program, as compared to schools in the district that did not participate.
3.3. Utilize Control Scheduling Strategies with
BAS, Time Clocks and Thermostats
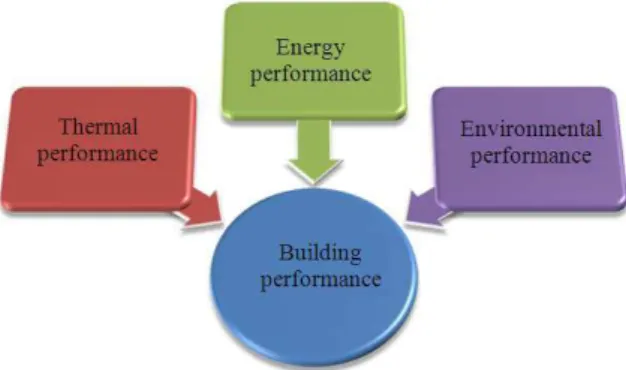
Energy savings and thermal comfort are important to both facility managers and building occupants. As a result, new innovations in the field are constantly under investigation. Building performance can be improved with attention to the relationship between design variables and energy performance. Building performance (Fig. 4) can be divided into three categories:
• Thermal performance or thermal loads
• Energy performance or energy-consuming equipment
• Environmental performance or indoor environmental factors including thermal comfort, lighting, air movement, etc
Control functions are the basic functions of BASs. Energy savings can be achieved using several key control strategies while operating a rooftop VAV HVAC system. The four key control strategies are:
• Optimal start/stop • Fan-pressure optimization • Supply-air-temperature reset • Ventilation optimization
Fig. 4. Energy, thermal and environmental performance of buildings
Fan-pressure optimization utilizes communicating controllers in a VAV system to optimize the static-pressure control function to minimize duct pressure and save energy. Several benefits are achieved with this strategy:
• Reduced supply fan energy use • Lower sound levels
• Reduced risk of fan surge • Flexibility of sensor location
Supply-Air Temperature Reset (SATR) consists of raising the supply-air temperature thus saving compressor and reheat energy. An air-side economizer is beneficial to this strategy because when the outdoor air is cooler than the supply air temperature set-point, the compressors are shut off and the outdoor air dampers modulate to meet the desired supply-air temperature. SATR should minimize energy consumption considering compressor, reheat, fan and humidity levels.
Ventilation optimization involves resetting intake airflow per occupancy levels. This strategy can be implemented utilizing CO2 sensors, occupancy sensors and time-of-day schedules; this is more commonly known as demand controlled ventilation or DCV. Several benefits are achieved with this strategy:
• Assures proper ventilation without requiring a CO2 sensor in every zone
• Enables documentation of actual ventilation system performance
• Uses system-level ventilation reset equations that are explicitly defined in an industry-wide standard
These strategies implemented for rooftop VAV systems can achieve about 30% reduced energy consumption in buildings (Murphy, 2006).
These strategies and others are thoroughly described in Murphy’s article, Using Time-of-Day Scheduling to Save Energy, published in ASHRAE Journal, May 2009. Night setback and optimal stop, is the strategy that allows indoor temperature to drift during unoccupied periods; in other words, the systems are turned off when nobody is in the schools. Obviously, the systems must be set to optimal start, allowing the system time to reach the desired indoor temperature comfort levels prior to anyone entering the school. Murphy also mentions that fresh outdoor air louvers can be shut during unoccupied periods to further save energy. If a manual system is installed or the operations department is hesitant to completely turn-off systems at night, then the systems can at the very minimum be adjusted a few degrees (+/-10°F depending on cooling or heating mode) so the HVAC systems don’t work as hard during unoccupied periods (evenings and weekends).
Another energy saving strategy is to set the override feature for a 2 h period of time. If a space or zone needs conditioned air during an unoccupied mode and the override is employed, ensure it is not on indefinitely. Therefore, automatically returning the zone to the unoccupied mode after the 2 h defined time limit. This feature goes hand-in-hand with less conservative time-of-day operating schedules.
Create separate time-of-day operating schedules for areas of the school with significantly different usage patterns. This author has seen a Media Center’s schedule that specifies no classes on Mondays and no classes until 8:50 am Tuesday-Friday, with nothing after 2:40 pm. This specific media center is occupied roughly 28 h per week when school is in session or 17% of the week it needs MEP equipment running. Gymnasiums, cafeterias and all specials (music, art, etc.) have separate schedules that can save energy. If administration, teachers and custodians communicate with the operations departments per school in a district, millions of dollars in utility costs can be conserved.
4. RESULTS FROM ACTUAL ENERGY
RETROFIT PROJECTS
The tables and figures shown are developed from actual utility data recorded during energy audits in North Carolina. The first example refers to two middle schools built in the same district in 2007, with approximately the same number of students and staff. The school buildings are identical, however they are in two different locations with different site orientations and vary in annual energy consumption between 16-20%. “School A” is in an open field with direct sunlight with a west-southwest position and “School B” is in the shade of a mountain with a southeast position. All classrooms had individual heat pumps controlled by manual thermostats in the classrooms.
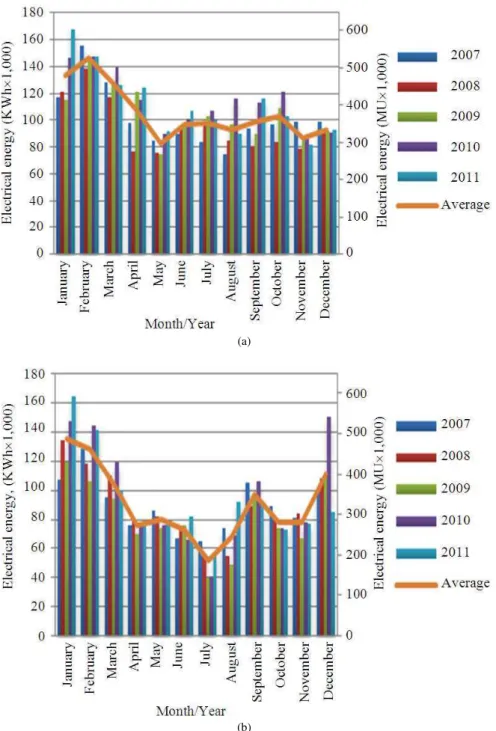
The total electrical energy used by both schools was recorded for five years. “School A”, as shown in Fig. 5a, follows an unusual annual pattern where the spring, summer and fall seasons are relatively flat. “School B”, as shown in Fig. 5b, follows a normal annual pattern where more energy is used during cooler weather. C.E.R.T. assumed building orientation had some effect on the pattern, but after modeling both buildings, the difference in orientation resulted in only a 1-2% energy difference.
The schools had two different electrical contractors program their twelve channel electronic time control, time-of-day schedulers. There were 12 channels set into the controller and each channel had two events (on and off). The channels were identified as: Gymnasium, Classrooms Wing 1, Classrooms Wing 2, Kitchen,
Cafeteria Dining Room and Stage, Classrooms Wing 3, Classrooms Wing 4, Administration and Main Office, Media Center and Library, Classrooms Wing 5, Locker Room Water Heater and Kitchen Water Heater.
“School A” had a programmer error that was identified during the audit where a channel was always ON because the event to turn it OFF was accidently programmed into another channel. As a result, since 2007 the HVAC systems in that zone were always ON, but being controlled by manual thermostats. C.E.R.T. identified that both schools had an extremely basic program with little to no thought process built into the scheduler; all zones were turned ON at 6:00 am and turned OFF at 6:00 pm Monday through Friday year round. “School A” set the same schedule (6:00 am-6:00 pm) for weekends and “School B” was set to be ON in all zones from 8:00 am-1:00 pm on Saturdays and Sundays. No holidays, vacations, or teacher workdays were entered into either scheduler. In a school facility, this is a critical component when considering energy conservation.
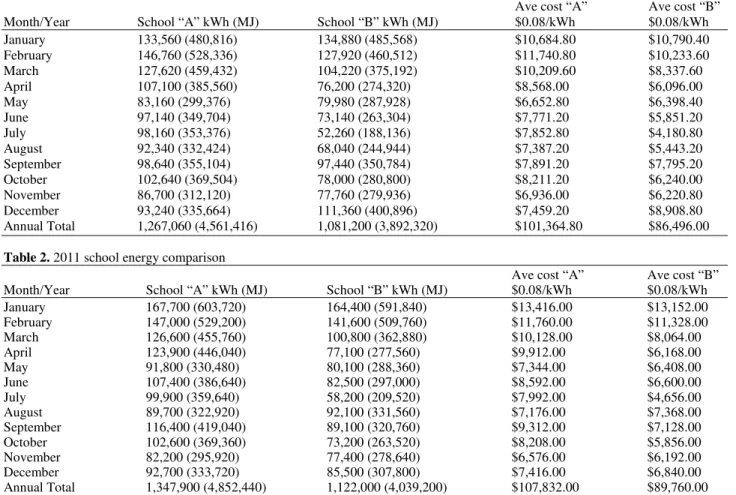
Simple math shows that scheduling alone makes up the large discrepancy between the two identical schools. “School A” had its systems ON for 84 h per week and “School B” had its systems ON for 70 h per week, which is a difference of 16.67%. The 5-Year average school energy comparison between schools “A” and “B”, as shown in Table 1 and 2011 School Energy Comparison, as shown in Table 2, both show the average difference in electrical costs range from $15,000-$17,000 annually (Ave. Cost $0.08/kWh includes Demand Charges and Sales Tax).
(a)
(b)
Fig. 5. (a) Total electrical energy for “School A” (b) total electrical energy for “School B”
These were the two newest schools in the district at the time of our audits and the only schools we addressed. There were 21 schools in the district and similar scheduling efforts could save the district a minimum of $10,000 per school for annual savings over $200,000.
Table 1. 5-Year average school energy comparison
Ave cost “A” Ave cost “B”
Month/Year School “A” kWh (MJ) School “B” kWh (MJ) $0.08/kWh $0.08/kWh
January 133,560 (480,816) 134,880 (485,568) $10,684.80 $10,790.40
February 146,760 (528,336) 127,920 (460,512) $11,740.80 $10,233.60
March 127,620 (459,432) 104,220 (375,192) $10,209.60 $8,337.60
April 107,100 (385,560) 76,200 (274,320) $8,568.00 $6,096.00
May 83,160 (299,376) 79,980 (287,928) $6,652.80 $6,398.40
June 97,140 (349,704) 73,140 (263,304) $7,771.20 $5,851.20
July 98,160 (353,376) 52,260 (188,136) $7,852.80 $4,180.80
August 92,340 (332,424) 68,040 (244,944) $7,387.20 $5,443.20
September 98,640 (355,104) 97,440 (350,784) $7,891.20 $7,795.20
October 102,640 (369,504) 78,000 (280,800) $8,211.20 $6,240.00
November 86,700 (312,120) 77,760 (279,936) $6,936.00 $6,220.80
December 93,240 (335,664) 111,360 (400,896) $7,459.20 $8,908.80
Annual Total 1,267,060 (4,561,416) 1,081,200 (3,892,320) $101,364.80 $86,496.00
Table 2. 2011 school energy comparison
Ave cost “A” Ave cost “B”
Month/Year School “A” kWh (MJ) School “B” kWh (MJ) $0.08/kWh $0.08/kWh
January 167,700 (603,720) 164,400 (591,840) $13,416.00 $13,152.00
February 147,000 (529,200) 141,600 (509,760) $11,760.00 $11,328.00
March 126,600 (455,760) 100,800 (362,880) $10,128.00 $8,064.00
April 123,900 (446,040) 77,100 (277,560) $9,912.00 $6,168.00
May 91,800 (330,480) 80,100 (288,360) $7,344.00 $6,408.00
June 107,400 (386,640) 82,500 (297,000) $8,592.00 $6,600.00
July 99,900 (359,640) 58,200 (209,520) $7,992.00 $4,656.00
August 89,700 (322,920) 92,100 (331,560) $7,176.00 $7,368.00
September 116,400 (419,040) 89,100 (320,760) $9,312.00 $7,128.00
October 102,600 (369,360) 73,200 (263,520) $8,208.00 $5,856.00
November 82,200 (295,920) 77,400 (278,640) $6,576.00 $6,192.00
December 92,700 (333,720) 85,500 (307,800) $7,416.00 $6,840.00
Annual Total 1,347,900 (4,852,440) 1,122,000 (4,039,200) $107,832.00 $89,760.00
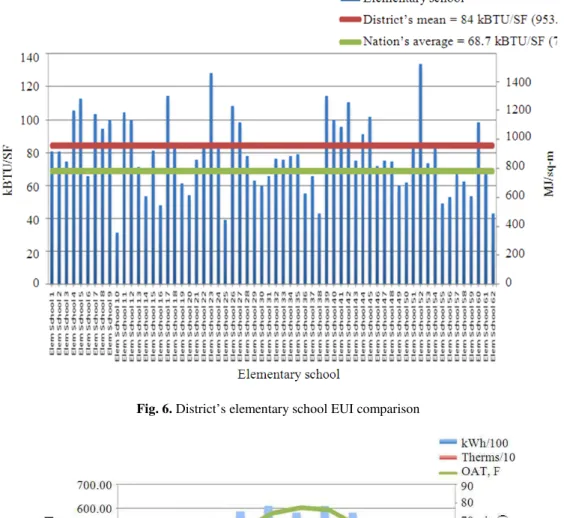
One District’s Elementary School EUI Comparison, as shown in Fig. 6, has a fluctuating pattern among the 62 elementary schools in the district. Most schools in America tend to cluster around the median energy use intensity of approximately 68,700 BTU per square foot (ft2) or 780.2 MJ/m2 from all energy sources (Energy Star Building Upgrade Manual). As noted in Fig. 6, this district has an average EUI of 84 kBTU/sf or 953.9 MJ/m2, which exceeds the national average by 20%. Scheduling and awareness could easily bring the EUI average in line and save this particular district an estimated $500,000-$1,000,000 annually in the elementary schools alone.
There is a disturbing trend in the summer months at another elementary school in the district, as shown in
Fig. 7, Elementary School Energy Vs. Outside Air Temperature (OAT).
The graph shows that the OAT follows a standard bell-curve, the natural gas usage trends accordingly and the electrical usage is almost flat from May to
Fig. 6. District’s elementary school EUI comparison
Fig. 7. Elementary school energy Vs. Outside Air temperature (OAT, °F)
5. DISCUSSION
Developing energy efficiency in schools, colleges and universities can reduce utility bills by 20 to 40%, releasing money in the budgets to be spent on
ones that don’t cost anything and require some responsible thinking:
• Inform teachers, professors, staff and students • Turn of lights when an area is unoccupied • Fix dripping faucets
• Close windows and doors and fix seals • Adjust temperature set-points on thermostats • Reduce, reuse and recycle
• Track utility data
• Implement an energy conservation program • Understand energy consumption
• Mass transit or efficient bussing of students • Go paperless
• Implement holiday scheduling • Install occupancy sensors • Employ daylight harvesting
• Practice HVAC equipment optimization • Execute on-demand ventilation
• Utilize variable frequency drives
The list above requires little to no cost and can make an immediate impact on energy savings with a quick return on investment. There are numerous ideas and techniques to save energy in buildings; we have just scratched the surface. Reducing a school’s energy consumption will impact both financial and environmental interests. Increasing energy costs, environmental responsibilities, aging infrastructure and financial costs are provoking schools to reassess their energy utilization. Reducing carbon emissions and improving our environment are becoming part of the science curriculum in schools and implementing energy conservation techniques in schools can assist with the student’s education.
This study is intended to raise awareness of potential savings that relate to energy conservation in schools. Low-cost strategies demonstrating how school faculty, staff and students can take action to address energy inefficiencies and implement techniques that immediately save money are discussed. Finally, this study has discussed several examples where C.E.R.T. has effectively analyzed data to provide simple examples to lower energy costs in schools.
The energy conservation measures need to be sustained over time. Data analysis, education, awareness, implementation and continuous improvement need to be further developed in each school year after year. Students will become professionals and will utilize these energy techniques and thought processes throughout their life and into their communities.
6. CONCLUSION
Developing and implementing an energy awareness program, coordinating an energy competition and optimizing HVAC and lighting through proper scheduling are three low-tech/low-cost strategies to save energy in schools. Avoid overly conservative scheduling by using night setback, optimal start and stop and timed override buttons, use separate time-of-day schedules for areas with differing usage patterns and identify “bad-behavior.” These simple strategies help improve this low-tech idea to save energy in schools without sacrificing student, teacher and administrative staff’s comfort.
7. ACKNOWLEDGMENT
This article was produced under the direction and guidance of my PhD advisor, Dr. Nabil Nassif, who is an assistant professor in the Department of Civil and Architectural Engineering at NC A&T State University. In addition, several individuals at NC A&T State University including the Center for Energy Research and Technology were instrumental in the writing and development of this document, including the center’s director, Dr. Harmohindar Singh who is a Professor Emeritus in the College of Engineering, my wife Michelle for her editing and Carol Graydon, the Energy Engineer for Guilford County schools, who provided valuable data documented in this article.
8. REFERENCES
Architecture, D., 2012. Sustainability and the Impacts of Building.
ASHRAE, 2004. ASHRAE Procedures for Commercial Building Energy Audits. ASHRAE.
Homod, R.Z., K.S.M. Sahari, H.A.F. Almurib and F.H. Nagi, 2012. Gradient auto-tuned Takagi-Sugeno fuzzy forward control of a HVAC system using predicted mean vote index. Energy Build. DOI: 10.1016/j.enbuild.2012.02.013
KMC, 2012. Understanding building automation and control systems. KMC Controls.
Murphy, J., 2006. Energy-saving control strategies for rooftop VAV systems. Trane Eng. Newslett., 35. Murphy, J. and N. Maldeis, 2009. Using time-of-day
scheduling to save energy. ASHRAE J., 51: 42-48. NEED, 2013. National energy education development
FEMP, 2007. Creating an energy awareness program: A Handbook for Federal Energy Managers. U.S. Department of Energy Federal Energy Management Program.
USEPA, 2008. United States environmental protection agency. Office of Air and Radiation 2008 Edition. Energy Star Building Upgrade Manual.
Wang, S. and X. Jin, 2000. Model-based optimal control of VAV air-conditioning system using genetic algorithm. Build. Envir., 35: 471-487. DOI: 10.1016/s0360-1323(99)00032-3
Wang, S. and Z. Ma, 2008. Supervisory and optimal control of building HVAC systems: A review.
HVAC&R Res., 14: 3-32. DOI: