0103 - 5053 $6.00+0.00
Article
*e-mail: [email protected]
A 2D Model of the Dynamic of the Collision: I
2-Polymeric Liquid Surfaces of
Perfluorinatedpolyether (PFPE), Polydimetilsiloxane (PDMS) and Squalane
Alexandre S. Leal,*,a Claudio G. dos Santos,b Cristina M. Quintellac and Heloiza H. R. Schord
a
Comissão Nacional de Energia, Centro de Desenvolvimento de Tecnologia Nuclear, Universidade Federal de Minas Gerais Campus, 30.123.970 Belo Horizonte-MG, Brazil
b
Departamento de Química do Instituto de Ciências Exatas e Biológicas, Universidade Federal de Ouro Preto, 35.400-000 Ouro Preto-MG, Brazil
c
Departamento de Química, Universidade Federal da Bahia, 40.170-280 Salvador-BA, Brazil
d
Departamento de Química, Instituto de Ciências Exatas, Universidade Federal de Minas Gerais, 31.270-901 Belo Horizonte-MG, Brazil
Este artigo apresenta um modelo em duas dimensões para o espalhamento de I2 pela superfície de líquidos poliméricos: poliéterperfluorado (PFPE), polidimentilsiloxano (PDMS) e esqualano. A função energia potencial adotada para descrever a interação do gás com a superfície líquida formulada é do tipo LEPS. Cada molécula diatômica I2 e o potencial I-superfície são representados como uma função de Morse, com parâmetros ajustados de dados experimentais do espalhamento sobre as referidas superfícies. A superfície líquida foi modelada como um oscilador harmônico bidimensional. Os resultados obtidos com este modelo simplificado da superfície reproduzem, satisfatoriamente, os dados experimentais da dinâmica do espalhamento, em que os processos de espalhamento inelástico e captura e desorção são caraterizados. A temperatura vibracional da molécula de I2 espalhada foi determinada em concordância com os resultados experimentais.
This paper presents two dimension classical trajectory calculations for the scattering of an I2 molecule in the liquid polymeric surfaces of perfluorinatedpolyether (PFPE), polydimethyl-siloxane (PDMS) and squalane. The potential function describing the interaction of the gas molecule with the liquid surface is formulated as a modified LEPS potential. Each diatomic I2 molecule and the I-surface potential are represented as a Morse function, with parameters adjusted from experimental data of scattering experiments. The surface was modeled as a typical effective mass with two harmonic vibrational degrees of freedom. This dynamics of the scattering process is in good agreement with experimental dynamical data. The experimentally observed inelastic scattering (IS) and the trapping and desorption (TD) processes were characterized and the determined I2 vibrational temperatures showed good agreement with experimental values.
Keywords: gas-liquid scattering, perfluorinatedpolyether, polydimethylsiloxane, squalane
Introduction
Collisions of gas molecules with liquid surfaces are involved in many physical and chemical phenomena that occur in the gas-liquid interface such as evaporation, condensation, dissolution and reaction. Despite that, very little is known about the dynamics of the gas-liquid interaction. Knowledge of the mechanisms of interaction
conversion processes between the gas molecules and the liquid.1
Recently a number of spectroscopic methods have been employed to probe the dynamics of interface processes. Experiments of scattering of atoms and molecules from liquid surfaces, some in association with molecular dynamics simulations have been used to elucidate the dynamics of inelastic collision, the trapping and desorption processes and the reaction between
gaseous species and liquids of low vapor pressure1-11 and
liquid crystals.12
In this work, we have simulated a scattering experiment
of I2 molecules from the liquid polymeric surfaces of PFPE
(perfluorinatedpolyether, F[CF(CF3)CF2O]nCF2CF3), PDMS (polydimethylsiloxane, (CH3)3SiO[Si(CH3)2O]nSi(CH3)3) and squalane (2,6,10,15,19,23-hexamethyltetracosane,
C30H62) in vacuum, in the energy range of 10 kJ mol-1 to
40 kJ mol-1. In the related experiments, the processes in
which the molecules are scattered directly from the surface could be distinguished from those in which they are adsorbed at the surface. Also the amount of energy transferred during the collision as vibrational excitation of the gas molecule was determined and shown to depend on the chemical nature of the surface.10,11
Here, we present a calculation of the dynamic of these scattering processes aiming at characterization of the gas-liquid interaction and a molecular description of the collision processes. The model presented here was extended to describe a three dimensional atom-liquid
surface scattering with some changes.12
Methods
The classical trajectory method was employed to solve
the dynamics of the scattering of the I2 gas molecule from
a model liquid surface, in the energy range of 10 kJ mol-1
to 40 kJ mol-1. The liquid polymeric surfaces are modeled
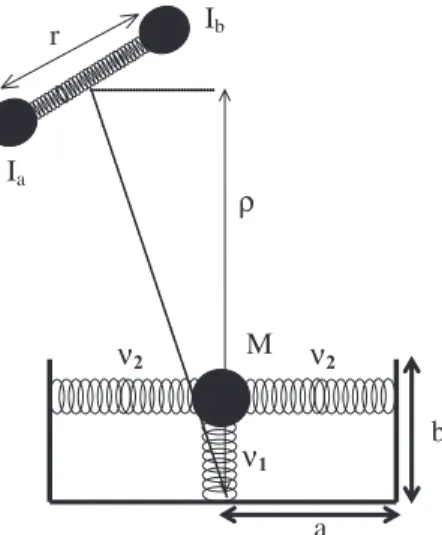
as two-dimensional coupled harmonic oscillators as it is illustrated in Figure 1. The values of the respective parameters are presented in Table 1.
This simple model of a liquid surface is adequate for a preliminary investigation of the dynamics of the gas-liquid interaction in this energy range. Experiments have shown that PDMS, squalane and PFPE have axial
protruding –CH3 and –CF3 groups, respectively, in a trans
configuration and the orientation of these groups also
suggests some degree of order in the liquid surface.12-15
Therefore, we describe in this model the oscillations of
the protruding groups, taken as a –CH3 group in PDMS
and squalane and a –CF3 group in PFPE,as the oscillations
of a set of three coupled harmonic oscillators of mass M
corresponding to the mass of each group. The frequencies
ν1 and ν2 of the oscillators are the two lowest frequencies
observed in the Raman spectra of these compounds.16 The
lowest frequencies ν1 are taken as the frequencies of
molecular rocking modes of the groups –CH3 and –CF3 of
the polymer chain and the higher frequencies ν2 are
approximated as the frequencies of the stretching mode of the periodic C–C and C–O bonds in squalane and PFPE surfaces and the frequency of Si–O stretching in the chain
of PDMS.16,17 In Table 1, a represents the length of C–CF
3
bond in PFPE and C–CH3 bond in PDMS and squalane
while the value of b is the horizontal projection of the
C–CF2O bond in PFPE, Si–O bond in PDMS and C–CH2
bond in squalane. A similar surface model has also been suggested to describe atomic vibrations in metallic atomic surfaces in order to accurately describe the exchange of energy occurring in the scattering of atoms from metallic surfaces.18
The potential representing the interaction between the
I2 and the model liquid surface is a LEPS
(London-Eyring-Polanyi-Sato) potential employed in many gas phase
reaction studies19 and gas-solid interaction.20,21 This
potential can be easily calculated and is also appropriate to describe the asymptotic atomic configurations in processes were the scattered diatomic molecule is
Table1. Parameters of the models of the surfaces as illustrated in Figure 1
PFPE PFPE PDMS Squalane
a/(a.u.) 2.0742 2.4978 3.8573
b/(a.u.) 2.8932 3.5281 2.8932
ν1/(cm-1) 850 1000 1000
ν2/(cm-1) 190 410 410
Figure 1. Model of I2-liquid polymeric surface interaction. M is the mass
of the protruding groups (–CH3 for PDMS and squalane) and (–CF3 for PFPE). ν1 and ν2 are the vibrational frequencies and a and b the equilib-rium distances as shown in Table 1.
Ia r
ρ
M
a
b
ν1
ν2 ν2
dissociated. VLEPS is a non-pairwise potential for amolecule and a surface S of the following form:
2 / 1 2 2 2 ] [ ab aS bS ab bS aS ab bS aS bS
aS ab
LEPS Q Q Q J J J J J J J J J
V = + + − + + − − − (1)
where ) 1 ( 4 / ) 2 ( ) 1 ( )
( ( 0) 2( 0)
i R R R R i i i
i R De e i i e i i
Q =− −Δ −α − + −α − +Δ
) 1 ( 4 / ) 2 ( ) 1 ( )
( ( 0) 2( 0)
i R R R R i i i i i i i i e e e D R
J = −Δ −α − + −α − +Δ
are empiric functions describing the Coulomb Q
i(Ri) and
exchange Ji(Ri) integrals for each one of the three i pairs,
Ia – Ib , Ia – S and Ib – S, where Ia and Ib are the two iodine atoms and S represents the surface.
The parameters De, α and ∆for the I2 molecule are
well known from spectroscopic data and R0, the length of
I–C bond in equilibrium, was taken as 2.132 Å.16, 22 The
remaining parameters for the I2-surface interaction were
determined interactively from the present calculation fitting the results to experimental data and are presented in Table
2. The initial value of De parameter for each pair of I–S
interaction was arbitrarily chosen as 0.029 a.u.,
corres-ponding to half of the dissociation energy of I2 molecule
and varied from 0.022 to 0.036 in steps of 0.001 a.u. This range is also arbitrary but compatible with acceptable values of dissociation energy of I–C bond in polyatomic molecules.
The initial value of ai was assumed as 0.99 a.u., the same
value as the one of the I2 molecule and it was also
determined interactively in the calculation, changing its value in the range from 0.91 to 0.99 in steps of 0.02. For
each pair of fixed values of Deand α, ∆was varied from
0.2 to 0.6 in steps of 0.1. A total of 750 different sets of parameters values were employed in the calculation.
The initial conditions of the trajectories were the same
as established in the related experiment:10 the molecules
of I2 are in the ground vibrational and rotational states,
the surface is in the ground vibrational state, the initial
kinetic energy of I2 is 40 kJ mol-1 and the molecular beam
is normal to the surface. In order to check the consistency of our results, we have also employed an initial energy of
10 kJ mol-1. The trajectories are calculated by fourth order
Runge-Kutha method with steps of integration of 0.5 a.u. from the initial conditions up to the point where the final I2–S distance is larger than 20.0 a.u.
For each set of potential parameters, 2500 trajectories
were calculated with a standard Monte Carlo error λ lower
than 1%, as defined in equation 2. In this expression, pa =
Na /N, is the probability of adsorption, and Na is the number of trajectories in which the gas is adsorbed in the surface and N is the total number of trajectories.
λ= [(pa(1- pa)/N]
1/2 (2)
The value of λ calculated for this set of trajectories is 0.6% for all three surfaces, which ensures the statistical accuracy of the obtained results.
In the experiment,10 the vibrational temperatures of I
2 after the collision were obtained from the spectra assuming a Boltzmann distribution for the vibrational population proportional to the rate of the intensities peaks in the laser
induced fluorescence spectra of the scattered I2. Here, we
calculate the vibrational temperature by equation 3, where
P0and P1 are the population of the ground and first excited
vibrational states, respectively.
) ln(P0 P1
k E
T= Δ (3)
The two different ways of interaction between the incident molecule and the surface, inelastic collision (IS) and the trapping and desorption (TD), are distinguished by the total time of the trajectory. A particular trajectory is classified as belonging to an IS or TD processes if its time of duration is lower or larger, respectively, than the average trajectory time for a set of 2500 trajectories. This criterion is arbitrary but it can be considered adequate for this bi-dimensional model of the surface proposed here. The same criterion was employed by these authors in a similar model for describing the atom-surface scattering with satisfactory results.12
Results
The optimal values of the parameters De,α, and ∆,
which best reproduced the experimental results of the I2
vibrational temperatures are shown in Table 2.
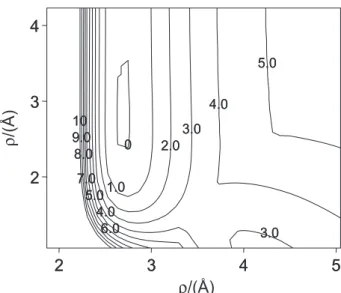
Figure 2 shows the minimum path into the potential
energy for the approximation of the I2 molecule with the
molecular axis parallel to the surface. Figures 3 and 4
Table 2. Set of parameters of the LEPS potential energy surface for the best fitting to the experimental vibrational temperatures of the scattered I2 molecules
PFPE PDMS Squalane
De/(a.u.) α/(a.u.-1) D De/(a.u.) α/(a.u.-1) D De/(a.u.) α/(a.u.-1) D
show, respectively, the corresponding minimum energy path in the PDMS, PFPE and squalane potential surfaces. The depth of the well in the path is due to the value of
De, larger in the PFPE and squalane, than in PDMS, Figure
2. The height of barrier, related to the Sato parameter ∆,
can be observed in Figures 3 and 4. The parameter α
determines the width of the well and affects the dynamics
of the rotation of the molecule.23 Changes in this latter
parameter affect slightly the results compared with De
and ∆. Some general comparative results, between the
surfaces, presented in Table 3, show how they are related by different potential energy surfaces.
Table 3 shows the ratio between the TD and IS processes for the average results for the 2500 trajectories of the time of interaction: tTD/tIS; the fraction of initial
kinetic energy of the I2 molecule after the molecule-surface
interaction, (fETD/fEIS);the rotational energy, (ErTD/ErIS),
and the vibrational energy (EvTD/EvIS). The results show
that the average time for a TD process is 34% higher than IS for PFPE, 32% for squalane and 23% for PDMS. The similarities observed between PFPE and squalane mean that these results are strongly influenced by the parameters
De and ∆. Higher values of such parameters favor the
uptake of the incident gas molecule by the surface and it remains adsorbed for longer time. This explains the higher
value of tTD/tIS of PFPE and squalane compared to PDMS.
This also implies that it is harder for the molecule to escape from the surface which causes a higher transference of its translational initial energy to the vibrational and rotational
modes. This explains the lower value of fETD/fEIS for
squalane and PFPE and higher values of ErTD/ErIS and EvTD/
EvIS compared with those of PDMS. As can be seen in
Figure 2, the deeper the well of the potential molecule-surface, the higher the transfer of the initial translation energy of the molecule to its final vibrational and rotational modes and consequently, the higher the values of (fETD/fEIS), (ErTD/ErIS) and (EvTD/EvIS). In a real situation, in the process of adsorption, the molecule transfers part of its initial energy to the surface. In our model the gain of energy by the liquid surface in the collision is meaningless. This constraint of the model is caused by
Table 3. Ratio of the average values for the TD and IS processes of: time of
interaction (tTD/tIS), fraction of initial kinetic energy (fETD/fEIS), vibrational energy (EvTD/EvIS) and the rotational energy (ErTD/ErIS) for the set of 2500 trajectories calculated with the set of parameters shown in Table 2
PDMS PFPE Squalane
tTD/tIS 1.23 1.34 1.32
fEtTD/ fEtIS 0.44 0.37 0.36
ErTD/ ErIS 15.85 16.12 18.43
EvTD/ EvIS 1.04 1.24 1.42
Figure 2. Minimum potential energy surface for the I–S (iodine atom -surface) interaction for a I2 molecule parallel approximation of the
sur-face. ρ is the distance as shown in Figure 1. Figure 3. Potential energy surface for the parallel approximation of the I2 molecule to model of PDMS liquid surface. The squalane and PFPE have identical potential surfaces.
the approximation of the movements of the real protruding groups with several degrees of freedom by a set of two coupled harmonic oscillators.
Experimental results of gas-liquid scattering 6,9,10,18 have
shown that for higher values of incident energy E of the
atom or molecule, the IS process dominates and for the
lower values of Ea significant amount of the incident gas
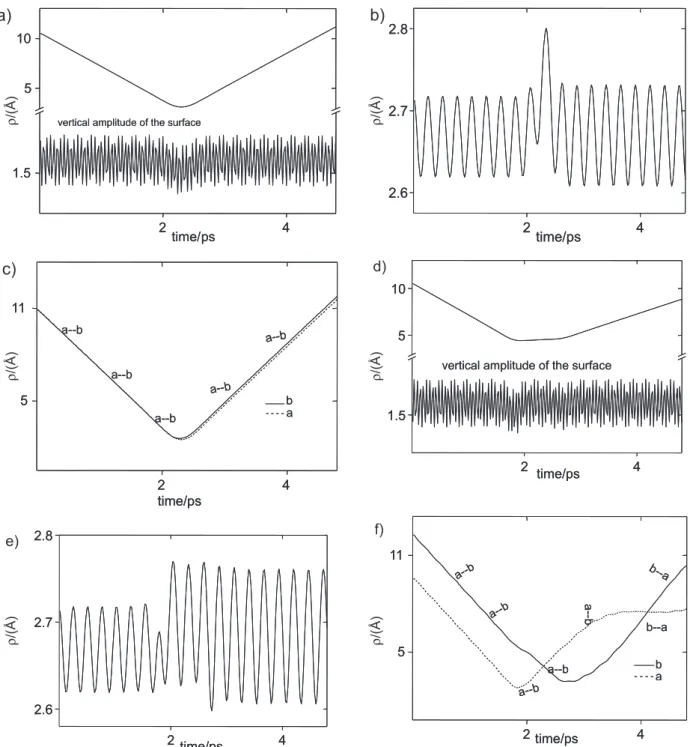
species is temporarily adsorbed. This result, demonstrated in a previous study of the dynamic of I2 - PFPE scattering14 is confirmed by the simulation. This is showed in Figure
5, in which the temporal variation of the parameter ρ, as
defined in Figure 1, is plotted for the surface models of PDMS (5a and 5d), PFPE (5b and 5e) and squalane (5c and 5f), for a particular set of 10 consecutive trajectories
randomly chosen with initial energy of 40 kJ mol-1 (Figures
5a, 5b and 5c) and 10 kJ mol-1 (Figures 5d, 5e, and 5f). It
can be verified that for the same particular set, the amount of trajectories classified as TD grows when Ei = 10 kJ mol-1,
in 5d, 5e and 5f cases. On the other hand, when Ei = 40 kJ
mol-1, in 5a, 5b and 5c, the IS process dominates and the
dynamic differences between the surfaces are not so evident.
Experimentally, this result can be interpreted in terms of the probability of excitation of some of the several
modes of the protruding groups of the surface –CH3 and
–CF3,9 when the gas molecule strikes the surfaces with
lower kinetic energy.
The dynamics of the two distinct modes of interaction
between the incident I2 molecule and the model of the
liquid surface, the IS and TD, can also be investigated by following a typical trajectory for each case. The behavior of the molecule in both situations is illustrated in Figures 6a, 6b and 6c, corresponding to an IS process and in Figures 6d, 6e and 6f, corresponding to a TD process. Figures 6a and 6d it is shown the temporal evolution of
I2–surface distance and the embedded vertical vibration
of the surface. It is evident from the figures the difference of the time in which the molecule remains adsorbed in the surface before being desorbed in each case. This difference is not so evident when the incident energy is
40 kJ mol-1, as shown in Figure 5. This is a consequence
of the low percentage of the kinetic energy of the molecule transferred to the surface. The vibrational and rotational excitation of the molecule are shown in Figures 6b and 6c, for an IS process, and in Figures 6e and 6f for a TD process. The average distance of I–I bond remains the same in the typical trajectory shown in Figure 6b but increases two times in the trajectory illustrated in Figure 6e. The different probabilities of temporary uptake by the surface and the degrees of vibrational and rotational
Figures 5. Temporal evolution of thedistance ρ, as illustrated in Figure1 for 10 typical trajectories in the direct inelastic collision regime. The energy of the
incident molecule is 40 kJ mol-1 (a, b and c), and 10 kJ mol-1 (d, e and f) for the set of 10 trajectories. The models of surface are correspondingly described
excitation of the molecule depend on to the geometry of approximation, as can be seen in Figures 6c and 6f. In both cases the molecule is rotationally cold before the collision, and the occurrence of an IS or an TD process is due to the different relative position between the I–I axis bond and the surface. As a consequence, the conversion
of initial translational energy to vibrational and rotational modes is more effective in a TD process due to the transfer of momentum to the molecule while trying to escape from the surface. The IS process is characterized by a slight loss of the initial translational kinetic energy of the gas molecule.
Figure 6. a) Temporal evolution of thedistance ρ, as illustrated in Figure 1 and the vertical oscillation of the surface embedded for typical for typical IS
collision. The energy of the incident molecule is 40 kJ mol-1; b) Temporal evolution of thedistance ρ, as illustrated in Figure 1, for a typical IS collision
shown in Figure. 6a; c) Temporal evolution of thedistance ρ, as illustrated in Figure 1, for each iodine atom (a and b) for a typical IS collision shown in Figures 6 and 7; d) Temporal evolution of thedistance ρ, as illustrated in Figure 1 and the vertical oscillation of the surface embedded for a typical TD collision. The energy of the incident molecule is 40 kJ mol-1; e) Temporal evolution of thedistance ρ, as illustrated in Figure 1, for a typical TD collision;
The main goal of the experimental work of the
scattering of a beam of I2 molecules from the liquid
polymeric surfaces9,10 was to validate the method of using
the vibrational spectra of a molecule as a probe to get information about the structure of the surface. The obtained vibrational temperature allows one to infer a qualitative and comparative analysis of the surfaces rather than detailed features of each one.
The vibrational temperatures, calculated according to the equation (3), obtained here are compared with the experimental values in Table 4. The average percent error calculated is between 13% for the squalane (TD) and 21% for PDMS (TD) and can be considered satisfactory regarding the simplicity of the model of the surface employed and also it is not so discrepant from those
encountered in the literature for similar simulations.24
Conclusion
The qualitative results presented here suggest that the simple two dimensional model of representation of a liquid surface as set of harmonic oscillators can correctly reproduce some important dynamic and experimental features observed in the scattering of gas species from high density liquid surfaces. The model could distinguish between IS and TD modes of gas-liquid interaction and reproduce, with a good agreement, the experimental
vibrational temperatures of the I2.
Acknowledgments
The thors wish to acknowledge financial support from CNPq and FAPEMIG.
References
1. Nathanson, G. M.; Annu. Rev. Phys. Chem. 2004, 55, 231. 2. Jayne, J. T.; Worsnop, D. R.; Kolb, C. E.; Swartz, E.; Davidovits,
P.; J. Phys. Chem.1996, 100, 8015.
3. Klassen, J. K.; Nathanson, G. M.; Science1996, 273, 333.
4. Tribe, L.; Manning, M.; Morgan, J. A.; Stephens, M. D.; Ronk, W. R.; Treptow, E.; Nathanson, G. M.; Skinner, J. L.; J. Phys. Chem. B 1998,102, 206.
5. Nathanson, G. M;. Davidovits, P.; Worsnop, D. R.; Kolb, C. E.; J. Phys. Chem.1996, 100, 13007.
6. Morgan, J. A.; Nathanson G. M.; J. Chem. Phys. 2001, 114, 1958.
7. Tomassone, M. S.; Couzis, A.; Maldarelli, C. M.; Banavar, J. R.; Koplik, J.; J. Chem. Phys. 2001, 115, 8634.
8. Chase, D.; Manning, M.; Morgan, J. A.; Nathanson, G. M.; J. Chem. Phys. 2000, 113, 9279.
9. Zhao, M. S.; Chemarev, D.; Rice, S.A.; J. Chem. Phys. 1998,
108, 5055.
10. Quintella, C.M.; McCaffery, A. J.; Zidan, M. D.; Chem. Phys. Lett.1993, 214, 563.
11. Keynon, A. J.; McCaffery, A. J.; Quintella, C.M.; J. Chem. Soc., Faraday Trans.1993, 89, 3877.
12. Leal, A. S.; Schor, H. H. R.; Rodrigues, I.; Quim. Nova 2004,
27, 483.
13. Waclawik, E. R.; Cynthia Gon, M.; Donaldson, D. J.; J. Chem. Phys. 1999, 110, 8098.
14. Leal, A.S.; dos Santos, C.G.; Quintella, C. M.; Schor, H.H.R.; J. Braz. Chem. Soc. 1999, 10, 359.
15. Pattai, Z. In The Organic Chemistry of Organic Silicon Compounds, J. Wiley and Sons: New York, 1989, ch. 3-6.
16. Leal, A. S.; Ph.DThesis, Universidade Federal de Minas Gerais, Belo Horizonte, Brazil 2001.
17. Ramasamy, S.; Pradeep, T.; J. Chem. Phys. 1995, 103, 485. 18. Pradeep, T.; Chem. Phys. Lett.1995, 243, 125.
19. Benjamin, I.; Wilson, M.; Pohorille, A.; J. Chem. Phys. 1994,
100, 6500.
20. Levine, R.D.; Bernstein, R.B. In Molecular Reaction Dynamics; Oxford University Press: New York, 1994,ch. 5-6.
21. Pazzi, V. I.; Tantardini, G.G.; Surf. Sci. 1997, 377, 572. 22. Herzberg, G. In Spectra of Diatomic Molecules; Van Nostrand
Reinhold: New York, 1950, ch.5.
23. Schor, H. H. R.; Chapman, S.; Zare, R.N.; J. Chem. Phys.1978,
69, 3790.
24. Lipkin, N.; Gerber, R. B.; Moiseiev, N.; Nathanson, G. M.; J. Chem. Phys.1994, 100, 8048.
Received: March 9, 2006
Web Release Date: April 27, 2007
Table 4. Values of the vibrational temperatures/K of I2 obtained experimentally (Exp.) and obtained by the simulation (Sim.) for the IS and TD processes
PFPE PDMS Squalane
IS TD IS TD IS TD
Exp. Sim. Exp. Sim. Exp. Sim. Exp. Sim. Exp. Sim. Exp. Sim.