HESSD
11, 1–29, 2014Effects of extreme drought on agriculture soil
S. M. Geng et al.
Title Page
Abstract Introduction
Conclusions References
Tables Figures
◭ ◮
◭ ◮
Back Close
Full Screen / Esc
Printer-friendly Version
Interactive Discussion
Discussion
P
a
per
|
D
iscussion
P
a
per
|
Discussion
P
a
per
|
Discuss
ion
P
a
per
|
Hydrol. Earth Syst. Sci. Discuss., 11, 1–29, 2014 www.hydrol-earth-syst-sci-discuss.net/11/1/2014/ doi:10.5194/hessd-11-1-2014
© Author(s) 2014. CC Attribution 3.0 License.
Hydrology and Earth System
Sciences
Open Access
Discussions
This discussion paper is/has been under review for the journal Hydrology and Earth System Sciences (HESS). Please refer to the corresponding final paper in HESS if available.
E
ff
ects of extreme drought on agriculture
soil and sustainability of di
ff
erent drought
soil
S. M. Geng1,2, D. H. Yan2, T. X. Zhang3, B. S. Weng2, Z. B. Zhang2, and W. Gang2
1
College of Civil and Hydraulic Engineering, Tsinghua University, Beijing, 100084, China
2
State Key Laboratory of Simulation and Regulation of Water Cycle in River Basin, China Institute of Water Resource and Hydropower Research (IWHR), Beijing, 100038, China
3
College of Soil and Water Conservation, Beijing Forestry University, Beijing, 100083, China
Received: 30 November 2013 – Accepted: 12 December 2013 – Published: 2 January 2014
Correspondence to: D. H. Yan (yandh@iwhr.com)
HESSD
11, 1–29, 2014Effects of extreme drought on agriculture soil
S. M. Geng et al.
Title Page
Abstract Introduction
Conclusions References
Tables Figures
◭ ◮
◭ ◮
Back Close
Full Screen / Esc
Printer-friendly Version
Interactive Discussion
Discussion
P
a
per
|
D
iscussion
P
a
per
|
Discussion
P
a
per
|
Discuss
ion
P
a
per
|
Abstract
Content of microbial biomass carbon was selected as indicator for identifying effects of extreme drought on agriculture soil ecosystem. Through a series of prototype ob-servation experiments, changing tendencies of microbial biomass carbon content and the proportion of microbial biomass carbon in soil organic carbon were identified. The 5
optimum mass water content of soil for microbial biomass carbon was 19.5 % and the demarcation point of microbial biomass carbon to drought was 14.3 %, which could be used to demonstrate alters and degradation of soil ecosystem as well as the irriga-tion requirement of crops. We evaluated sustainability of different drought soil ecosys-tems after experiencing rainstorm with rehabilitation. The results suggested that soil 10
ecosystem which was interfered by moderate drought could recover and its tolerance to drought was improved, as well as its function and activity. Soil ecosystem could barely recover from severe drought and could not adapt to severe drought stress. Soil ecosystem could not restore from extreme drought within a few days, the function and structure were damaged. We came to the conclusion that mass water content of soil 15
should kept above 10 % to avoid destroying function and structure while soil ecosystem would better be watered when mass water content was lower than 14.3 % in order to maintain high productivity.
1 Introduction
Drought is a fundamental part and an extreme condition of hydrological cycle process 20
with significant impacts on society and economy, as well as ecological environment. Extreme drought can greatly affect the function (Liu et al., 2010; Balser and Firestone, 2005), structure (Zak et al., 2003) and productivity (Lal et al., 2013) of soil ecosystem. Agriculture ecosystem is so sensitive to drought stress that extreme drought threaten regional food security all over the world. Losses caused by drought are generally mea-25
HESSD
11, 1–29, 2014Effects of extreme drought on agriculture soil
S. M. Geng et al.
Title Page
Abstract Introduction
Conclusions References
Tables Figures
◭ ◮
◭ ◮
Back Close
Full Screen / Esc
Printer-friendly Version
Interactive Discussion
Discussion
P
a
per
|
D
iscussion
P
a
per
|
Discussion
P
a
per
|
Discuss
ion
P
a
per
|
nevertheless studies on the effects of drought on sustainability of soil ecosystem re-mains rare. Selecting indicators to identify the effects of extreme drought on agriculture soil and study the sustainability of soil ecosystem under different drought stress could fill this knowledge gap.
On one hand, microbial biomass carbon, as an important component of soil ecosys-5
tem, responds dramatically to soil environment and climate condition, e.g., growth and reproduction of soil microbial are influenced by global warming, precipitation and rainfall pattern changing. Furthermore, different types of microorganism response dif-ferently to these stress (Zelles, 1999; Houghton et al., 2001; Panikwv, 1999; M. J. Johnson, 2003). Therefore content of microbial biomass carbon is sensitivity indica-10
tor and early warning indicator for soil ecosystem degradation (Nielsen et al., 2002; Kennedy and Smith, 1995; Somova and Pechurkin, 2001). Though microbial biomass carbon generally comprises only 1∼4 % of soil organic carbon, it is a big recharge source and reserve of soil available nutrient (Jenkinson and Powlson, 1981) and has played an important role in maintaining and improving soil structure. The proportion of 15
microbial biomass carbon in soil organic carbon has been an important indicator for soil carbon availability (Insam et al., 1989) and soil ecosystem productivity (Biederbeck et al., 1994), which is a more sensitive indicator than soil organic carbon alone. As a result, content of microbial biomass carbon was selected as indicator to study the effects of drought on agriculture soil. On the other hand, a rainstorm usually followed 20
a drought event, suggesting the relief of drought. Here, we evaluate the sustainability of different drought soil ecosystem after experiencing rainstorm with rehabilitation – if the content of microbial biomass carbon could recovery or not before water content re-duced to the thresholds that could be used to demonstrate destruction of the function and structure in soil ecosystem.
25
HESSD
11, 1–29, 2014Effects of extreme drought on agriculture soil
S. M. Geng et al.
Title Page
Abstract Introduction
Conclusions References
Tables Figures
◭ ◮
◭ ◮
Back Close
Full Screen / Esc
Printer-friendly Version
Interactive Discussion
Discussion
P
a
per
|
D
iscussion
P
a
per
|
Discussion
P
a
per
|
Discuss
ion
P
a
per
|
content of microbial biomass carbon decreased by 39 % (Karen et al., 2003). Since the 21 century, issues on microbial metabolism and microbial adaptability to drought have been studied under the background of frequent, multiple, successively and concurrent occurrence of droughts. Additionally, soil organic carbon/nitrogen declined dramatically with the intensification of drought (Li and Sarah, 2003a, b). However, little research has 5
contented these changes with alters and degradation of soil ecosystem.
In this paper, in order to study effects of extreme drought on soil ecosystem and the rehabilitation of different drought soil ecosystem after rainstorm, we designed a se-ries of prototype observation experiments. Considering effects of drought on microbial might be influenced by vegetation composition (Muhammad et al., 2011), we take soil 10
planted with summer maize for this study. The objectives of the study are: (1) identifying the effects of extreme drought on content of soil microbial biomass carbon and the pro-portion of microbial biomass carbon in soil organic carbon; (2) finding the thresholds of water content that could be used to demonstrate destruction of the function and struc-ture in soil ecosystem; (3) studying the rehabilitation of soil ecosystem after rainstorm 15
under different drought scenarios. The remainder of this paper is organized as follows. Section 2 presents materials and methods for prototype observation experiments. In Sects. 3 and 4, the results of the prototype observation experiments are presented and discussed. Finally, conclusions are provided in Sect. 5.
2 Materials and methods
20
2.1 Site characteristics
Soil samples were collected from Daxing Test Base (116◦25′E and 39◦37′N) located in northern Beijing, in China, which was established by China Institute of Water Re-sources and Hydropower Research. The base lies at 31.3 m a.s.l. and the climate is
temperate. The mean annual temperature is 12.1◦C with a mean temperature of
ap-25
HESSD
11, 1–29, 2014Effects of extreme drought on agriculture soil
S. M. Geng et al.
Title Page
Abstract Introduction
Conclusions References
Tables Figures
◭ ◮
◭ ◮
Back Close
Full Screen / Esc
Printer-friendly Version
Interactive Discussion
Discussion
P
a
per
|
D
iscussion
P
a
per
|
Discussion
P
a
per
|
Discuss
ion
P
a
per
|
and the time of sunshine is about 2600 h. The mean annual precipitation is 540 mm, but more than 80 % distributes in the rain season from June to September while rainfall in spring only accounts for 10 %. Potential evaporation, about 1/3 concentrated from May to June, is 1900 mm, which is much higher than annual precipitation. Relative humidity ranges from 50 to 70 % (Liu et al., 2012).
5
2.2 Soil characteristics
The soil in Test Base was sandy loam. A more detailed description of soils (the physical, chemical and biological properties) of this research site can be found in Table 1.
2.3 Experiment design and layout
Prototype observation experiments were conducted from late June to late September 10
(summer maize growth season) in winter wheat and summer maize rotation system in the year 2011. In order to stimulate extreme drought scenario, rain shelter was es-tablished, which was constructed with stainless steel frame covered on top, and with plastic membrane affixed to all around wall. The rain shelter was opened on fine days for ventilation, and closed on rainy days to prevent rain water entering into rain shelter. 15
Separation waterproof panels were laid 600 mm deep in soil to divide experimental field into three test sections (section A, section B and section C), which was also fixed up between experimental farm and open field to avoid side leakage. To investigate the re-habilitation of different drought soil ecosystem after rainstorm, we considered three test sections responding to three drought scenarios – moderate drought, serious drought 20
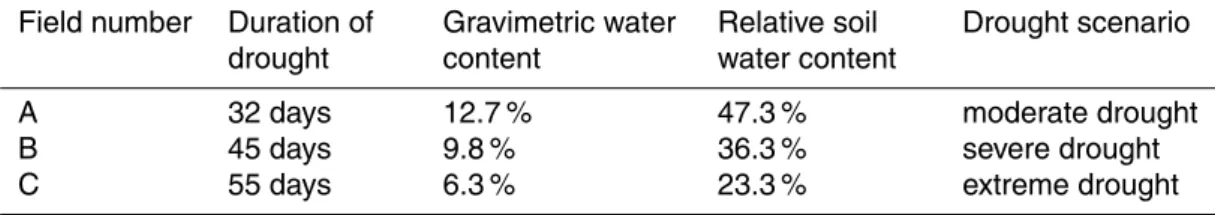
and extreme drought, which were classified with relative soil water content (Tables 2 and 3).
At the beginning of our experiment, mass water content of soil was around 25 % in the three test sections. One pooled sample was collected every one or two days in each test section. When the relative soil water content was 47.3 % and drought severity was 25
HESSD
11, 1–29, 2014Effects of extreme drought on agriculture soil
S. M. Geng et al.
Title Page
Abstract Introduction
Conclusions References
Tables Figures
◭ ◮
◭ ◮
Back Close
Full Screen / Esc
Printer-friendly Version
Interactive Discussion
Discussion
P
a
per
|
D
iscussion
P
a
per
|
Discussion
P
a
per
|
Discuss
ion
P
a
per
|
drought in test section A had lasted for 32 days and the mass water content of soil was 12.7 %.Then rainstorm was simulated in test section A, while drought persisted in test section B and test section C.
Pooled samples were collected every one or two days from test section B and C. When the relative soil water content was 36.3 % and drought severity was severe 5
drought, drought scenario stimulation in test section B was over. At that time, drought in test section B had lasted for 43 days and the mass water content of soil was 9.8 %. Then rainstorm was simulated in test section B, while drought persisted in test section C.
Soil samples were collected every one or two days from test section C. When the rel-10
ative soil water content was 23.3 % and drought severity was extreme drought, drought scenario stimulation in test section C was over. At that time, drought in test section C had lasted for 55 days and the mass water content of soil was 6.3 %.Then rainstorm was stimulated in test section C.
After the end of each drought scenario, the test sections were watered with sprin-15
kling can and the quantity and strength was equal to a rainstorm process. Then the field was naturally dried. When mass water content of soil was adjusted to 21 % (80 % of relative soil water content) around, samples were collected from each test section every four days. Contents of microbial biomass carbon in soils that were watered were compared with contents in soils that were not watered, to know the rehabilitation of 20
different drought soil ecosystem after rainstorm.
2.4 Sampling
All the soil samples were collected at the middle of two maize and about 10 cm far away from the rhizosphere of the maize at Beijing time (The East District Eight) 9 a.m. From the beginning of the experiment to the 32th day, soil samples were collected every one 25
HESSD
11, 1–29, 2014Effects of extreme drought on agriculture soil
S. M. Geng et al.
Title Page
Abstract Introduction
Conclusions References
Tables Figures
◭ ◮
◭ ◮
Back Close
Full Screen / Esc
Printer-friendly Version
Interactive Discussion
Discussion
P
a
per
|
D
iscussion
P
a
per
|
Discussion
P
a
per
|
Discuss
ion
P
a
per
|
test section B and C and then they were mixed to form pooled samples. From the 44th day to the 55th day, soil samples were collected every one or two days at 10∼20 cm soil depth in test section C. During drought stress stage 35 pooled soil samples were collected in all.
After rainstorm stimulation and mass water content was dried to 21 % around in 5
each test, samples were collected at Beijing time (The East District Eight) 9 a.m. at 10∼20 cm soil depth every four days. 20 samples were collected in all.
The surface organic materials and fine roots in pooled samples were removed. The pooled sample was tested for water content and then divided into two parts: one part was stored at room temperature and air dried and used for physical, physicochemi-10
cal and chemical analysis (soil field capacity, contents of organic materials); the other part was kept field-moist at 4◦C and used for biological properties analysis (microbial biomass carbon content).
2.5 Soil sample analyses
Soil water content was measured gravimetrically by weighing, after drying in an oven 15
at 105◦C for about 48 h. Prior to microbial analyses, samples were adjusted to 50 % of maximum water holding capacity and pre-incubated at 22◦C for six days. We applied chloroform fumigation-extraction method (Vance et al., 1987) to estimate soil micro-bial biomass carbon. Briefly, two soil portions were taken. One portion was fumigated at 25◦C for 24 h with ethanol free CHCl3. After fumigant removal, soil sample was
ex-20
tracted with 40ma 0.01M CaCl2by 45 min horizontal shaking at 200 rev/min and then fil-tered through a paper filter. The other portion (non-fumigated one) was extracted at the
time fumigation commenced. Organic carbon (in the extracts) was measured as CO2
at 800◦C by infrared absorption after combustion using a Maihak Tocor 2 automatic analyser. 10 mL of CaCl2extracts was adjusted to a pH of 3.5 with HCl and fed into the
25
carbon analyser. Microbial biomass carbon was calculated as Eq. (1). In Eq. (1),EC
HESSD
11, 1–29, 2014Effects of extreme drought on agriculture soil
S. M. Geng et al.
Title Page
Abstract Introduction
Conclusions References
Tables Figures
◭ ◮
◭ ◮
Back Close
Full Screen / Esc
Printer-friendly Version
Interactive Discussion
Discussion
P
a
per
|
D
iscussion
P
a
per
|
Discussion
P
a
per
|
Discuss
ion
P
a
per
|
was determined using the modified Walkley–Black procedure (Nelson and Sommers, 1982).
Microbial biomass carbon=EC/KC (1)
EC=(organic carbon that extracted from fumigated soil)
−(organic carbon that extracted from non-fumigated soil) (2)
5
2.6 Data analysis
Origin 8.0 was used to investigate physical, physicochemical, chemical and biological data. Gaussian distribution test was used to see if the date has significant difference. Nonlinear exponential regression models between water content and biological prop-10
erties were established to study the relationships between them. Fitting curves were drawn to analysis effects of drought on soil microbial and find the demarcation points that could be used to demonstrate alters and degradation of soil ecosystem.
3 Results
3.1 Effects of extreme drought on soil microbial biomass carbon
15
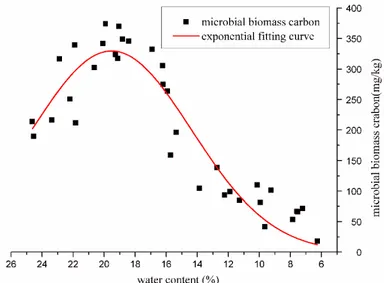
Dynamic of microbial biomass carbon with mass water content of soil during drought stress stage was shown in Fig. 1. Mass water content of soil dried from 25 to 6 % and drought severity developed from not drought to extreme drought. Equation (3) is
nonlinear exponential regression model between soil microbial biomass carbon (B)
and soil water content (W). The fitting curve and regression characteristics are given 20
in Fig. 1 and Table 4. Significant level between microbial biomass carbon and water content was 0.01 (two-side test) andF value of the nonlinear exponential regression model was 360.5, suggesting that the matching effect was preferable.
HESSD
11, 1–29, 2014Effects of extreme drought on agriculture soil
S. M. Geng et al.
Title Page
Abstract Introduction
Conclusions References
Tables Figures
◭ ◮
◭ ◮
Back Close
Full Screen / Esc
Printer-friendly Version
Interactive Discussion
Discussion
P
a
per
|
D
iscussion
P
a
per
|
Discussion
P
a
per
|
Discuss
ion
P
a
per
|
It could be seen from Fig. 1 that changing trend of microbial biomass carbon was divided into two sections, and the demarcation point of water content was about 19.5 %. Should water content be higher or lower than the demarcation point, microbial biomass carbon would decline. Briefly, microbial biomass carbon content increased (from 200 to 400 mg kg−1) with the reduction of water content when soil moisture was higher than 5
the demarcation point, while microbial biomass carbon content declined (from 400 to 25 mg kg−1) with the reduction of water content when soil moisture was lower than the demarcation point, which indicated that 19.5 % was the optimum water content for microbial biomass carbon in our experimental soil ecosystem.
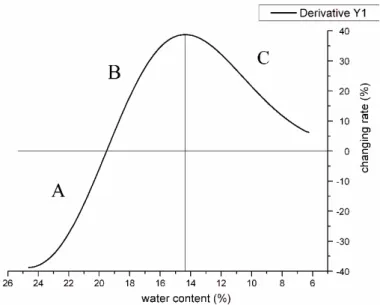
Changing rate curve of microbial biomass carbon along with mass soil water content 10
was shown in Fig. 2. The changing rate curve was obtained by differentiating the fitting curve in Fig. 1. We can see that the changing rate curve was divided into three sections (section A, B and C) by two demarcation points, which were 19.5 and 14.3 % for water content, respectively. The demarcation point of 19.5 % was the position that increase or decrease of microbial biomass carbon, while the demarcation point of 14.3 % was the 15
position of faster or slower of the decrease rate. In section A microbial biomass con-tent increased with the reduction of water concon-tent, which partly attributed to the limit of soil microorganism activity when water content was higher than 19.5 %. In section B decrease rate of microbial biomass carbon became faster and faster with the devel-opment of drought. In section C decrease rate of microbial biomass carbon became 20
slower and slower as drought stress got more and more serious. In addition, with the development of extreme drought, the change rate of microbial biomass carbon tended to zero.
3.2 Drought effects on proportion of microbial biomass carbon in soil organic carbon
25
Figure 3 gave dynamic of the proportion of microbial biomass carbon in soil organic carbon during the whole drought stage. It was obvious that microbial biomass carbon
HESSD
11, 1–29, 2014Effects of extreme drought on agriculture soil
S. M. Geng et al.
Title Page
Abstract Introduction
Conclusions References
Tables Figures
◭ ◮
◭ ◮
Back Close
Full Screen / Esc
Printer-friendly Version
Interactive Discussion
Discussion
P
a
per
|
D
iscussion
P
a
per
|
Discussion
P
a
per
|
Discuss
ion
P
a
per
|
tendency of proportion of microbial biomass carbon in soil organic carbon was sim-ilar with the changing trend of microbial biomass carbon along water content. When water soil moisture was higher than the demarcation point, the proportion of microbial biomass carbon increased from 1.5 to 3.9 % with reduction of water content. However, when soil moisture was lower than the demarcation point, the proportion decreased 5
from 3.9 to 1.0 % with the reduction of water content. On the other hand, the demarca-tion point of increase or decrease of the propordemarca-tion was about 20.5 % for water content, which was 1 % higher than the demarcation point of microbial biomass carbon chang-ing along with water content (19.5 %).
3.3 Rehabilitation of different drought soil ecosystem after rainstorm
10
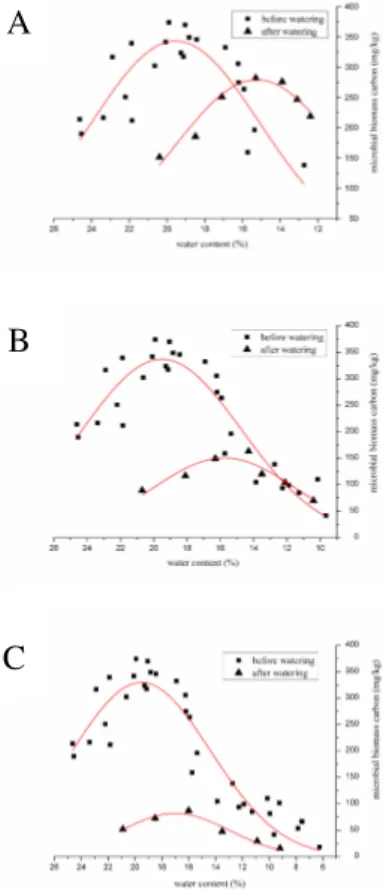
The rehabilitation of soil microbial biomass carbon under moderate drought scenario after rainstorm stimulation was shown in Fig. 4a.We could see that microbial biomass carbon recovered at about 16 % of mass water content, which was before water content reduced to 14.3 %. At this time relative water content was 60 % and soil ecosystem was not stressed by drought. On one hand, content of microbial biomass carbon in watered 15
soil was even more than it was before rehydration at the same water content when water content was lower than 16 %. On the other hand, when water content was lower than 16 %, content of microbial biomass carbon increased before it decreased and water content was 15 % at the point that microbial biomass carbon was the most. What more, when soil water was dried to 12 %, the content of microbial biomass carbon was 20
as much as it was at the 15 % of water content in the soil that was not watered.
The rehabilitation of soil microbial biomass carbon under severe drought scenario after rainstorm stimulation was shown in Fig. 4b. The results showed that content of microbial biomass carbon increased gradually and barely recovered until soil water content reduced to 14 % around. When water content was lower than that point, content 25
HESSD
11, 1–29, 2014Effects of extreme drought on agriculture soil
S. M. Geng et al.
Title Page
Abstract Introduction
Conclusions References
Tables Figures
◭ ◮
◭ ◮
Back Close
Full Screen / Esc
Printer-friendly Version
Interactive Discussion
Discussion
P
a
per
|
D
iscussion
P
a
per
|
Discussion
P
a
per
|
Discuss
ion
P
a
per
|
The habilitation of soil microbial biomass carbon under extreme drought after rain-storm stimulation was shown in Fig. 4c, suggesting that soil microorganism could not recover within a short time under extreme drought stress and concentration of microbial biomass carbon kept at a low level (less than 100 mg kg−1).
Figure 5 showed concentrations of soil microbial biomass carbon under different 5
drought scenarios after rainstorm stimulation. After rehydration, microbial biomass car-bon was higher in moderate drought stressed soil than it was in severe drought stressed soil, which was higher than it was in extreme drought stressed soil, at the same soil water content. What more, with the development of drought stress, changing rate of microbial biomass carbon reduced after the rain. The continuing negative impacts of 10
drought stress present additional challenges to soil ecosystem rehabilitation. The re-sults showed that the recoverability of soil microbial biomass carbon and soil ecosys-tem was different with different drought scenario.
4 Discussion
4.1 Response of microbial biomass carbon to extreme drought stress
15
In section B of Fig. 3, decrease rate of microbial biomass carbon became faster and faster with the development of drought, which was attributed to massive death of drought sensitive microorganisms, especially some bacterial. It had evidenced that soil microbial activity and community structure could be seriously damaged by drought and microorganisms that could not adapt to drought stress would disappear under the ad-20
verse condition (Van Meeteren et al., 2008; Hueso et al., 2012). It has been considered that dry fields have a highly heterogeneous distribution of nutrients and soil nutrient availability may affect biomass and activity of soil microbial (Housman et al., 2007). Therefore, the results might attribute to reduced diffusion of soluble nutrient and re-duced microbial mobility and consequent access to nutrient (Van Meeteren et al., 2008; 25
HESSD
11, 1–29, 2014Effects of extreme drought on agriculture soil
S. M. Geng et al.
Title Page
Abstract Introduction
Conclusions References
Tables Figures
◭ ◮
◭ ◮
Back Close
Full Screen / Esc
Printer-friendly Version
Interactive Discussion
Discussion
P
a
per
|
D
iscussion
P
a
per
|
Discussion
P
a
per
|
Discuss
ion
P
a
per
|
microbial biomass and retardation of activity. Drought influence soluble salt concentra-tions and there was a significant negative relaconcentra-tionship between sodicity and microbial biomass (Rietz and Haynes, 2003; Yuan et al., 2007; Singh et al., 2013). Rietz 2003) and Tejada et al. (2006) pointed that effect of sodicity was enzyme specific, which sug-gested that adverse effect of sodicity was more pronounced over β-glucosidase and 5
dehydrogenase than phosphatase. Besides, disruption of tertiary protein structure and salting out effect might take place and slow down enzyme activities (Rietz and Haynes, 2003; Tejada et al., 2006). As a consequence, microbial biomass reduced and activity retarded.
In section C decrease rate of microbial biomass carbon became slower and slower 10
with development of drought. There were two possible reasons: (1) some drought toler-ant soil microorganisms had already adapted to drought stress and its ratio in the whole microorganism had increased, which might attribute to C/N variation of microbe. It has been proved that response to drought by microbial biomass C differed from microbial biomass N: decline of microbial biomass N was more significant, resulting in rise of 15
C/N (Karen et al., 2003). Besides, higher C/N was in favor of fungi growth (Paul and Clark, 1996) and fungi were much more tolerance to drought. With the intensification of drought stress, soil fungi/bacteria ratio rose (Fu Honglin et al., 2009) with the in-crease of C/N. As a result reduction rate of microbial biomass carbon was slower. (2) There was such a low base of microbial biomass carbon (about 50 mg kg−1) that the 20
reproductive rate was slow and amplitude of variation was small.
4.2 Hysteresis of response of proportion of microbial biomass carbon in soil organic carbon to drought stress
Microorganism and soil organic carbon, especially water soluble organic carbon, in-teracted in soil ecosystem. Microbial biomass carbon was an important source of soil 25
HESSD
11, 1–29, 2014Effects of extreme drought on agriculture soil
S. M. Geng et al.
Title Page
Abstract Introduction
Conclusions References
Tables Figures
◭ ◮
◭ ◮
Back Close
Full Screen / Esc
Printer-friendly Version
Interactive Discussion
Discussion
P
a
per
|
D
iscussion
P
a
per
|
Discussion
P
a
per
|
Discuss
ion
P
a
per
|
2006). Figures 1 and 3 showed that changing tend of proportion of microbial biomass carbon in soil organic carbon lag behind microbial biomass carbon changes along with drought stress, suggesting that microbial biomass carbon responded faster than the proportion of microbial biomass carbon in soil organic carbon to drought stress. On one hand, labile soil organic carbon was closely associated with root productivity (Ros 5
et al., 2009; Rui et al., 2011). In this research when water content reduced to 20.5 %, it was just the time that vegetative growth of above ground plant was vigorous. At the same time root productivity and belowground root biomass increased, resulting in an increase of soil organic carbon. However, microbial biomass carbon had not increased as much as soil organic carbon, so proportion of microbial biomass carbon in soil or-10
ganic carbon decreased. On the other hand, it had been indicated that, as a response to drought, some soil bacteria are able to synthesize exopolysaccharidesas (Kohler et al., 2009), resulting in soil organic carbon increase. From the above results, it ob-tained that change of microbial biomass carbon proportion in soil organic carbon lag behind that of microbial biomass carbon under drought stress.
15
4.3 Rehabilitation of soil ecosystem under different dry-wet scenarios
From Fig. 4 we can see that rehabilitation of soil ecosystem was positive in moderate and severe drought soil ecosystem and negative in extreme drought soil ecosystem. The results in Fig. 4a showed that soil microbial biomass carbon interfered by moderate drought and then experienced rainstorm could recover before water content reduced to 20
14.3 %, suggesting that soil ecosystem could recover under this drought-wet scenario. When water content was lower than 16 %, content of microbial biomass was higher than it was before rehydration at the same water content. We can come to the conclusion that some drought tolerant microorganism had already adapted to this drought stress, their tolerance to drought and ratio in all soil microorganisms were both improved. Con-25
HESSD
11, 1–29, 2014Effects of extreme drought on agriculture soil
S. M. Geng et al.
Title Page
Abstract Introduction
Conclusions References
Tables Figures
◭ ◮
◭ ◮
Back Close
Full Screen / Esc
Printer-friendly Version
Interactive Discussion
Discussion
P
a
per
|
D
iscussion
P
a
per
|
Discussion
P
a
per
|
Discuss
ion
P
a
per
|
and activity might be improved also. Results in Fig. 4b showed that content of microbial biomass carbon could barely recovered, suggesting that soil ecosystem influenced by severe drought was at the edge of rehabilitation. The ecosystem could not adapt to the severe drought stress and its tolerance to drought stress was not improved. Results in Fig. 4c showed that content of microbial biomass carbon could not recover within 5
the experimental time, which indicated that soil ecosystem that stressed by extreme drought could not restore within a short time. The eco-hydrological processes were in-terrupted and ecosystem function and structure were damaged and could not recover thought they had experienced a rainstorm. It has been proved that, when water con-tent was less than a certain value, rewetting could lead to microbial stress because its 10
tolerance rapid changes in microorganism osmotic potential, resulting in cell lysis (Van Gestel et al., 1992). As a consequence, microbial biomass carbon went on declining and could not give better resistance to drought. What more, microbial rehabilitation was different in different types of ecosystem and soil terms (David et al., 2013; Chaer et al., 2009; Lacombe et al., 2009; Mader et al., 2002; Van Overbeck et al., 1995).
15
4.4 An indicator of irrigating – dynamics and demarcation points of microbial biomass carbon along with mass water content of soil
When water content was lower than 14.3 %, microorganism reproduction and substrate utilization in soil was influenced, as well as decomposition of plant and animal residues (Johnson et al., 2003), nutrient cycling (Balser and Firestone, 2005), soil fertility main-20
taining and formation of soil aggregates (Gillerke, 1997), which resulted in function and structure weaken in soil ecosystem. On the contrary, high concentration of mi-crobial biomass carbon was characteristic of a sustainable ecosystem. Therefore, the changing tendency and demarcation point of soil microbial biomass carbon along with mass water content of soil could be used to demonstrate alters and degradation of soil 25
ecosystem as well as the irrigation requirement of crops.
HESSD
11, 1–29, 2014Effects of extreme drought on agriculture soil
S. M. Geng et al.
Title Page
Abstract Introduction
Conclusions References
Tables Figures
◭ ◮
◭ ◮
Back Close
Full Screen / Esc
Printer-friendly Version
Interactive Discussion
Discussion
P
a
per
|
D
iscussion
P
a
per
|
Discussion
P
a
per
|
Discuss
ion
P
a
per
|
threshold for irrigation was about 14.9 % due to that theory. That value was in good agreement with 14.3 % – the demarcation point of faster or slower of decrease rate of microbial biomass carbon (Fig. 2) and the weakened point of function and structure in soil ecosystem. So we come to the conclusion that soil mass water content should be higher than 14.3 % in order to maintain high productivity of soil ecosystem. Besides, 5
according to research in Sect. 3.3, the soil ecosystem must be irrigated if mass water content was lower than 10 % (drought in corn field had persisted for about 45 days), or else the soil ecosystem would not recover with a few days and the sustainability and productivity would be destroyed.
5 Conclusions
10
From prototype observation experiments and these results of the research, we could obtain that agriculture soil ecosystem was significantly influenced by extreme drought stress. Content of microbial biomass carbon increased with the reduction of water con-tent when soil moisture was higher than 19.5 %, while the concon-tent declined with the reduction of water content when soil moisture was lower than 19.5 %, which indicated 15
that 19.5 % was the optimum water content for microbial biomass carbon in sampled soil ecosystem. Decrease rate of microbial biomass carbon became faster and faster as water content decline from 19.5 to 14.3 % while it became slower and slower as wa-ter content was lower than 14.3 %, which was attributed to microbial structure changes in soil ecosystem. The changing tendency and demarcation point (in this research 20
was 14.3 %) of soil microbial biomass carbon could be used to demonstrate alters and degradation of soil ecosystem as well as the irrigation requirement of crops. The changing tendency of proportion of microbial biomass carbon in soil organic carbon was similar but leg behind the changing trend of microbial biomass carbon along with water content. Hysteresis of response of the proportion to drought stress mainly at-25
HESSD
11, 1–29, 2014Effects of extreme drought on agriculture soil
S. M. Geng et al.
Title Page
Abstract Introduction
Conclusions References
Tables Figures
◭ ◮
◭ ◮
Back Close
Full Screen / Esc
Printer-friendly Version
Interactive Discussion
Discussion
P
a
per
|
D
iscussion
P
a
per
|
Discussion
P
a
per
|
Discuss
ion
P
a
per
|
In addition, the continuing negative impacts of drought stress present additional chal-lenges to soil ecosystem sustainability. Rehabilitation of microbial biomass carbon after rainstorm under different drought scenarios were as follow: soil ecosystem which was interfered by moderate drought could recover after rainstorm and was well tolerated to moderate drought stress, its function and activity might be improved also. Severe 5
drought soil ecosystem could barely recover and could not adapt to severe drought stress. Extreme drought soil ecosystem could not restore within a few days, the function and structure were damaged. So mass water content of soil should kept above 10 % to avoid destroying function and structure while soil ecosystem should be watered when mass water content was lower than 14.3 % in order to maintain high productivity. 10
Because of high degrees of variability in water availability (Fierer and Schimel, 2003; Alwyn et al., 2005), adaption of soil ecosystem that had experienced long term water stress to drought stress should be researched in further.
Acknowledgements. We are grateful to the State Key Development Program for Basic Re-search of China (Grant No. 2010CB951102), and the General Program of the National Natural 15
Science Foundation of China (Grant No. 51279207) for supporting the research. In addition, we thank China Institute of Water Resources and Hydropower Research which established Daxing Test Base, for providing experiment place.
References
Balser, T. C. and Firestone, M. K.: Linking microbial community composition and soil processes 20
in a California annual grassland and mixed-conifer forest, Biogeochemistry, 73, 395–415, 2005.
Bastida, F., Moreno, J. L., Hernández, T., and García, C.: Microbiological activity in a soil 15 years after its devegetation, Soil Biol. Biochem., 38, 2503–2507, 2006.
Biederbeck, V. O., Janzen, H. H., and Campbell, C. A.: Labile soil organic matter as influenced 25
HESSD
11, 1–29, 2014Effects of extreme drought on agriculture soil
S. M. Geng et al.
Title Page
Abstract Introduction
Conclusions References
Tables Figures
◭ ◮
◭ ◮
Back Close
Full Screen / Esc
Printer-friendly Version
Interactive Discussion
Discussion
P
a
per
|
D
iscussion
P
a
per
|
Discussion
P
a
per
|
Discuss
ion
P
a
per
|
Chaer, G., Fernandes, M., and Myrold, D.: Comparative resistance and resilience of soil mi-crobial communities and enzyme activities in adjacent native forest and agricultural soils, Microb. Ecol., 58, 414–424, 2009.
Christ, M. J. and David, M. B.: Temperature and moisture effects the production of dissolved organic carbon in a podosol, Soil Biol. Biochem., 28, 1191–1199, 1996.
5
Cong, Z. T., Yao, B. Z., and Ni, G. H.: Water demand forecasting for major crops in China under SRA1B scenario, Adv. Water Sci., 22, 38–43, 2011.
David, R., Miren, L., and Alain, O.: Soil biochemical properties and microbial resilience in agro-forestry systems: effects on wheat growth under controlled drought and flooding conditions, Sci. Total. Environ., 463–464, 51–60, 2013.
10
Drenovsky, R. E., Vo, D., and Graham, K. J.: Soil water content and organic carbon availability are major determinants of soil microbial community composition, Microb. Ecol., 48, 424–430, 2004.
Fierer, N. and Schimel, J. P.: A proposed mechanism for the pulse in carbon dioxide production commonly observed following the rapid rewetting of a dry soil, Soil Sci. Soc. Am. J., 67, 15
798–805, 2003.
Fu, H. L., Wang, S. R., and Han, S. J.: Effects of alternate wet and dry conditions on microbial activity and flora in broad leaved Pinus koraiensis of Changbai Mountain, J. Northeast Forest. Univ., 37, 80–86, 2009.
Gestel, M. V., Ladd, J. N., and Amato, M.: Microbial biomass responses to seasonal change 20
and imposed drying regimes at increasing depths of undisturbed topsoil profiles, Soil Biol. Biochem., 24, 103–111, 1992.
Giller, K. E., Beare, M. H., and Lavell, E. P.: Agricultural intensification soil biodiversity and agro-ecosystem function, Appl. Soil Ecol., 6, 3–16, 1997.
Houghton, J. T., Ding, Y., and Griggs, D. J.: Climate change, The Scientific Basis, Cambridge 25
University Press, New York, 881 pp., 2001.
Housman, D. C., Yeager, C. M., and Darby, B. J.: Heterogeneity of soil nutrients and subsurface biota in a dry land ecosystem, Soil Biol. Biochem., 39, 2138–2149, 2007.
Hueso, S., Garcia, C., and Hernandez, T.: Severe drought conditions modify the microbial com-munity structure, size and activity in amended and un-amended soils, Soil Biol. Biochem., 30
50, 167–173, 2012.
HESSD
11, 1–29, 2014Effects of extreme drought on agriculture soil
S. M. Geng et al.
Title Page
Abstract Introduction
Conclusions References
Tables Figures
◭ ◮
◭ ◮
Back Close
Full Screen / Esc
Printer-friendly Version
Interactive Discussion
Discussion
P
a
per
|
D
iscussion
P
a
per
|
Discussion
P
a
per
|
Discuss
ion
P
a
per
|
Jenkinson, D. S. and Powlson, D. S.: Microbial biomass in soil: measurement and turnover, Soil Biochem., 5, 415–471, 1981
Jensen, K. D. and Beier, C.: Effects of experimental drought on microbial processes in two temperate heathlands at contrasting water conditions, Appl. Soil Ecol., 24, 165–176, 2003. Joergensen, R. G.: The fumigation-extraction method to estimate soil microbial biomass: ex-5
traction with 0.01 M CaCl2, Agro-Biol. Res., 48, 319–324, 1995.
Johnson, D., Booth, R. E., and Ehiteley, A. S.: Plant community composition affects the biomass, activity and diversity of microorganisms in limestone grassland soil, Eur. J. Soil Sci., 54, 671–677, 2003.
Johnson, M. J., Lee, K. Y., and Scow, K. M.: DNA fingerprinting reveals links among agricultural 10
crops, soil properties, and the composition of soil microbial communities, Geoderma, 114, 279–303, 2003.
Joshua, P. S., Jay, M. G., and Joy, S. C. C.: Moisture effects on microbial activity and community structure in decomposing birch litter in the Alaskan taiga, Soil Biol. Biochemical., 31, 831– 838, 1999.
15
Kennedy, A. C. and Smith, K. L.: Soil microbial diversity and the sustainability of agricultural soils, Plant Soil, 170, 75–86, 1995.
Kohler, J., Caravaca, F., and Roldán, A.: Effect of drought on the stability of rhizosphere soil aggregates of Lactuca sativa grown in a degraded soil inoculated with PGPR and AM fungi, Appl. Soil Ecol., 42, 160–165, 2009.
20
Kong, B., Sun, B., and Zheng, X. Q.: Effects of hydrothermal conditions and fertilization on microbial metabolic characteristic of microbial community in black soil, Acta Pedol. Sin., 46, 100–106, 2009.
Lacombe, S., Bradley, R. L., and Hamel, C.: Do tree-based intercropping systems increase the diversity and stability of soil microbial communities, Agr. Ecosyst. Environ., 31, 25–31, 2009. 25
Lal, S., Bagdi, D. L., Kakralya, B. L., Jat, M. L., and Sharma, P. C.: Role of brassinolide in alleviating the adverse effect of drought stress on physiology, growth and yield of green gram (vigna radiatal.) genotypes, Legume Res., 36, 359–363, 2013.
Li, X. Z. and Sarah, P.: Arylsulfatase activity of soil microbial biomass along a Mediterranean arid transport, Soil Biol. Biochem., 35, 925–934, 2003a.
30
HESSD
11, 1–29, 2014Effects of extreme drought on agriculture soil
S. M. Geng et al.
Title Page
Abstract Introduction
Conclusions References
Tables Figures
◭ ◮
◭ ◮
Back Close
Full Screen / Esc
Printer-friendly Version
Interactive Discussion
Discussion
P
a
per
|
D
iscussion
P
a
per
|
Discussion
P
a
per
|
Discuss
ion
P
a
per
|
Liu, G. S., Xu, D., and Liu, Y.: Influence of spatial scale variation on ET temporal up scaling methods, J. Hydraul. Eng., 43, 999–1003, 2012.
Liu, X. Y. and Lin, E. D.: Effects of climate change on water demand of major crops in North China, J. Hydraul. Eng., 2, 77–84, 2004.
Liu, Y. Y., Yao, H. Y., and Huang, C. Y.: Influence of soil moisture regime on microbial community 5
diversity and activity in a paddy soil, Acta Pedol. Sin., 43, 828–834, 2006.
Liu, Z. F., Fu, B. J., and Zheng, X. X.: Plant biomass, soil water content and soil N : P ratio regulating soil microbial functional diversity in a temperate steppe: a regional scale study, Soil Biol. Biochem., 42, 445–450, 2010.
Mäder, P., Fliessbach, A., and Dubois, D.: Soil fertility and biodiversity in organic farming, Sci-10
ence, 296, 1694–1697, 2002.
Muhammad, S., Evgenia, B., and Abad, C.: Drought effects on microbial biomass and enzyme activities in the rhizosphere of grasses depend on plant community composition, Appl. Soil Ecol., 48, 38–44, 2011.
Nielsen, N. M., Winding, A., and Binnerup, S.: Microorganisms as indicators of soil health Min-15
istry of the Environment, National Environmental Research Institute, Aarhus, 15–16, 2002. Panikwv, N. S.: Understanding and prediction of soil microbial community dynamics under
global change, Appl. Soil Ecol., 11, 161–176, 1999.
Paul, E. A. and Clark, F. E.: Soil Microbiology and Biochemistry, Academic Press, San Diego, 245–264, 1996.
20
Rattan, L.: Food security in a changing climate, Ecohydrol. Hydrobiol., 13, 8–21, 2013.
Rietz, D. N. and Haynes, R. J.: Effects of irrigation induced salinity and sodicity on soil microbial activity, Soil Biol. Biochem., 35, 845–854, 2003.
Singh, K., Singh, B., and Singh, R R.: Effect of land rehabilitation on physicochemical and microbial properties of a sodic soil, Catena, 109, 49–57, 2013.
25
SL 424-2008: Standard of classification for drought severity [S], China’s Water Conservancy and Hydropower Press, Beijing, 2009.
Somova, L. A. and Pechurkin, N. S.: Functional, regulatory and indicator features of microor-ganisms in manmade ecosystems, Adv. Space Res., 27, 1563–1570, 2001.
Sowerby, A., Bridget, E., and Claus, B.: Microbial community changes in health and soil com-30
HESSD
11, 1–29, 2014Effects of extreme drought on agriculture soil
S. M. Geng et al.
Title Page
Abstract Introduction
Conclusions References
Tables Figures
◭ ◮
◭ ◮
Back Close
Full Screen / Esc
Printer-friendly Version
Interactive Discussion
Discussion
P
a
per
|
D
iscussion
P
a
per
|
Discussion
P
a
per
|
Discuss
ion
P
a
per
|
Tejada, M., García, C., Gonzalez, J. L., and Hernandez, M. T.: Use of organic amendmen-tas a strategy for saline soil remediation: influence on the physical, chemical and biological properties of soil, Soil Biol. Biochem., 38, 1413–1421, 2006.
Van, M. J. M., Tietema, A., and Van, L. E. E.: Microbial dynamics and litter decomposition under a changed climate in a Dutch health land, Appl. Soil Ecol., 38, 119–127, 2008.
5
Wang, L. C., Tamai, R., and Nagata, M.: Effects of water and salty to activity of soil microbial, Reclaim. Rice Cultiv., 3, 40–42, 1998.
Wilkinson, S. C., Anderson, J. M., and Scardelis, S. P.: PLFA profiles of microbial communities in decomposing conifer litters subject to moisture stress, Soil Biol. Biochemical, 34, 189–200, 2002.
10
Wu, J. S., Lin, Q. M., and Huang, Q. Y.: Methods and Applications of Soil Microbial Detection, Meteorological Press, Beijing, China, 54–57, 2006.
Yao, H. Y. and Huang, C. Y.: Soil Microbial Ecology and its Experimental Techniques, Science Press, Beijing, 139–140, 2006.
Yuan, B. C., Li, Z. Z., Liu, H., Gao, M., and Zhang, Y. Y.: Microbial biomass and activity in salt 15
affected soils under arid conditions, Appl. Soil Ecol., 35, 319–328, 2007.
Zak, D. R., Holmes, W. E., and White, D. C.: Plant diversity, microbial communities, and ecosys-tem function: are there any links, Ecology, 84, 2042–2050, 2003.
Zelles, L.: Fatty acid patterns of phospholipids and lipopolysaccharides in the characterization of microbial communities in soil: a review, Biol. Fert. Soils, 29, 111–129, 1999.
HESSD
11, 1–29, 2014Effects of extreme drought on agriculture soil
S. M. Geng et al.
Title Page
Abstract Introduction
Conclusions References
Tables Figures
◭ ◮
◭ ◮
Back Close
Full Screen / Esc
Printer-friendly Version
Interactive Discussion
Discussion
P
a
per
|
D
iscussion
P
a
per
|
Discussion
P
a
per
|
Discuss
ion
P
a
per
|
Table 1.Soil physical, chemical and biological properties.
Soil parameters Value Units
pH 7.8 –
organic matte 20∼153 %
total nitrogen 0.075 %
available nitrogen 0.121 mg kg−1
total phosphorus 1.912 %
available phosphorus 38.04 mg kg−1
total potassium 58.41 %
available potassium 134.62 mg kg−1 microbial carbon 18.2∼373.9 mg kg−1 microbial nitrogen 49.45 mg kg−1
unit weight of soil 2.78 g cm−3
clay 12.83 %
silt 28.92 %
sand 58.25 %
HESSD
11, 1–29, 2014Effects of extreme drought on agriculture soil
S. M. Geng et al.
Title Page
Abstract Introduction
Conclusions References
Tables Figures
◭ ◮
◭ ◮
Back Close
Full Screen / Esc
Printer-friendly Version
Interactive Discussion
Discussion
P
a
per
|
D
iscussion
P
a
per
|
Discussion
P
a
per
|
Discuss
ion
P
a
per
|
Table 2.Standard of classification for drought severity.
Drought severity Relative soil water content
HESSD
11, 1–29, 2014Effects of extreme drought on agriculture soil
S. M. Geng et al.
Title Page
Abstract Introduction
Conclusions References
Tables Figures
◭ ◮
◭ ◮
Back Close
Full Screen / Esc
Printer-friendly Version
Interactive Discussion
Discussion
P
a
per
|
D
iscussion
P
a
per
|
Discussion
P
a
per
|
Discuss
ion
P
a
per
|
Table 3.Drought scenario in each test sections.
Field number Duration of drought
Gravimetric water content
Relative soil water content
Drought scenario
A 32 days 12.7 % 47.3 % moderate drought
B 45 days 9.8 % 36.3 % severe drought
HESSD
11, 1–29, 2014Effects of extreme drought on agriculture soil
S. M. Geng et al.
Title Page
Abstract Introduction
Conclusions References
Tables Figures
◭ ◮
◭ ◮
Back Close
Full Screen / Esc
Printer-friendly Version
Interactive Discussion
Discussion
P
a
per
|
D
iscussion
P
a
per
|
Discussion
P
a
per
|
Discuss
ion
P
a
per
|
Table 4. Characteristics of regression model between microbial biomass carbon and mass water content.
Regression equation a b c Value Standard
error
Value Standard error
Value Standard error
AdjustR2
HESSD
11, 1–29, 2014Effects of extreme drought on agriculture soil
S. M. Geng et al.
Title Page
Abstract Introduction
Conclusions References
Tables Figures
◭ ◮
◭ ◮
Back Close
Full Screen / Esc
Printer-friendly Version
Interactive Discussion
Discussion
P
a
per
|
D
iscussion
P
a
per
|
Discussion
P
a
per
|
Discuss
ion
P
a
per
|
(■ is
Fig. 1.Dynamics and fitting curve of microbial biomass carbon along with mass water content of soil (is measured data of soil microbial biomass carbon and correspond mass water content;
red curve is the fitting curve).
HESSD
11, 1–29, 2014Effects of extreme drought on agriculture soil
S. M. Geng et al.
Title Page
Abstract Introduction
Conclusions References
Tables Figures
◭ ◮
◭ ◮
Back Close
Full Screen / Esc
Printer-friendly Version
Interactive Discussion
Discussion
P
a
per
|
D
iscussion
P
a
per
|
Discussion
P
a
per
|
Discuss
ion
P
a
per
|
(■ is
HESSD
11, 1–29, 2014Effects of extreme drought on agriculture soil
S. M. Geng et al.
Title Page
Abstract Introduction
Conclusions References
Tables Figures
◭ ◮
◭ ◮
Back Close
Full Screen / Esc
Printer-friendly Version
Interactive Discussion
Discussion
P
a
per
|
D
iscussion
P
a
per
|
Discussion
P
a
per
|
Discuss
ion
P
a
per
|
(■ is measured data of proportion of microbial biomass carbon in soil organic carbon correspond to
Fig. 3.Dynamics of proportion of microbial biomass carbon in soil organic carbon along with mass water content ( is measured data of proportion of microbial biomass carbon in soil
HESSD
11, 1–29, 2014Effects of extreme drought on agriculture soil
S. M. Geng et al.
Title Page
Abstract Introduction
Conclusions References
Tables Figures
◭ ◮
◭ ◮
Back Close
Full Screen / Esc
Printer-friendly Version
Interactive Discussion
Discussion
P
a
per
|
D
iscussion
P
a
per
|
Discussion
P
a
per
|
Discuss
ion
P
a
per
|
; ■ is measured data of microbial biomass water content before rehydration under drought scenarios; ▲ is measured
A
B
C
HESSD
11, 1–29, 2014Effects of extreme drought on agriculture soil
S. M. Geng et al.
Title Page
Abstract Introduction
Conclusions References
Tables Figures
◭ ◮
◭ ◮
Back Close
Full Screen / Esc
Printer-friendly Version
Interactive Discussion
Discussion
P
a
per
|
D
iscussion
P
a
per
|
Discussion
P
a
per
|
Discuss
ion
P
a
per
|
moderate drought scenario (■), severe drought scenario (●) and extreme drought scenario (▲)
β
Fig. 5.Comparison of rehabilitation of microbial biomass carbon content after rainstorm stimu-lation under moderate drought scenario (), severe drought scenario (•) and extreme drought scenario (N).