and Women 20–90 Years
Henrik Loe1,2, Øivind Rognmo1, Bengt Saltin3, Ulrik Wisløff1*
1K.G. Jebsen Center of Exercise in Medicine at Department of Circulation and Medical Imaging, NTNU, Trondheim, Norway, 2Valnesfjord Rehabilitation Center, Valnesfjord, Norway,3Copenhagen Muscle Research Centre, University Hospital, Copenhagen, Denmark
Abstract
Purpose:To provide a large reference material on aerobic fitness and exercise physiology data in a healthy population of Norwegian men and women aged 20–90 years.
Methods:Maximal and sub maximal levels of VO2, heart rate, oxygen pulse, and rating of perceived exertion (Borg scale: 6– 20) were measured in 1929 men and 1881 women during treadmill running.
Results:The highest VO2maxand maximal heart rate among men and women were observed in the youngest age group (20–29 years) and was 54.468.4 mL?kg21
?min21 and 43.0
67.7 mL?kg21
?min21 (sex differences, p
,0.001) and 196610 beats?min21and 194
69 beats?min21(sex differences, p
,0.05), respectively, with a subsequent reduction of approximately 3.5 mL?kg21
?min21and 6 beats
?min21per decade. The highest oxygen pulses were observed in the 3 youngest age groups (20–29 years, 30–39 years, 40–49 years) among men and women; 22.3 mL?beat21
63.6 and 14.7 mL?beat21
62.7 (sex differences, p,0.001), respectively, with no significant difference between these age groups. After the age of 50 we observed an 8% reduction per decade among both sexes. Borg scores appear to give a good estimate of the relative exercise intensity, although observing a slightly different relationship than reported in previous reference material from small populations.
Conclusion:This is the largest European reference material of objectively measured parameters of aerobic fitness and exercise-physiology in healthy men and women aged 20–90 years, forming the basis for an easily accessible, valid and understandable tool for improved training prescription in healthy men and women.
Citation:Loe H, Rognmo Ø, Saltin B, Wisløff U (2013) Aerobic Capacity Reference Data in 3816 Healthy Men and Women 20–90 Years. PLoS ONE 8(5): e64319. doi:10.1371/journal.pone.0064319
Editor:Alejandro Lucia, Universidad Europea de Madrid, Spain
ReceivedFebruary 27, 2013;AcceptedApril 10, 2013;PublishedMay 15, 2013
Copyright:ß2013 Loe et al. This is an open-access article distributed under the terms of the Creative Commons Attribution License, which permits unrestricted use, distribution, and reproduction in any medium, provided the original author and source are credited.
Funding:This study was funded by K.G. Jebsen Foundation, The Norwegian Council on Cardiovascular Disease, The Research Council of Norway (funding for Outstanding Young Investigators (UW) and scholarship (HL)), Foundation for Cardiovascular Research at St. Olav’s Hospital, Norwegian State Railways, Roche Norway Incorporated and Valnesfjord Rehabilitation Center. There are no disclosures to report or any conflicts of interest. The funders had no role in study design, data collection and analysis, decision to publish, or preparation of the manuscript.
Competing Interests:The authors are declaring a commercial funder, Roche Norway Incorporated. This does not alter the authors’ adherence to all the PLOS ONE policies on sharing data and materials.
* E-mail: [email protected]
Introduction
Evidence supports a strong inverse association between cardio-respiratory fitness and all-cause mortality [1–4]. Therefore, in order to increase the individual’s fitness level, different types of exercise training are used both in prevention and treatment of cardiovascular and life-style related disease [5]. In order to prescribe a proper prevention- or treatment program either, the more reliable, individually cardiopulmonary exercise testing is needed [6,7], or one can rely upon previously established reference material. Most previous studies measuring cardiorespiratory fitness tend to use peak oxygen uptake (VO2peak), indirect methods,
estimation by equation, selected populations and/or small sample sizes [8–15]. Previously established variables suitable for exercise prescription such as oxygen uptake, heart rate, Watts and Borg scale scores, are mostly based upon small sample sizes or poorly described populations [6,16–23]. The aim of this study was to establish a large reference material of empirical cardiorespiratory fitness and exercise-physiology data in healthy men and women
aged 20–90 years in order to provide an easily accessible, valid and understandable tool for improved exercise training prescription.
Methods
Participants
resided in the 3 municipals selected for VO2maxtesting, and 5633
of them volunteered to participate. These 3 locations were chosen due to geographical location to minimize travel distance for participants. 4621 candidates completed a VO2maxtest, whereas
3816 tests were considered to have reached the true VO2max.
Ethics Statement
The study was approved by the Regional committee for medical research ethics (2012/1228/REK midt), the Norwegian Data Inspectorate and the National Directorate of Health, and is in compliance with the Helsinki declaration. Written informed consent was obtained from all participants.
VO2maxand Heart Rate
An individualized graded protocol [24] was used for measuring VO2max(Cortex MetaMax II, Cortex, Leipzig, Germany). Prior of
starting the testing procedure several MetaMax II apparatus were tested against Douglas-bag and iron lung (Cortex, Leipzig, Germany). Two MetaMax II apparatus were returned to Cortex due to unstable recordings (both ventilation and carbon dioxide analysis) and replaced by two new apparatus that were tested and found both reliable and valid. Hence, all MetaMax apparatus used in the project were both valid and reliable. Test-retest correlation of oxygen-uptake for the tested-personnel in the project was 0.99, p,0.001 and coefficient of variation was 1.8%. Bland-Altman plot were constructed where differences in two tests of maximal oxygen uptake (and sub maximal) from each person (test-1 minus test-2) were plotted against the average of the two tests ((test-1+test-2)/2). Average difference was 20.04 ml?kg21?min21 and standard deviation of the difference was 1.0. Therefore one can expect that 95% of all observations are at the average ((test-1+test-2)/2)
62 standard deviations. Thus, we can expect values to vary between 20.0422?1 to 20.04+2?1 if we test maximal oxygen uptake twice in the same person within a short time period. Velocity and inclination of the test treadmills were calibrated prior to testing.
The MetaMax II was calibrated prior to the first test each day using a standard two-point gas calibration procedure recom-mended by the manufacturer. The calibration includes measure-ments of ambient air and a gas mix of known content (15.03% O2
and 4.98% CO2 in N2), a calibration of the Triple-V volume
transducer with a calibrated 3 L syringe (Calibration syringe D, Sensormedics, CareFusion, San Diego, CA, USA), and barometric pressure control. Volume calibration was implemented every third test and the two-point gas calibration every fifth. Before each test the ambient room air was routinely checked. Heart rate was measured by radio telemetry (Polar S610i, Polar Electro Oy, Kempele, Finland). Body mass was measured using the weighing scale Model DS-102 (Arctic Heating AS, Nøtterøy, Norway). All participants had a treadmill familiarization period of 8–10 minutes during warm-up. They were instructed to avoid grabbing handrails if not necessary. The individualized warm-up workload determined the initial velocity/inclination on the subsequent treadmill test. Candidates wore a face mask (Hans Rudolph, Germany) linked to the MetaMax II. When participant main-tained a stable oxygen uptake.30seconds, velocity (0.5–1.0 kmh-1) or inclination (1–2%) were increased. Increased workload was preferably obtained with increased velocity and keeping a fixed slope angle. If a participant was unable to increase velocity, inclination was increased. The average velocity and slope during test protocol were 6.862.2 km?h21 (range 2–17 km?h21) and 10.061.6% (range 2–16%), respectively. Tests were terminated when candidates were exhausted or reached a VO2plateau that
remained stable despite increased work load [25], i.e. VO2did not
increase more than 2 mL?kg21?min21 despite increased work load.
Ventilatory Equivalent
We calculated the ventilatory equivalent (VE?VO22 1
) at VO2max. The ventilatory equivalent describes the fraction of
minute ventilation (VE) to oxygen uptake (VO2), hence, the higher
the value the more ineffective is the VE. At higher levels of
increasingly harder submaximal workloads, a disproportionate increase in VErelative to VO2occurs. This heralds an increasingly
more inefficient VE.
Questionnaire-based Information
Physical activity index score (PAI) was calculated from replies in a self-administered questionnaire that consisted of 3 questions. Question 1: ‘‘How frequently do you exercise?’’ with response alternatives ‘‘Never’’ (0); ‘‘Less than once a week’’ (0); ‘‘Once a week’’ (1); ‘‘2–3 times a week’’ (2.5); ‘‘Almost every day’’ (5). Question 2: ‘‘If you exercise as frequently as once or more times a week: How hard do you push yourself?’’ with response alternatives ‘‘I take it easy without breaking a sweat or losing my breath’’ (1); ‘‘I push myself so hard that I lose my breath and break into sweat’’ (2); ‘‘I push myself near exhaustion’’ (3). Question 3: ‘‘How long does each session last?’’ with the following response options ‘‘Less than 15 minutes’’ (0.1); ‘‘15–29 minutes’’ (0.38); ‘‘30 minutes to 1 hour’’ (0.75); ‘‘More than 1 hour’’ (1.0). The numbers in brackets, corresponding to each subject’s response to the 3 questions above, were multiplied to calculate the physical activity index score. An index score in the range 0.05–1.50 was considered to signify low activity, an index score in the range 1.51–3.75 was interpreted as medium activity and a score in the range 3.76–15.0 signified high activity. The index score is previously established as valid and reliable [26].
Borg Scale of Perceived Exertion and VO2at 2 Sub
Maximal and Maximal Workload
Candidates were asked to state their subjective rating of perceived exertion (Borg scale) at the end of 3 different levels. Borg scale visualizes work load intensity, denoted by numbers 6– 20 [22], with a proportional relation between increased rating of perceived exertion and the reported Borg scale number. Level 1: The individual initial workload for the test was determined during warm-up. All individuals reached a stable VO2and heart rate after
3 minutes at the first submaximal work load. Level 2: Treadmill gradient was elevated by 2% or velocity increased 1 km?h21. After 1–2 minutes at this sub maximal workload steady state was obtained. The maximum level is described previously.
Watts
Workload in watts was calculated at the 3 described workloads. Calculations were based on treadmill slope gradient, velocity and body mass input in Cortex MetaMax II (Cortex, Leipzig, Germany). Minimum slope gradient was 2% and mean slope gradient at maximum workload was 10.461.4%.
Statistical Analysis
were two-sided. SPSS 16.0 (Statistical package for Social Sciences, Chicago; Illinois, USA) and GraphPad Prism 4.01 (GraphPad Software, San Diego, California, USA) were used to analyze data. Correlations were done using data from Level 1, Level 2 and Level 3 (maximum) as described above. A p-value of ,0.05 was considered statistically significant.
Results
Overall VO2max was 3.1960.90 L?min21 or
41.369.2 mL?kg21?min21 (range 18.6–76.5 mL?kg21?min21, Table 1). Women had 18.7% (p,0.001) lower VO2max than
men (37.067.5 mL?kg21
?min21 vs. 45.4
68.9 mL?kg21 ?min21).
Maximal oxygen pulse was 34% lower (p,0.001) in women than men (14.062.6 mL?beat21 vs. 21.1
63.8 mL?beat21). Maximal
workload at VO2max was 33% lower (p,0.001) in women
compared with men (121624 W vs. 181636 W). There were no significant sex differences in maximal heart frequencies or Borg scores at termination of the test (Table 1).
The highest VO2max and maximal heart rate for both sexes
were observed in the age group 20–29 years. Among men and women in this age group VO2maxwere 54.468.4 mL?kg21?min21
and 43.067.7 mL?kg21?min21 (sex differences, p,0.001) with corresponding heart rates of 196610 beats?min21 and 19469 beats?min21(sex differences, p,0.05). In both sexes VO2maxand
maximal heart rates were approximately 8% (<3.5 mL?kg21?min21) and 3.5% (6 beats?min21) lower per increased decade, respectively. The Physical Activity Index (PAI) scores were also highest for both sexes in this age group. For men and women PAI scores were 4.6464.04 and 3.9663.25, respectively (no significant sex differences), which are considered to indicate a high physical activity level. All other age groups,
regardless of sex, had PAI scores in the range 2.67–3.70, which are considered to indicate medium activity [26] (Table 2).
We observed an EqVO2maxof 33.964.0 and 34.165.3 among
men and women, aged 20–29 years, respectively. Generally no differences were found between sexes and age groups, except from a 3% (p,0.05) higher EqVO2maxin females aged 30–39 and 40–
49 years compared to corresponding groups of males. Addition-ally, EqVO2maxincreased by 3% (p,0.05) between the two most
senior male groups (Table 2).
The highest maximal oxygen pulse was observed in the 3 youngest age groups (20–49 years) for both sexes, with no significant difference between these age groups. Women in these age groups had 33% lower (p,0.001) oxygen pulse compared with men (14.762.7 mL?beat21 vs. 22.363.6 mL?beat21). In the subsequent age groups an approximately 8% reduction in oxygen pulse per decade was observed among both sexes (Table 3).
Rating of Perceived Exertion, %VO2maxand %maximal
Heart Rate
As can be seen from Table 4, rating of perceived exertion reported as Borg Score fairly well estimate the relative exercise intensity expressed as percent of maximal heart rate and percent of VO2max. Data also show that there may be sex differences in
these relationships in the lowest intensities corresponding to Borg below 16. For example the actual exercise intensity for men and women that report to exercise at Borg 6–9 corresponds to 75.8% (CI: 74.5–77.1) and 79.1% (CI: 77.6– 80.5) of maximal heart rate, respectively (sex differences, p,0.05). Furthermore, Borg 13–15 corresponds to a heart rate of 84.7% (CI: 84.3–85.1) for men and 88.4% (CI: 88.0–88.7) for women (sex differences, p,0.001). The same discrepancies apply to %VO2maxin corresponding Borg range. At Borg Score
above 16 there were no sex or age group differences, with the exception of an age group difference between the 50–59 years and the 60–69 years group in both percent of maximal heart rate (p,0.01) and percent of VO2max (p,0.05).
VO2, Heart Rate, Watt and Physical Activity Index
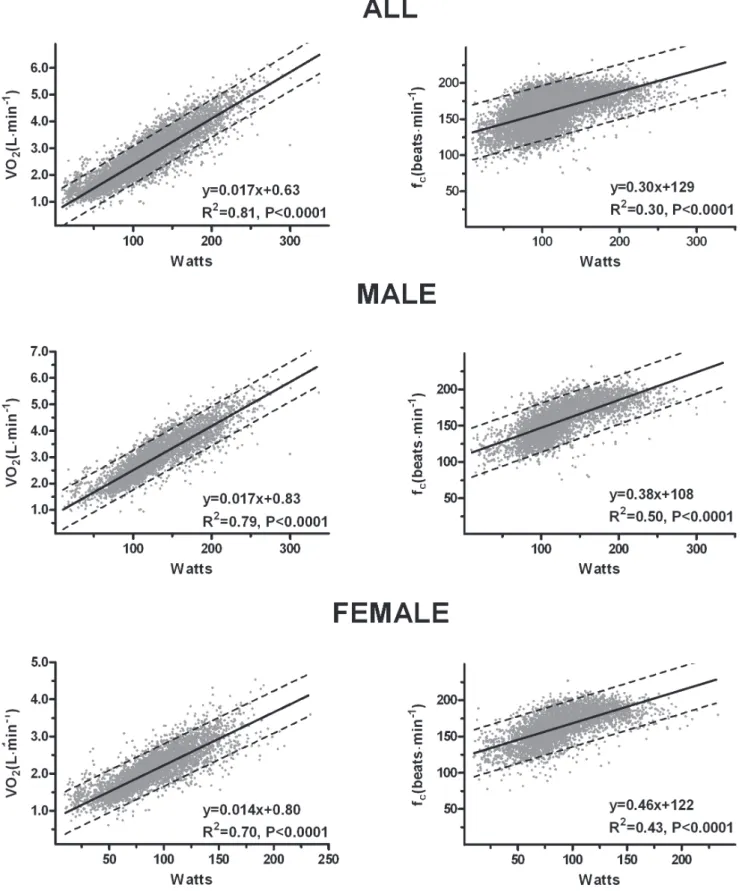
Figure 1 displays the relationship between VO2and heart rate.
The overall correlation for VO2 (L?min21) and heart rate was
found to be moderate (r = 0.51, p,0.0001). Stratified by sex, this association became stronger; males r = 0.70 (p,0.0001), female r = 0.61 (p,0.0001). The association between percent VO2 and
percent maximal heart rate was strong; all r = 0.89 (p,0.0001), male r = 0.90 (p,0.0001), female r = 0.87 (p,0.0001).
Figure 2 demonstrates the strong association between VO2
(L?min21) and treadmill workload (Watts), and the correlation
between watts and heart rate; VO2 vs. Watts: all r = 0.90
(p,0.0001), male r = 0.89 (p,0.0001), female r = 0.84 (p,0.0001). Heart rate vs. Watts: Viewing the full sample size a moderate correlation was observed between treadmill workload (Watts) and heart rate (r = 0.55, p,0.0001). Good correlations were observed when the data was stratified by sex; male r = 0.71 (p,0.0001), female r = 0.66 (p,0.0001).
Figure 3 demonstrates a poor, but statistically strong association between Physical activity index and VO2 (mL?kg21?min21); all
r = 0.24 (p,0.0001), male r = 0.29 (p,0.0001) and female r = 0.27 (p,0.0001).
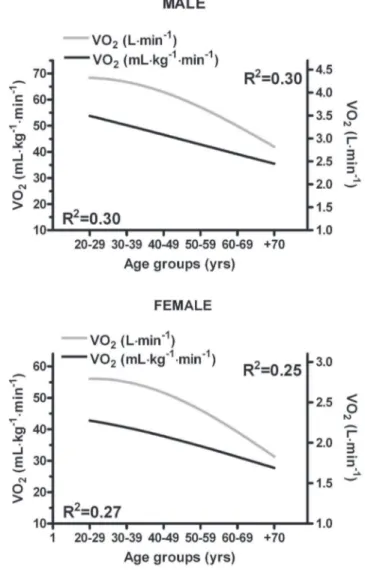
Figure 4 exhibits a moderate association between VO2 (both
mL?kg21?min21 and L?min21) and age groups, male: r = 0.54 and r = 0.54, respectively; female: r = 0.52 and r = 0.50, respec-tively.
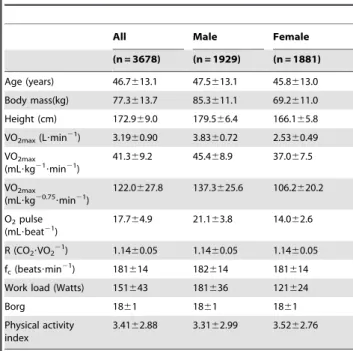
Table 1.Physical and physiological characteristics of participants in the HUNT 3 Fitness study.
All Male Female
(n = 3678) (n = 1929) (n = 1881)
Age (years) 46.7613.1 47.5613.1 45.8613.0
Body mass(kg) 77.3613.7 85.3611.1 69.2611.0
Height (cm) 172.969.0 179.566.4 166.165.8
VO2max(L?min21) 3.1960.90 3.8360.72 2.5360.49
VO2max (mL?kg21
?min21) 41.369.2 45.468.9 37.067.5 VO2max
(mL?kg20.75?min21)
122.0627.8 137.3625.6 106.2620.2
O2pulse
(mL?beat21) 17.764.9 21.163.8 14.062.6
R (CO2?VO221) 1.1460.05 1.1460.05 1.1460.05
fc(beats?min21) 181614 182614 181614
Work load (Watts) 151643 181636 121624
Borg 1861 1861 1861
Physical activity index
3.4162.88 3.3162.99 3.5262.76
Discussion
This is the largest European reference material of objectively measured aerobic capacity and exercise-physiology in healthy men and women aged 20–90 yrs. Our observations are an important supplement to previously published data that have mostly been either indirect or based on small, selected, or poorly-described populations [8–14].
Sex Differences in VO2maxand Maximal Heart
Frequencies
Despite being generally more physical active than men, women had a 34% and 18.5% lower absolute (L?min21) and relative (mL?kg21?min21) VO2max, respectively, than men. When applying
Table 2.Physiological variables in the HUNT 3 Fitness study stratified by sex and age groups.
Male Female
20–29 years
(n = 199) (n = 215)
VO2max(L?min21) 4.3260.71 2.7860.46
VO2max(mL?kg21?min21) 54.468.4 43.067.7
VO2max(mL?kg20.75?min21) 162.1623.7 121.7620.1
EqVO2max(VE?VO2max21) 33.964.0 34.165.3
Body mass (kg) 80.1610.6 65.5610.4
Height (cm) 18166 16666
R (CO2?VO221) 1.1560.05 1.1560.05
fc(beats?min21) 196610 19469
Workload (Watts) 200639 128624
BORG 1961 1861
PAI 4.6464.03 3.9663.25
30–39 years
(n = 324) (n = 359)
VO2max(L?min21) 4.2260.63 2.7560.48
VO2max(mL?kg21?min21) 49.167.5 40.066.8
VO2max(mL?kg20.75?min21) 149.2621.0 114.9618.1
EqVO2max(VE?VO2max21) 33.263.7 34.164.6
Body mass (kg) 86.8612.1 69.7611.5
Height (cm) 18066 16865
R (CO2?VO221) 1.1560.05 1.1560.05
fc(beats?min21) 19069.5 188611
Workload (Watts) 197633 128623
BORG 1861 1861
PAI 3.1563.23 3.3662.73
40–49 years
(n = 526) (n = 493)
VO2max(L?min21) 4.0360.61 2.6560.44
VO2max(mL?kg21?min21) 47.267.7 38.466.9
VO2max(mL?kg20.75?min21) 143.3621.4 110.3618.1
EqVO2max(VE?VO2max21) 33.664.3 34.664.5
Body mass (kg) 86.4611.5 69.9611.2
Height (cm) 18067 16766
R (CO2?VO221) 1.1560.05 1.1560.05
fc(beats?min21) 184611 182611
Workload (Watts) 189633 125622
BORG 1861 1861
PAI 3.0062.73 3.7062.66
50–59 years
(n = 466) (n = 428)
VO2max(L?min21) 3.6560.59 2.3660.37
VO2max(mL?kg21?min21) 42.667.4 34.465.7
VO2max(mL?kg20.75?min21) 129.5621.1 98.7615.0
EqVO2max(VE?VO2max21) 33.964.9 33.964.2
Body mass (kg) 86.4610.3 69.6610.2
Height (cm) 17966 16566
R (CO2?VO221) 1.1460.05 1.1460.05
Table 2.Cont.
Male Female
20–29 years
(n = 199) (n = 215)
fc(beats?min21) 177612 176611
Workload (Watts) 173628 117623
BORG 1861 1861
PAI 3.2462.70 3.5262.80
60–69 years
(n = 300) (n = 240)
VO2max(L?min21) 3.3060.55 2.1660.33
VO2max(mL?kg21?min21) 39.266.7 31.165.1
VO2max(mL?kg20.75?min21) 118.5619.4 89.6613.4
EqVO2max(VE?VO2max21) 34.965.0 34.164.4
Body mass (kg) 84.769.9 70.4610.9
Height (cm) 17966 16565
R (CO2?VO221) 1.1460.05 1.1260.05
fc(beats?min21) 171613 169612
Workload (Watts) 160633 110623
BORG 1761 1762
PAI 3.2262.58 3.1962.57
+70 years
(n = 76) (n = 53)
VO2max(L?min21) 2.8160.50 1.8560.35
VO2max(mL?kg21?min21) 35.366.5 28.365.2
VO2max(mL?kg20.75?min21) 105.3618.5 80.3613.8
EqVO2max(VE?VO2max21) 36.065.2 34.964.4
Body mass (kg) 80.269.6 66.2611.2
Height (cm) 17666 16266
R (CO2?VO221) 1.1260.05 1.1160.03
fc(beats?min21) 163615 165616
Workload (Watts) 140631 97626
BORG 1761 1662
PAI 3.4662.92 2.6761.92
Data is presented as arithmetic mean6SD. VO2max: maximal oxygen uptake, EqVO2max: ventilatory equivalents, R: respiratory exchange ratio, fc: cardiac frequency, Workload: treadmill exercise load, BORG: subjective perception of fatigue (6–20), PAI: physical activity index: A weighted product score between training- intensity, duration and frequency.
appropriate scaling procedures [27] where differences in body mass are taken into consideration for a more accurate comparison [27–29], women had 22.7% lower VO2max (mL?kg20.75?min21)
than men. The higher VO2max in men is in accordance with
former studies [5,10–14,30]. We observed higher VO2max
compared to that reported in American [9,11,13,14], Japanese populations [8] and a large Brazilian study [31], especially in the younger age groups. Earlier Scandinavian research supports our Table 3.O2-pulse in the HUNT 3 Fitness study stratified by intensity levels, sex and age groups.
Male Female
Level 1 Level 2 Maximal Level 1 Level 2 Maximal
20–29 years
(n = 121) (n = 106) (n = 199) (n = 131) (n = 111) (n = 215)
O2-pulse (mL?beat21) 17.565.5 18.464.0 22.164.0 11.862.4 12.662.2 14.462.4
VO2(mL?kg?min21) 34.668.0 40.468.1 54.468.4 29.366.2 33.966.5 43.067.7
%VO2max 63.7612.3 72.7610.6 68.1611.0 76.669.6
%fcmax 80.768.8 87.865.4 85.068.3 90.766.4
Workload (watts) 109624 126623 200639 78615 91614 128624
30–39 years
(n = 176) (n = 166) (n = 324) (n = 247) (n = 221) (n = 359)
O2-pulse (mL?beat21) 17.562.9 18.362.9 22.363.6 12.262.5 12.962.6 14.762.7
VO2(mL?kg?min21) 29.865.5 34.265.7 49.167.7 27.265.3 31.065.5 40.066.8
%VO2max 62.1610.4 71.0610.1 68.5610.4 77.769.9
%fcmax 78.967.4 86.066.4 83.366.9 90.365.8
Workload (watts) 110621 124620 197633 77616 91618 128623
40–49 years
(n = 351) (n = 334) (n = 526) (n = 347) (n = 320) (n = 493)
O2-pulse (mL?beat21) 18.463.9 19.164.0 22.163.6 12.362.5 13.062.54 14.662.6
VO2(mL?kg?min21) 30.766.8 34.867.1 47.267.7 26.565.03 30.265.9 38.466.9
%VO2max 65.1610.6 73.7610.4 70.1610.4 79.069.8
%fcmax 78.667.7 85.767.3 83.167.1 90.066.0
Workload (watts) 107621 123622 189633 74615 88616 125622
50–59 years
(n = 343) (n = 314) (n = 466) (n = 354) (n = 311) (n = 428)
O2-pulse (mL?beat21) 17.863.3 18.563.3 20.763.6 11.862.1 12.362.2 13.462.2
VO2(mL?kg?min21) 28.566.0 32.166.1 42.667.4 24.164.0 27.164.3 34.465.7
%VO2max 67.6610.9 75.6610.6 72.0610.1 80.269.8
%fcmax 78.367.7 85.267.3 82.267.1 88.466.4
Workload (watts) 99620 117621 173628 67617 79618 117623
60–69 years
(n = 258) (n = 239) (n = 300) (n = 236) (n = 204) (n = 240)
O2-pulse (mL?beat21) 17.163.3 17.563.4 19.363.4 11.762.5 11.962.1 12.962.3
VO2(mL?kg?min21) 26.665.5 29.665.4 39.266.7 22.963.8 25.564.3 31.165.1
%VO2max 66.4611.0 76.5611.0 74.869.9 81.969.2
%fcmax 77.968.5 84.668.0 83.868.4 89.367.4
Workload (watts) 88620 104621 160633 57617 70618 110623
+70 years
(n = 95) (n = 86) (n = 76) (n = 83) (n = 71) (n = 53)
O2-pulse (mL?beat21) 15.363.1 15.863.3 17.263.2 10.162.2 10.662.1 11.462.4
VO2(mL?kg?min21) 24.365.2 26.966.1 35.366.5 20.764.1 22.864.6 28.365.2
%VO2max 70.7610.9 77.8611.0 74.5610.4 81.869.0
%fcmax 80.967.7 86.268.0 84.267.2 90.067.7
Workload (watts) 67625 83627 140631 43618 57619 97626
Data is presented as arithmetic mean6SD. O2-pulse: oxygen pulse, VO2: oxygen uptake, %fcmax: percent of maximum heart frequency, Workload: treadmill exercise load.
VO2maxlevels [25,32,33]. A study of Nomadic Lapps [34], who
were physically active in taking care of their reindeers, observed VO2max values close to our findings, and it is indicated that
Roman legionnaires [35] had a VO2max in the range of
50 mL?kg21?min21. Also contemporary hunter-gatherer societies display VO2max in the range 50–65 mL?kg21?min21 in young
male populations [36]. This supports the assumption that by living an active life, VO2maxin the range we display could be expected.
When applying a scaled VO2max[27], where differences in body
weight is considered for a more precise comparison [27–29], the HUNT 3 fitness study still displays a considerable higher VO2max
(mL?kg20.75?min21) than North American, German and Asian studies. Scaled VO2maxin HUNT 3 was approximate 20% higher,
considering both sexes and all age groups, than North American [9,10,37] and a German study [38]. However, a North American study by Jackson and colleagues [14] display only an estimated 10% lower scaled VO2max, compared to our findings, among both
sexes in the 20–29 year age group, with diminishing differences per subsequent decade. A Japanese study [8] displays an average 14% lower scaled VO2maxthan us, among both sexes and all age
groups. The dissimilarities between our and other findings may be explained by that we measured VO2max whereas most others
[8,9,11,14] use VO2peak or estimated VO2max [13,15], and that
most other populations might also lead a more sedate lifestyle than that of Scandinavians.
Despite our relatively high mean VO2max, 25 men and 9 women
(.50 years) displayed values below 8 METs (28 mL?kg21?min21) and 6 METs (21 mL?kg21?min21), respectively. This is associated with higher all-cause mortality and cardiovascular events among healthy men and women [4]. 1% of men 50–59 years displayed METs associated with increased risk, with 4% and 11% prevalence of ‘‘increased risk MET’’ with each subsequent decade. Women displayed approximately half the prevalence over the same age groups. We report a somewhat higher maximal heart rate than previous studies, which could be explained by that others [10–12] measure peak heart rate. In line with former studies [10– 12] there were no significant sex differences in maximal heart rate.
Differences in VO2maxand Physical Activity Level
Stratified by Age Group and Sex
The highest VO2max, in both men and women, were observed in
the age groups 20–29 years. This fits with that both sexes in this age group had the highest level of physical activity compared to all other age groups. Between the two youngest age groups of both men and women (20–29 years and the 30–39 years) there was no difference in absolute VO2max(L?min2
1
). However, among the 30–39 years old, body mass was 8.4% and 6.4% higher, and physical activity level 32.1% and 15.2% lower for men and women, respectively. A lower physical activity level did not influence the absolute VO2max
(L?min21) but probably contribute to the higher body mass in those aged 30–39 years. Relative to body mass VO2max(mL?kg2
1 ?min21) was 10% and a 7% lower among men and women aged 30–39 years compared to those in the 20–29 year age group. Thus, lower relative VO2maxin those aged 30–39 years old was caused by a higher body
mass in our study population.
Despite similar body weights and physical activity level, a highly significant lower absolute (4.4%) and relative (3.8%) VO2maxwas
observed among men and women aged 40–49 years compared to those aged 30–39 years. In line with our findings, Sanada and colleagues [8] observed a similar drop in VO2maxbetween these
age groups among healthy Japanese men. However, they observed a considerably larger ‘‘drop’’ in VO2maxwith no change in body
mass among women compared to our observations. Their findings are in agreement with another study of women by Jackson and colleagues [9]. A likely explanation for the lower VO2maxin those
aged 40–49 vs. 30–39 could be a reduced level of physical activity in the oldest age group. However, our data does not support this. The Sanada [8] study shows a decrease in skeletal muscle mass with simultaneous increase in percent body fat. This would deteriorate demand properties and decrease VO2max. We do not
know if this is the case in our study, but the drop in absolute VO2maxyields a reduction in supply properties, hence a reduction
in VO2max. The reason for different ‘‘drop’’ in VO2maxamong
women in our study, the Sanada [8] and Jackson [9] studies is not known and warrant further studies.
Over the 3 next decades (40–69 years) the decrease in absolute and relative VO2maxhad more than doubled (<10% per decade), Table 4.Relationships between perceived exertion, VO2maxand fcmaxin the HUNT 3 fitness study.
All Male Female
Borgscale % fcmax 95% CI N % fcmax 95% CI N % fcmax 95% CI N
6–9 77.3 76.4–78.3 253 75.8 74.5–77.1 136 79.1 77.6–80.5 117
10–12 79.9 79.5–80.3 1475 78.1 77.6–78.6 813 82.2 81.6–82.7 662
13–15 86.6 86.3–86.7 3017 84.7 84.3–85.1 1459 88.4 88.0–88.7 1558
16–18 98.1 97.9–98.3 1775 98.1 97.8–98.4 862 98.2 97.9–98.5 913
19+ 99.9 99.9–100 1216 99.9 99.7–100 560 100 99.98–100 656
Borgscale %VO2max 95% CI N %VO2max 95% CI N %VO2max 95% CI N
6–9 61.9 60.6–63.3 253 60.1 58.2–62.1 136 64.0 62.3–65.7 117
10–12 66.8 66.3–67.3 1475 64.7 64.1–65.4 813 69.3 68.6–70.0 662
13–15 76.7 76.3–77.1 3017 74.4 73.8–75.0 1459 78.8 78.3–79.4 1558
16–18 96.4 96.0–96.8 1775 96.5 96.0–97.1 862 96.3 95.8–96.8 913
19+ 99.9 99.5–100 1216 99.8 99.5–100 560 99.9 99.9–100 656
Borgscale: subjective perception of perceived exertion (6–20), CI: confidence interval, %fcmax: percent of maximal heart frequency, %VO2max: percent of maximal oxygen uptake.
in both sexes, compared to that observed between age groups 30– 39 years and 40–49 years. There were no significant differences in body mass between these age groups, with the exception of a<2% reduction in males between 50–59 and 60–69 years. The reduction in VO2maxper decade is in line with previous studies
[8,11,14]. A significant reduction in physical activity level with increased age among women was observed in our study, with no changes in the male group. Thus, reduced physical activity level may explain reduced VO2maxwith increased age among women
but not among men. Whether this is really an age-related decline
Figure 1. Correlations between oxygen uptake (VO2)and heart rate (fc).
or due to that men have a tendency to over-report physical activity [39] is not known, and future investigations should aim to obtain objectively measured physical activity levels.
Between the 60–69 years and the +70 year age groups we observed the largest ‘‘drop’’ in absolute VO2max(L?min21) in both
sexes (<14.5%). Relatively VO2max(mL?kg21?min21) were 10% Figure 2. Correlations between workload (Watts) and oxygen uptake (VO2) and correlations between Watts and heart rate (fc).
and 11% lower in males and females aged+70 compared to those aged 60–69 years. The large drop in relative VO2maxoccurred
despite no significant drops in body mass and physical activity level. This suggests that the drop may be due to ‘‘age-related’’ adaptations in the organism. Our findings for these age groups are in line with previous studies reporting reductions in relative and absolute VO2maxin the range 13–25% and 12–29% [8,10,12,40].
Ventilatory efficiency, EqVO2max, remains generally unchanged
throughout the age groups; hence, it is not a factor in explaining the diminishing VO2maxwith increasing age. However, subsequent
50 years of age O2-pulse displayed a steady decrease, which
indirectly indicate a reducing stroke volume, hence this yield a reduction in VO2max.
Differences in Maximum Heart Rate Stratified by Age Group and Sex
Maximum heart rate has regularly been estimated by an equation subtracting age from 220 beats?min21, which have limited scientific merit [41]. The highest heart frequencies were found in the youngest age groups, regardless of sex. Maximal heart frequencies in men and women were 196610 beats?min21 and 19469 beats?min21, respectively, with a decline of approximately 3.5% (6 beats?min21) per decade. Our maximal heart rate decline
Figure 3. Correlations between physical activity index score and oxygen uptake (VO2).
doi:10.1371/journal.pone.0064319.g003
Figure 4. Decline of oxygen uptake (VO2) relative to age.Mean
gradient is approximately half that compared to using the 220 beats?min21minus age equation, which is consistent with former research [10,42,43].
Differences in Oxygen Pulse Stratified by Gender and Age Groups
The highest maximal oxygen pulse was observed in the 3 youngest age groups among men (22.363.6 mL?beat21) and women (14.762.7 mL?beat21), with no significant difference between these
age groups. Previous reference material on oxygen pulse in healthy populations is based upon case reports [7] or small studies in athletes [44] [45] making comparison with our data complicated.
Association between VO2and Heart Rate
The benchmark studies of the relationship between submaximal VO2 and heart frequencies from the 509s and 609s have small
sample size. When comparing our findings with that of A˚ strand [6] there are obvious discrepancies. Compared with our observations, A˚ strand reports lower heart frequencies at workloads correspond-ing to VO2lower than 3 L?min21, and higher heart frequencies at
VO2 higher than 3 L?min2 1
. Since there are no references to sample size or gender in A˚ strands data it is difficult to interpret the discrepancies between the studies. Another study by A˚ strand [17] with 86 relatively well trained male and female students, agrees with our data, for the age group 20–29 years, on VO2less than
3 L?min21. When VO2 exceed 3.0 L?min21 for females and
4.0 L?min21 for males the present study displays lower heart frequencies than reported in the A˚ strand study. A study [18] with 44 females, aged 20–65 years, displayed lower heart frequencies than we observed for VO2,1.5 L?min21, but higher heart
frequencies for VO2.1.5 L?min21. The observed association
between percent VO2max and percent maximal heart rate is in
agreement with previous studies [16,18,19] on intensities.70% of VO2max. At exercise intensities,70% of VO2max we observed
higher percent heart rate than previous studies. In our study 30% of VO2maxcorresponded to 60% of maximal heart rate where
others [16,18,19] have reported that this is equal to 50% of maximal heart rate. However, we use treadmill testing while the others use bicycle ergometer, which could explain the discrepan-cies.
Association between Heart Rate and Watts
Comparing our results to a study by A˚ strand [20] with 84 healthy males, good agreement was found for workloads.150W, whereas we observed progressively higher heart frequencies than A˚ strand at lower workloads. This is also the case when comparing our results to another study of males by A˚ strand [6]. Again, the inconsistency between our and A˚ strand’s findings could be explain by treadmill vs. bicycle ergometer.
Association between VO2and Watts
We systematically display higher VO2 (L?min2 1
) at any given watt than that observed in two studies from A˚ strand [17,21]. Discrepancies seem to be caused by higher initial VO2 cost
(L?min21) in our results, while the slope gradient is in close
proximity with A˚ strand [17,21]. The differences may be explained by that we applied treadmill work whereas A˚ strand used a cycle ergometer.
Association between Borg Scale Scores, % VO2maxand %
Maximal Heart rRate
We observed a mismatch between the Borg study [22] and our findings. We observed considerably higher percent VO2maxand
percent maximal heart rate for a given exertion interval than Borg [22], but differences vanished at the highest Borg-levels.
Relative to VO2maxand maximal heart rate Borg scale differed
between sexes. In the range 6–15 on Borg scale males worked at a lower percent (4%) of both VO2maxand maximal heart rate than
females, i.e. the relative rating of perceived exertion in males were higher at a given work load. There were no differences between sexes at Borg16–20. Our data clearly support the notion that Borg-scale may be used as a robust tool to guide exercise intensity in healthy men and women, but that one should be aware of sex differences at the lowest Borg levels.
Association between Physical Activity Index Scores and VO2max
There was a poor overall correlation (r = 0.24) between self-reported physical activity level and VO2, which indicates that only
5.7% of differences in VO2maxcan be explained by the physical
activity scores. This is in agreement with prior research [11,46,47]. Physical activity index score (PAI) is a weighted product between duration, frequency and intensity. Intensity might be weighted to low, thus it could explain the poor correlation between PAI and VO2.
Limitations
This study may be subject to bias due to self-selection caused by the low participation rate. However, almost all of those who were invited to the current Fitness study from the large HUNT study agreed to participate in the fitness test. Due to limited capacity at the test sites resulting in long waiting lines, many potential participants chose to withdraw their participation from the study. Those who finally participated in the study could thus be healthier than those who quit or declined participation. However, a comparison of the participants in the fitness study with a healthy sample of the total HUNT population (i.e. free from cardiovas-cular or pulmonary diseases, cancer, or sarcoidosis) confirmed that the fitness participants did not considerably differ from other healthy HUNT participants [48]. In future studies physical activity should be measured objectively rather than being self-reported, given the large inconsistencies between VO2maxand self-reported
physical activity.
Conclusions
The discrepancies between this and previous studies highlighted the need of a large reference material as presented in this study. The HUNT 3 Fitness study presents the largest Europen reference material of objectively measured parameters of aerobic capacity and exercise-physiology in healthy men and women aged 20–90 years. Our data establishes normal values for the key physiological factors VO2max and heart rate, as well as associations between
commonly used exercise parameters. The data forms the basis for a user-friendly tool for exercise intensity control in healthy men and women.
Acknowledgments
Author Contributions
Conceived and designed the experiments: UW. Performed the experi-ments: UW OR. Analyzed the data: HL OR BS UW. Contributed reagents/materials/analysis tools: HL OR BS UW. Wrote the paper: HL
OR BS UW. Conception and design of the work, acquisition of data, or analysis and interpretation of data: HL OR BS UW. Drafting the article or revising it critically for important intellectual content: HL OR BS UW. Final approval of the version to be published: HL OR BS UW.
References
1. Erikssen G, Liestol K, Bjornholt J, Thaulow E, Sandvik L, et al. (1998) Changes in physical fitness and changes in mortality. Lancet 352: 759–762.
2. Myers J, Prakash M, Froelicher V, Do D, Partington S, et al. (2002) Exercise capacity and mortality among men referred for exercise testing. N Engl J Med 346: 793–801.
3. Sandvik L, Erikssen J, Thaulow E, Erikssen G, Mundal R, et al. (1993) Physical fitness as a predictor of mortality among healthy, middle-aged Norwegian men. N Engl J Med 328: 533–537.
4. Kodama S, Saito K, Tanaka S, Maki M, Yachi Y, et al. (2009) Cardiorespiratory fitness as a quantitative predictor of all-cause mortality and cardiovascular events in healthy men and women: a meta-analysis. JAMA 301: 2024–2035. 5. Lee DC, Sui X, Ortega FB, Kim YS, Church TS, et al. (2011) Comparisons of
leisure-time physical activity and cardiorespiratory fitness as predictors of all-cause mortality in men and women. Br J Sports Med 45: 504–510. 6. A˚ strand P, Rodahl K, Dahl H, Strømme S (2003) Textbook of Work Physiology
Physiological Bases of Exercise: McGraw-Hill.
7. Wasserman K, Hansen JE, Sue DY, Stringer WS, Sietsema KE, et al. (2012) Principles of Exercise Testing and Interpretation: Lippincott Williams &Wilkins. 8. Sanada K, Kuchiki T, Miyachi M, McGrath K, Higuchi M, et al. (2007) Effects of age on ventilatory threshold and peak oxygen uptake normalised for regional skeletal muscle mass in Japanese men and women aged 20–80 years. Eur J Appl Physiol 99: 475–483.
9. Jackson AS, Wier LT, Ayers GW, Beard EF, Stuteville JE, et al. (1996) Changes in aerobic power of women, ages 20–64 yr. Med Sci Sports Exerc 28: 884–891. 10. Fleg JL, Morrell CH, Bos AG, Brant LJ, Talbot LA, et al. (2005) Accelerated longitudinal decline of aerobic capacity in healthy older adults. Circulation 112: 674–682.
11. Talbot LA, Metter EJ, Fleg JL (2000) Leisure-time physical activities and their relationship to cardiorespiratory fitness in healthy men and women 18–95 years old. Med Sci Sports Exerc 32: 417–425.
12. Hollenberg M, Ngo LH, Turner D, Tager IB (1998) Treadmill exercise testing in an epidemiologic study of elderly subjects. J Gerontol A Biol Sci Med Sci 53: B259–267.
13. Wang CY, Haskell WL, Farrell SW, Lamonte MJ, Blair SN, et al. (2010) Cardiorespiratory fitness levels among US adults 20–49 years of age: findings from the 1999–2004 National Health and Nutrition Examination Survey. Am J Epidemiol 171: 426–435.
14. Jackson AS, Sui X, Hebert JR, Church TS, Blair SN (2009) Role of lifestyle and aging on the longitudinal change in cardiorespiratory fitness. Arch Intern Med 169: 1781–1787.
15. Armstrong L, Balady GJ, Berry MJ, Davis SE, Davy BM, et al. (2006) ACSM’s Guidelines for Exercise Testing and Prescription: Lippincott Williams and Wilkins. 79 p.
16. McArdle W, Katch F, Katch V (2010) Exercise Physiology, Nutrition, Energy, and Human Performance. Philadelphia, PA: Lippincott Williams & Wilkins. 17. A˚ strand P (1952) Experimental studies of physical working capacity in relation to
sex and age. Copenhagen: Munksgaard.
18. Taylor H, Haskell W, Fox S, Blackburn H (1969) Measurement in Exercise Electrocardiography; Blackburn H, editor. Illinois, USA: Charles C Thomas Publisher.
19. Pollock M, Wilmore J, Fox S (1978) Health and fitness through physical activity: John Wiley & Sons.
20. Astrand I (1967) Degree of strain during building work as related to individual aerobic work capacity. Ergonomics 10: 293–303.
21. Astrand PO (1976) Quantification of exercise capability and evaluation of physical capacity in man. Prog Cardiovasc Dis 19: 51–67.
22. Borg GA (1982) Psychophysical bases of perceived exertion. Med Sci Sports Exerc 14: 377–381.
23. Alberton CL, Antunes AH, Pinto SS, Tartaruga MP, Silva EM, et al. (2011) Correlation between rating of perceived exertion and physiological variables during the execution of stationary running in water at different cadences. J Strength Cond Res 25: 155–162.
24. Rognmo O, Hetland E, Helgerud J, Hoff J, Slordahl SA (2004) High intensity aerobic interval exercise is superior to moderate intensity exercise for increasing
aerobic capacity in patients with coronary artery disease. Eur J Cardiovasc Prev Rehabil 11: 216–222.
25. Hermansen L, Saltin B (1969) Oxygen uptake during maximal treadmill and bicycle exercise. J Appl Physiol 26: 31–37.
26. Kurtze N, Rangul V, Hustvedt BE, Flanders WD (2008) Reliability and validity of self-reported physical activity in the Nord-Trondelag Health Study: HUNT 1. Scand J Public Health 36: 52–61.
27. Batterham AM, Birch KM (1996) Allometry of anaerobic performance: a gender comparison. Can J Appl Physiol 21: 48–62.
28. Chamari K, Moussa-Chamari I, Boussaidi L, Hachana Y, Kaouech F, et al. (2005) Appropriate interpretation of aerobic capacity: allometric scaling in adult and young soccer players. Br J Sports Med 39: 97–101.
29. Helgerud J (1994) Maximal oxygen uptake, anaerobic threshold and running economy in women and men with similar performances level in marathons. Eur J Appl Physiol Occup Physiol 68: 155–161.
30. Macek M, Seliger V, Vavra J, Skranc O, Horak J, et al. (1979) Physical fitness of the Czechoslovak population between the ages of 12 and 55 years. Oxygen consumption and pulse oxygen. Physiol Bohemoslov 28: 75–82.
31. Herdy AH, Uhlendorf D (2011) Reference values for cardiopulmonary exercise testing for sedentary and active men and women. Arq Bras Cardiol 96: 54–59. 32. Hermansen L, Andersen KL (1965) Aerobic work capacity in young Norwegian
men and women. J Appl Physiol 20: 425–431.
33. Andersen LB, Henckel P, Saltin B (1987) Maximal oxygen uptake in Danish adolescents 16–19 years of age. Eur J Appl Physiol Occup Physiol 56: 74–82. 34. Lange-Andersen L, Elsner R, Saltin B, Hermansen L (1961–1962) Physical
fitness in terms of maximal oxygen uptake of nomadic lapps. Arctic Aeromedical Laboratory, Alaska.
35. Mitchell JH, Saltin B (2003) The oxygen transport system and maximal oxygen uptake. New York: Oxford University press.
36. Cordain L, Gotshall RW, Eaton SB, Eaton SB 3rd (1998) Physical activity, energy expenditure and fitness: an evolutionary perspective. Int J Sports Med 19: 328–335.
37. Nelson MD, Petersen SR, Dlin RA (2010) Effects of age and counseling on the cardiorespiratory response to graded exercise. Med Sci Sports Exerc 42: 255– 264.
38. Meyer K, Hajric R, Samek L, Baier M, Lauber P, et al. (1994) Cardiopulmonary exercise capacity in healthy normals of different age. Cardiology 85: 341–351. 39. Klesges RC, Eck LH, Mellon MW, Fulliton W, Somes GW, et al. (1990) The
accuracy of self-reports of physical activity. Med Sci Sports Exerc 22: 690–697. 40. Weiss EP, Spina RJ, Holloszy JO, Ehsani AA (2006) Gender differences in the decline in aerobic capacity and its physiological determinants during the later decades of life. J Appl Physiol 101: 938–944.
41. Robergs R, Landwehr R (2002) The surprising history of the ‘‘HRmax = 220-age’’ Equation. Journal of Exercise Physiology online 5.
42. Tanaka H, Monahan KD, Seals DR (2001) Age-predicted maximal heart rate revisited. J Am Coll Cardiol 37: 153–156.
43. Gellish RL, Goslin BR, Olson RE, McDonald A, Russi GD, et al. (2007) Longitudinal modeling of the relationship between age and maximal heart rate. Med Sci Sports Exerc 39: 822–829.
44. Sharma S, Elliott PM, Whyte G, Mahon N, Virdee MS, et al. (2000) Utility of metabolic exercise testing in distinguishing hypertrophic cardiomyopathy from physiologic left ventricular hypertrophy in athletes. J Am Coll Cardiol 36: 864– 870.
45. Padilla P, Ojeda C, Fernandez C, Licea M (2000) Maximum oxygen pulse in high performance mexican athletes. Rev Inst Nal Enf Resp Mex 13: 73–84. 46. van Poppel MN, Chinapaw MJ, Mokkink LB, van Mechelen W, Terwee CB
(2010) Physical activity questionnaires for adults: a systematic review of measurement properties. Sports Med 40: 565–600.
47. Tager IB, Hollenberg M, Satariano WA (1998) Association between self-reported leisure-time physical activity and measures of cardiorespiratory fitness in an elderly population. Am J Epidemiol 147: 921–931.