Development and test-retest reliability of the Food Photograph
Scale for Brazilian adults
Maria Fernanda Laus
1, Natalia Louise Lima
2, Telma Maria Braga Costa
2, Marina Rodrigues
Barbosa
3, Paula Carolina Barboni Dantas Nascimento
4, and Sebastião de Sousa Almeida
11- Universidade de São Paulo, Ribeirão Preto, SP, Brazil
2- Universidade de Ribeirão Preto, Ribeirão Preto, SP, Brazil
3- Universidade Federal de São Carlos, São Carlos, SP, Brazil
4- Defensoria Pública do Estado de São Paulo, Ribeirão Preto, SP, Brazil
Abstract
The study of food practices in Brazil faces important problems because of the nonexistence of properly tested methods and lack of a gold-standard instrument. Furthermore, only one instrument is capable of measuring food choice or knowledge in this speciic population. In the present study we sought to develop a rapid assessment tool for food choice, consumption, and knowledge about healthy foods and test the reliability of the assessment tool in young adults as an initial step in the validation process. The scale was composed of 22 photographs of foods that were ready to consume, divided into “healthy” and “unhealthy” groups typically eaten as an afternoon snack in our region. To test the reliability of the instrument, 101 college students (51 males) were asked to select three items in response to three questions: “What would you like to eat as an afternoon snack?” “What do you consider healthy?” “What do you usually eat?” The procedure was repeated in the same subjects 1 month after the irst application of the instrument. Results indicated a perfect reliability (κ = 1.0) among men when asked to select what they would like to eat, and perfect reliability was found among men and women when asked to select foods that they considered healthy. Excellent reliability (κ > .75) was found among women and the total sample for foods they would like to eat and among men and women for what they usually eat. As an initial step in validating the instrument, the results suggested that it was properly developed and had reliability in the present context for studies that involve eating behavior.
Keywords: reproducibility of results, food habits, food choice, knowledge, scale, photographs, food.
Received 8 January 2013; received in revised form 29 April 2013; accepted 3 May 2013. Available online 27 June 2013.
Maria Fernanda Laus and Sebastião de Sousa Almeida, Laboratório de Nutrição e Comportamento, Departamento de Psicologia, Faculdade de Filosoia, Ciências e Letras de Ribeirão Preto, Universidade de São Paulo, Ribeirão Preto, São Paulo, Brazil. Natalia Louise Lima and Telma Maria Braga Costa, Nutrição, Universidade de Ribeirão Preto, Ribeirão Preto, São Paulo, Brazil. Marina Rodrigues Barbosa, Laboratório de Fisiologia do Exercício, Departamento de Ciências Fisiológicas, Universidade Federal de São Carlos, São Carlos, São Paulo, Brazil. Paula Carolina Barboni Dantas Nascimento, Centro de Atendimento Multidisciplinar da Defensoria Pública do Estado de São Paulo, Ribeirão Preto, São Paulo, Brazil. Correspondence regarding this article should be directed to: Sebastião Sousa Almeida, Laboratório de Nutrição e Comportamento, Departamento de Psicologia, Faculdade de Filosoia, Ciências e Letras de Ribeirão Preto, Universidade de São Paulo, Av. Bandeirantes, 3900, Monte Alegre, Ribeirão Preto, SP, 14040-901, Brazil. Phone: +55 16 3602 3663. E-mail: [email protected]
Introduction
Food practices are framed by a multilayer process that includes several biological, socio-cultural, and anthropological determinants, and they are shaped by
individual situations (Gedrich, 2003; Jomori, Proença, & Calvo, 2008). They also include both observed practices and subjective aspects such as norms, opinions, values, symbolic representations, and food choices in speciic situations (Garcia, 1997; Poulan & Proença, 2003). Food choices are inluenced by the degree of freedom that each person has (Grunert, 1993); therefore, the choice that an individual makes at a certain moment or in a speciic situation does not necessarily correspond to his/her habitual behavior.
and their opinions, attitudes, values, preferences, and knowledge; Poulan & Proença, 2003).
Food liking is one aspect of food practices and eating behavior that has been recently investigated. One way to assess it is by using a technique that analyzes taste reactivity patterns and involves the careful assessment of hedonic and aversive behavioral reactions that are thought to be universal affective expressions and often correspond to human subjective ratings of palatability (Finlayson, King, & Blundell, 2007). According to these authors, although easy to conduct, these types of tests are considerably different from free-living eating situations. Subjective liking may also be evaluated using analog scales (e.g., the Labeled Affective Magnitude [LAM] scale) in which participants are instructed to mark a line that corresponds to their level of liking after tasting a food (Havermans, Janssen, Giesen, Roefs, & Jansen, 2009; Dressler & Smith, 2013). Nevertheless, the limitations of this methodology include the number of foods presented and tasted, which may lead to sensory fatigue and inluence the participant’s appetite and rating of liking (Dressler & Smith, 2013). Importantly, ratings of liking alone only provide evidence of food preference and cannot predict subsequent intake.
Several instruments and methodologies have been used to study food intake. The best-known of these include food records, 24-h dietary recall, and food frequency questionnaires, each with its own advantages and disadvantages. Food records consist of documenting all of the foods and drinks ingested and their respective quantities during a certain period of time, usually 3 to 7 days. This has been historically considered to be a very precise method that does not depend on memory but requires tremendous commitment and comprehension by the individual. Food records also take substantial time and can lead people to change their eating patterns (Johnson, 2002). Twenty-four-hour dietary recall is a snapshot of what an individual ate the day before. It is a relatively short interview that does not require as much literacy or motivation as the dietary record (Rockett, Berkey, & Colditz, 2003). However, 24-h dietary recall does not provide an accurate picture of habitual food practices. It may assess an atypical day in an individual’s life and depends on memory. Food frequency questionnaires comprise a list of food, and respondents report the frequency of ingesting each item (i.e., the number of times per day, week, or month; Cade, Thompson, Burley, & Warm, 2002). It is a relatively quick and low-cost method, but it depends on memory. Additionally, some of the questionnaires are excessively long and may not contain some types of food (Salvo & Gimeno, 2002; Ribeiro, Sávio, Rodrigues, Costa, & Schmitz, 2006).
According to Harrison & Jackson (2009), attitudes about food are commonly based on preoccupations about health, and food is commonly classiied as “healthy” (paired with descriptors such as “good”) and “unhealthy” (paired with descriptors such as “bad”). Thus, instruments that can identify a person’s
knowledge about what is healthy and unhealthy are useful. Food knowledge has been related to food practices (Watson, Kwon, Nichols, & Rew, 2009). Some authors have suggested that a person’s diet can be inappropriate without suficient knowledge (Lin, Hang, Yang, & Hung, 2011). Usually, this information is assessed by questionnaires such as the one developed by Parmenter & Wardle (1999), which covers current dietary recommendations, sources of nutrients, everyday food choices, and diet-disease relationships. Another questionnaire developed by Anderson, Bell, Adamson, & Moynihan (2002) assesses knowledge about applied nutrition. Nevertheless, these methods require high literacy and take much time to administer.
Another way to assess food practices, one that is rarely used but has numerous advantages, is the picture-sort food instrument. One of the irst such instruments was proposed by Kumanyika, Tell, Fried, Martel, & Chinchilli (1996) and Kumanyika, Tell, Shemanski, Martel, & Chinchilli (1997) to be used in adults. It comprises a set of foods and drinks represented as pictures on cards, and individuals are required to report the consumption frequency and portion size for each food. Jonsson, Gummeson, Conner, & Svensson (1998) and Yaroch, Resnicow, Davis, Davis, Smith, & Khan (2000) subsequently developed and tested similar instruments for children and adolescents, respectively. This method considers cognitive factors, reduces literacy demands, is more pleasant to the respondents, may be applicable to cross-cultural studies, and is quicker to administer than other methodologies (Kumanyika et al., 1996, 1997; Yaroch et al., 2000). Likewise, the photographs may be adapted to various questions (Jonsson et al., 1998).
In research on aspects of food practices, the selection and development of instruments are critical factors in the delineation process (Slater, Philippi, Marchioni, & Fisberg, 2003). The selection of the proper tool for a particular study must consider the motivation, cognitive ability, and literacy level of the participants, size and location of the population to be studied, amount of funding for the study, and details about the nutrients and food (Rockett et al., 2003). Additionally, a successful instrument needs to be relatively short, easily administered, inexpensive, accurate, and usable in a broad range of subpopulations.
description and justiication of the content; by careful construction of items, response formats and layout; and by independent reviews from a panel of experts on both content and interpretability.” Construct validity, also referred to as discriminatory validity, may be assessed by applying the instrument in two different groups and comparing the outcomes, which must present distinct results (Feren, Torheim, & Lillegaard, 2011). Criterion validity indicates whether the construct is signiicantly and substantively correlated with measures of behavior (Sapp & Jensen, 1997) in which the instrument being tested is often compared with another preexisting method. Several authors agree that the most acceptable approach to determine the criterion validity of tools that are designed to measure energy intake is the Doubly Labeled Water method (Schoeller, Ravussin, Schutz, Acheson, Baertschi, & Jequier, 1986; Hill & Davies, 2001; Johnson, 2002; Raymond, Peterson, Bartholome, Raatz, Jensen, & Levine, 2012). However, because it is expensive, requires a high level of technical and analytical expertise, and is associated with the challenge of collecting daily urine samples from the subjects, this level of evaluation is rare (Collins et al., 2013).
Importantly, not all validation processes can be conducted for some outcomes, but repeatability can be assessed (Parmenter & Wardle, 2000; Wilson, Magarey, & Mastersson, 2008). Scales that are designed to measure abstract attributes such as knowledge and attitudes may have content and construct validity explored but not criterion validity (for review, see Parmenter & Wardle, 2000). The reproducibility or reliability of data consists of applying the instrument in the same group of people at least twice after a speciic period of time, often 15 days to 1 month. Despite its importance, the assessment of test-retest reliability was not performed for the picture-sort food instruments mentioned above. The only exception is the instrument developed by Yaroch et al. (2000) that presented low reliability, ranging from 0.28 to 0.36 during a 2-week period. Cade et al. (2002) reviewed studies of the development, validation, and utilization of food-frequency questionnaires and concluded that less than half of the instruments had their reproducibility tested; among those that were tested, correlation coeficients between 0.5 and 0.7 were the most common.
Valid information about food practices and food choices and knowledge about healthy diets are essential bases for nutritional recommendations, public health policies, and epidemiological research on the relationships between food practices and a person’s general health (Hill & Davies, 2001). However, exploration of these aspects requires the use of several distinct instruments that are often long and exhaustive and demand high literacy in the target population. Thus, the present study sought to develop a rapid assessment tool—the Food Photographs Scale—that qualiies individuals’ food choices, consumption, and knowledge as “healthy” or “less healthy” and tested its reliability in young adults as an initial step in its adaptation process.
Methods
Development of the Food Photographs Scale
The irst consideration when developing the scale was the meal that would be represented. After a long discussion among experts in the ields of nutrition and psychology, afternoon snacks were chosen because they are a quick meal that is generally composed of only a few items, which would allow the scale to have less food variability. We then selected the items that would comprise the instrument. This procedure was conducted by two nutritionists and one psychologist who considered foods that are typically consumed as part of this meal in this speciic population. Such foods were identiied by previous studies (Marcondelli, Costa, & Schmitz, 2008; Monteiro, Andrade, Zanirati, & Silva, 2009). The nutritional content of each item was also considered.
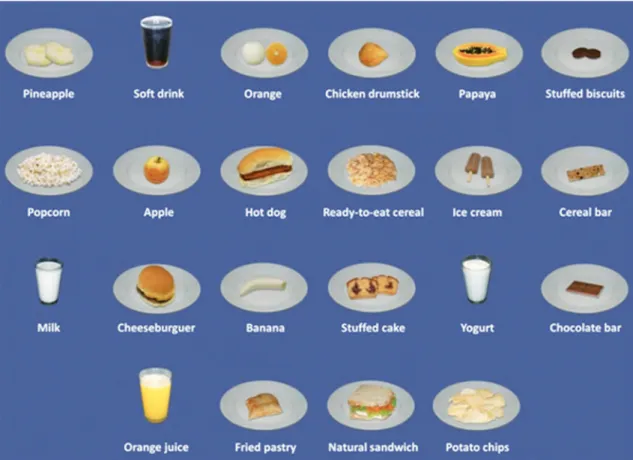
Table 1 presents the nutrient composition of the items selected according to the U.S. Department of Agriculture National Nutrient Database for Standard Reference (U.S. Department of Agriculture, Agricultural Research Service, 2001). The items “natural sandwich,” “chicken drumstick,” and “fried pastry” were absent in the American database; thus the nutritional content of these foods were described using the Brazilian Table of Food Composition sponsored by the Brazilian Ministry of Health (Center for Studies and Research on Foods, 2011). We considered the amount of energy, fat (i.e., saturated fat, unsaturated fat, and cholesterol), and iber contained in the food. Twenty-two items were selected and divided into two groups: “healthy” and “less healthy” (11 items each). The “healthy” group consisted of pineapple, apple, natural fruit juice, papaya, orange, banana, ready-to-eat cereal, yogurt, milk, cereal bar, and natural sandwich (i.e., made of whole-wheat bread, lettuce, carrot, and ricotta). Notice that the majority of these items provide few calories and have a low quantity of fat and reasonable iber content. The ready-to-eat cereal is more caloric but has no fat and has a high iber content. The cereal bar is highly energetic but provides a good source of unsaturated fat and iber. Additionally, we included dairy products in this group. Although they presented a high fat content and no iber, they are considered functional foods that are replete with bioactive peptides, probiotic bacteria, antioxidants, highly absorbable calcium, conjugated linoleic acid, and other biologically active components (Campos, 2013).
The “less healthy” group consisted of soft drink, chocolate ice cream, stuffed cake, hot dog, cheeseburger, chicken drumstick, stuffed biscuits, fried pastry (i.e., made of wheat lour and illed with cheese, meat, or other illings), chocolate bar, potato chips, and popcorn. All of these items are extremely caloric and have a high amount of fat, especially saturated fat and cholesterol.
presented in their inal form (i.e., ready to eat). No packaging was shown, and all photographs correspond to one portion of the food, deined according to the parameters proposed by Monteiro & Chiarello (2007). Foods were photographed and passed through image-processing software to improve picture quality. Each item was transformed into a 5.12 × 5.12 inch color photograph and covered by rigid transparent plastic with a blue background (Figure 1).
The instrument should be presented in a random order, and the participants must select three items from the set of photos that they would like to eat as an afternoon snack and three items that they considered healthy. The participants should also select the foods that comprise the meal that they usually eat. The main aim of the scale is to classify answers as “healthy” and “less healthy” to provide qualitative data. Therefore, the choices should be classiied according to the majority of the answers (i.e., “healthy” is denoted when two or three items are from this group, and “less healthy” is denoted when two or three foods are from this group). Importantly, the participants are not aware that this response classiication
will be done. With regard to the third question (i.e., what the participants usually eat), in cases in which no items match their usual snack, the subjects should be oriented toward selecting a similar item.
Test-retest reliability analysis
A convenience sample of 101 college students (51 males and 50 females) from different courses at a private university in a city in the state of São Paulo, Brazil participated in the study. The sample size was based on the review by Cade et al. (2002) and previous studies that used the same methodology. The participants’ ages ranged from 19 to 32 years. The inclusion criteria included age >18 years and being enrolled in one of the courses offered by the university. No participant attrition occurred between the two time-points of the study. Participation was completely voluntary and no rewards were given. Anthropometric characteristics of the sample are presented in Table 2.
The study was approved by the Academic and Ethics Committee of the University of Ribeirão Preto (UNAERP) and informed consent was obtained from all
Table 1. Nutritional content per 100 g of the items on the scale
Item Energy
(kcal)
Protein (g)
Total lipids (fat)
(g)
Saturated fatty acids
(g)
Unsaturated fatty acids
(g)
Cholesterol (mg)
Carbohydrates (g)
Total
iber
(g)
Healthy
Pineapple 48 .54 .12 .01 .06 — 12.63 1.40
Apple 52 .26 .17 .03 .06 — 13.81 2.40
Natural fruit juice 45 .70 .20 .02 .07 — 10.40 .20
Papaya 43 .47 .26 .08 .12 — 10.82 1.70
Orange 63 1.30 .30 .03 .11 — 15.5 4.50
Banana 89 1.09 .33 .11 .10 — 22.84 2.60
Ready-to-eat cereal 357 7.50 .40 .12 .26 — 84.10 3.30
Yogurt 61 3.47 3.25 2.09 .98 13.00 4.66 —
Milk 64 3.28 3.66 2.28 1.19 14.00 4.65 —
Cereal bar 409 9.09 9.09 - 8.62 — 72.73 1.80
Natural sandwich* 159 8.79 4.68 2.05 1.77 24.5 19.29 3.83
Less Healthy
Soft drink 42 — — — — — 10.6 —
Chocolate ice cream 216 3.80 11.00 6.80 3.62 34.00 28.20 1.20
Stuffed cake 371 5.66 14.33 9.16 5.16 — 55.00 1.33
Hot dog 247 10.60 14.84 5.21 8.73 45.00 18.4 —
Cheeseburger 313 14.48 14.85 6.34 7.17 49.00 31.13 —
Chicken drumstick* 274 13.41 16.88 2.60 8.10 15.00 16.54 .88
Stuffed biscuits 466 5.33 19.08 3.68 12.89 .00 71.64 2.90
Fried pastry* 388 10.10 20.10 4.80 13.5 25.00 43.80 1.00
Chocolate bar 505 3.90 34.20 20.08 12.21 4.65 59.59 5.5
Potato chips 543 5.60 36.60 12.90 15.90 — 51.20 2.50
Popcorn 583 7.29 43.55 6.82 33.00 — 45.06 8.10
Figure 1. Food Photographs Scale.
Table 2. Descriptive anthropometric characteristics of the sample by gender (n = 101)
Sample Men Women Total
n 51 50 101
Age (years)
Mean 22.41 22.82 22.61
SEM .30 .35 .23
95% CI 21.80-23.02 22.11-23.52 22.15-23.07
Range 19.0-30.0 20.0-32.0 19.0-32.0
Weight (kg)
Mean 77.96 63.42 70.76
SEM 1.25 1.35 1.17
95% CI 75.45-80.46 60.70-66.13 68.44-73.08
Range 62.5-94.0 48.0-88.6 48.0-94.0
Height (m)
Mean 1.77 1.66 1.72
SEM .01 .01 .01
95% CI 1.75-1.79 1.63-1.67 1.69-1.73
Range 1.60-1.92 1.54-1.77 1.54-1.92
Body mass index (kg/m2)
Mean 24.85 23.17 24.02
SEM .39 .49 .32
95% CI 24.06-25.62 22.18-24.14 23.37-24.65 Range 19.01-30.69 17.57-31.70 17.57-31.70
CI, conidence interval.
participants. Data were collected in a private room on the campus at two different times by a single researcher. During the irst time-point of the study (i.e., test), the students were asked to participate by the researcher. After agreeing to participate, the test was conducted in the room. The participants were introduced to the Food Photographs Scale.After answering all of the questions, the participants’ weights and heights were measured.
The second time-point of the study (i.e., re-test) occurred exactly 1 month later. The participants were contacted by the researchers and requested to attend at a speciic time and location. The participants were asked to again answer the same three questions.
Statistical analysis
(2010): κ = 1.0 indicates perfect reproducibility, κ > 0.75 indicates excellent reproducibility, 0.4 ≤ κ ≤ 0.75 indicates good reproducibility, and 0 ≤ κ ≤ 0.4 indicates marginal reproducibility.
Results
The reliability results of the scale for each question are presented in Table 3. High consistency was found for all of the questions (κ > .70), indicating good agreement between food choices in the test-retest evaluation. Perfect reliability (κ = 1.0) was found among men when asked to select what they would like to eat. Perfect reliability was also found among men and women when asked to select foods they considered “healthy.” Excellent reliability (κ > .75) was found among women and the total sample for foods they would like to eat and among men and women for what they usually eat.
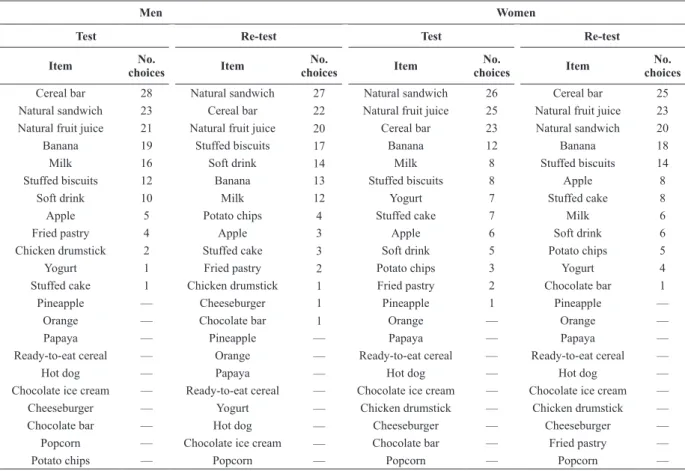
Tables 4, 5, and 6 present the number of times each item was chosen by men and women in response to each question in both applications of the instrument. Although some foods were chosen more or fewer times between the two applications of the instrument, the items were generally the same.
Discussion
In the present study we sought to develop a single, rapid assessment tool that qualiies individual food choices, consumption, and knowledge as “healthy” or “less healthy” and test its reliability in young adults. The perfect/excellent test-retest reliability results indicated that the measures remained unchanged 1 month after the irst application of the instrument. Therefore, the instrument presented reliable and trustworthy data in the evaluation of food choices and consumption. The scale was also able to assess a person’s knowledge about healthy foods.
The relevance of studying food habits is largely known. Using the instrument proposed herein, qualifying individuals’ diets is possible, and populations can be identiied that are at risk for developing health problems. The evaluation of possible associations between food consumption and health conditions is also possible. Little attention has been given to a person’s food choices in speciic situations. Such questions are important when considering that people choose food in a context-dependent manner (Falk, Sobal, Bisogni, Connors, & Devine, 2001). Therefore, a measure that allows the qualiication of choices under experimental or “real” conditions may be useful for identifying food choices in various situations. For example, within the food-choice kaleidoscope, photographs can be used to evaluate foods and beverages that are consumed (i.e., product), the contextual/environmental inluences on choices (i.e., place), and how individuals differ with regard to their consumption (i.e., person; Jaeger et al., 2011). A practical application of the instrument within this perspective is the study by Laus (2013) who evaluated the effect of thin media images on undergraduates’ food choices. The author asked men and women to select three items from the set of 22 foods that they would like to eat as an afternoon snack. The participants were then presented with images of individuals who represented the ideal body propagated by the media. The participants were then asked again to select the food that they would like to eat. The results from this study demonstrated that the scale was able to assess students’ choices and capture differences between the two times of evaluation.
Evaluating individual’s knowledge about healthy and unhealthy foods is also important in which the classiication of foods is a critical component of the process of making food choices. Consciousness about what is good or not good for health has been identiied as frequently occurring when selecting everyday food (Falk et al., 2001). Harrison & Jackson (2009) discussed what makes a food “healthy.” In their study, young participants maintained that healthy foods are natural and nutritious (i.e., the foods have nothing “bad” added and nothing removed). Unlike healthy foods, unhealthy foods were thought to be artiicial and unnatural (i.e., foods that are processed or contain artiicial ingredients or excessive sugar or fat). All of the participants in our study demonstrated that they knew what is or is
Table 3. Absolute frequency on test-retest of food choices and kappa coeficients for the Food Photographs Scale
Sample Men Women Total
n 51 50 101
Would like to eat (test)
Healthy 12 10 22
Less healthy 39 40 79
Would like to eat (re-test)
Healthy 12 9 21
Less healthy 39 41 80
Kappa coeficient (κ) 1.0* .935* .942*
Considered healthy (test)
Healthy 51 50 101
Less healthy — — —
Considered healthy (re-test)
Healthy 51 50 101
Less healthy — — —
Kappa coeicient (κ) 1.0* 1.0* 1.0*
Usually eat (test)
Healthy 29 36 65
Less healthy 22 14 36
Usually eat (re-test)
Healthy 34 38 72
Less healthy 17 12 29
Kappa coeficient (κ) .794* .896* .708*
Table 4. Number of times each item was selected at the two time-points of the study by men and women when asked to select the three items they would like to eat
Men Women
Test Re-test Test Re-test
Item choicesNo. Item choicesNo. Item choicesNo. Item choicesNo.
Soft drink 19 Soft drink 18 Natural fruit juice 16 Natural fruit juice 18
Cereal bar 14 Natural fruit juice 15 Soft drink 14 Soft drink 16
Natural fruit juice 14 Natural sandwich 14 Stuffed cake 13 Yogurt 13
Potato chips 14 Cheeseburger 13 Yogurt 12 Popcorn 12
Cheeseburger 13 Stuffed biscuits 12 Natural sandwich 10 Natural sandwich 11
Natural sandwich 12 Cereal bar 9 Popcorn 9 Stuffed cake 11
Stuffed cake 10 Chocolate bar 9 Cereal bar 8 Chocolate ice cream 10
Stuffed biscuits 9 Chocolate ice cream 8 Hot dog 8 Hot dog 9
Yogurt 7 Potato chips 8 Chocolate ice cream 8 Chocolate bar 9
Chocolate bar 6 Hot dog 7 Chocolate bar 8 Stuffed biscuits 8
Popcorn 5 Apple 6 Fried pastry 8 Cereal bar 7
Milk 4 Ready-to-eat cereal 6 Cheeseburger 6 Cheeseburger 7
Apple 4 Stuffed cake 6 Pineapple 5 Pineapple 5
Ready-to-eat cereal 4 Banana 5 Chicken drumstick 5 Banana 3
Hot dog 4 Chicken drumstick 4 Potato chips 5 Potato chips 3
Chocolate ice cream 4 Popcorn 4 Banana 4 Milk 2
Chicken drumstick 4 Yogurt 3 Stuffed biscuits 4 Apple 2
Papaya 2 Fried pastry 3 Milk 2 Fried pastry 2
Banana 2 Milk 2 Apple 2 Orange 1
Orange 1 Pineapple 1 Orange 2 Chicken drumstick 1
Fried pastry 1 Orange — Papaya 1 Papaya —
Pineapple — Papaya — Ready-to-eat cereal — Ready-to-eat cereal —
Table 5. Number of times each item was selected at the two time-points of the study by men and women when asked to select the items they usually eat
Men Women
Test Re-test Test Re-test
Item choicesNo. Item choicesNo. Item choicesNo. Item choicesNo.
Cereal bar 28 Natural sandwich 27 Natural sandwich 26 Cereal bar 25
Natural sandwich 23 Cereal bar 22 Natural fruit juice 25 Natural fruit juice 23
Natural fruit juice 21 Natural fruit juice 20 Cereal bar 23 Natural sandwich 20
Banana 19 Stuffed biscuits 17 Banana 12 Banana 18
Milk 16 Soft drink 14 Milk 8 Stuffed biscuits 14
Stuffed biscuits 12 Banana 13 Stuffed biscuits 8 Apple 8
Soft drink 10 Milk 12 Yogurt 7 Stuffed cake 8
Apple 5 Potato chips 4 Stuffed cake 7 Milk 6
Fried pastry 4 Apple 3 Apple 6 Soft drink 6
Chicken drumstick 2 Stuffed cake 3 Soft drink 5 Potato chips 5
Yogurt 1 Fried pastry 2 Potato chips 3 Yogurt 4
Stuffed cake 1 Chicken drumstick 1 Fried pastry 2 Chocolate bar 1
Pineapple — Cheeseburger 1 Pineapple 1 Pineapple —
Orange — Chocolate bar 1 Orange — Orange —
Papaya — Pineapple — Papaya — Papaya —
Ready-to-eat cereal — Orange — Ready-to-eat cereal — Ready-to-eat cereal —
Hot dog — Papaya — Hot dog — Hot dog —
Chocolate ice cream — Ready-to-eat cereal — Chocolate ice cream — Chocolate ice cream —
Cheeseburger — Yogurt — Chicken drumstick — Chicken drumstick —
Chocolate bar — Hot dog — Cheeseburger — Cheeseburger —
Popcorn — Chocolate ice cream — Chocolate bar — Fried pastry —
Table 6. Number of times each item was selected at the two time-points of the study by men and women when asked to select the three items considered healthy
Men Women
Test Re-test Test Re-test
Item No.
choices Item
No.
choices Item
No.
choices Item
No. choices
Natural sandwich 25 Papaya 23 Yogurt 20 Apple 20
Ready-to-eat cereal 24 Natural sandwich 22 Pineapple 18 Natural fruit juice 17
Natural fruit juice 19 Milk 19 Cereal bar 18 Pineapple 16
Papaya 18 Ready-to-eat cereal 18 Natural sandwich 17 Milk 16
Orange 14 Banana 16 Apple 16 Banana 15
Yogurt 13 Natural fruit juice 14 Milk 14 Natural sandwich 14
Banana 12 Pineapple 12 Papaya 12 Papaya 14
Milk 11 Orange 12 Natural fruit juice 11 Cereal bar 12
Pineapple 8 Cereal bar 7 Banana 10 Orange 12
Cereal bar 5 Apple 7 Orange 9 Yogurt 11
Apple 4 Yogurt 3 Ready-to-eat cereal 5 Ready-to-eat cereal 3
Hot dog — Hot dog — Hot dog — Hot dog —
Chocolate ice
cream —
Chocolate ice
cream —
Chocolate ice
cream —
Chocolate ice
cream —
Stuffed cake — Stuffed cake — Stuffed cake — Stuffed cake —
Chicken drumstick — Chicken drumstick — Chicken drumstick — Chicken drumstick —
Cheeseburger — Cheeseburger — Cheeseburger — Cheeseburger —
Stuffed biscuits — Stuffed biscuits — Stuffed biscuits — Stuffed biscuits —
Chocolate bar — Chocolate bar — Chocolate bar — Chocolate bar —
Fried pastry — Fried pastry — Fried pastry — Fried pastry —
Soft drink — Soft drink — Soft drink — Soft drink —
Popcorn — Popcorn — Popcorn — Popcorn —
Potato chips — Potato chips — Potato chips — Potato chips —
not healthy. However, when asked about the food they would like to eat, the majority of the participants (n = 79) selected less healthy items. Moreover, more than a third of the participants reported that they usually eat this kind of food.
Such information is extremely useful in the area of public health because knowledge is not necessarily related to healthy eating habits, leading to the necessity of reevaluating campaigns to improve people’s diets through nutritional education alone. Actual programs may be too focused on prevention via information. As suggested by Harrison & Jackson (2009), focus should be placed on motivation, meaning, values, and attitudes toward dietary habits as a means of understanding these behaviors.
The proposed method has several limitations. It depends on the individual’s memory when used to qualify usual consumption. It also does not quantify people’s intake and has a limited number of food items. Incomplete data related to the validity of the scale is also a limitation. Although testing criterion validity is not possible in measures that assess nutritional knowledge and food choices, content and construct validity can be investigated. Thus, studies of this nature should be conducted with the present scale. Finally, test-retest reliability assessed in the present study cannot detect the existence of systematic error. One problem with using the identical test for test-retest reliability is that
individuals may learn from the irst administration and carry such learning over to the next session (Talmage & Rasher, 1981).
Conclusion
Despite its limitations, the Food Photographs Scale can provide information about whether subjects usually consume “healthy” foods and classify this trait with regard to foods that individuals choose in speciic situations. The scale also provides information about a person’s knowledge about healthy foods. Importantly, the Food Photographs Scale is not an instrument that is intended to explain the responses to these questions but rather describe them. As cited elsewhere, methodologies that utilize food photographs have numerous advantages. They require a lower literacy level and engage the participant. They can be used for different subpopulations and different ages, and the time necessary for administration is less than or equal to the time required for other instruments. Moreover, the scale proposed herein may be adapted to several situations, conditions, and populations. Researchers interested in using this methodology may increase the number of items including country/location-speciic foods or adapt it for use with different ranges of ages.
had reliability in the present context for investigations that involve food choice and consumption and people’s knowledge about healthy foods.
Acknowledgements
The authors are grateful to the National Council for Scientiic and Technological Development (CNPq; Process no. 141455/2009-8) and University of Ribeirao Preto for inancial support.
References
Anderson, A. S., Bell, A., Adamson, A., & Moynihan, P. (2002). A questionnaire assessment of nutrition knowledge: Validity and reliability issues. Public Health Nutrition, 5(3), 497-503.
Cade, J., Thompson, R., Burley, V., & Warm, D. (2002). Development, validation and utilisation of food-frequency questionnaires: A review. Public Health Nutrition, 5(4), 567-587.
Campos, L. (2013). Campaña Panamericana de consume de lácteos— Benefícios dos produtos lácteos no tratamento e prevenção da
hipertensão e diabetes [Beneits of dairy products for the treatment
and prevention of hypertension and diabetes]. [http://www. produccion-animal.com.ar/produccion_bovina_de_leche/leche_ subproductos/07-Licinia_de_Campos.pdf; accessed May 23, 2013] Center for Studies and Research on Foods (2011). Tabela Brasileira
de composição de alimentos [Brazilian table of food composition].
Campinas: NEPA-UNICAMP. [www.unicamp.br/nepa/taco;
accessed May 23, 2013]
Collins, C. E., Burrows, T. L., Truby, H., Morgan, P. J., Wright, I. M.
R., Davies, P. S. W., & Callister, R. (2013). Comparison of energy intake in toddlers assessed by food frequency questionnaire and total energy expenditure measured by the doubly labeled water method.
Journal of the Academy of Nutrition and Dietetics, 113(3), 459-463. Dressler, H., & Smith, C. (2013). Food choice, eating behavior, and
food liking differs between lean/normal and overweight/obese, low-income women. Appetite, 65(1), 145-152.
Falk, L. W., Sobal, J., Bisogni, C. A., Connors, M., & Devine, C. M.
(2001). Managing healthy eating: Deinitions, classiications, and
strategies. Health Education & Behavior, 28(4), 425-439.
Feren, A., Torheim, L. E., & Lillegaard, I. T. L. (2011). Development
of a nutrition knowledge questionnaire for obese adults. Food & Nutrition Research, 55, doi: 10.3402/fnr.v55i0.7271.
Finlayson, G., King, N., & Blundell, J. E. (2007). Liking vs. wanting food: importance for human appetite control and weight regulation.
Neuroscience and Biobehavioral Reviews, 31(7), 987-1002.
Garcia, R. W. D. (1997). Representações sociais da alimentação e saúde e suas repercussões no comportamento alimentar [Social representations of health and nutrition and its effects on eating behavior]. PHYSIS: Revista de Saúde Coletiva, 7(2), 51-68. Gedrich, K. (2003). Determinants of nutritional behaviour: A multitude
of levers for successful intervention? Appetite, 41(3), 231-238. Grunert, K. G. (1993). Towards a concept of food-related life style.
Appetite, 21(2), 151-155.
Harrison, M., & Jackson, L. A. (2009). Meanings that youth associate with healthy and unhealthy food. Canadian Journal of Dietetic Practice and Research, 70(1), 6-12.
Havermans, R. C., Janssen, T., Giesen, J. C. A. H., Roefs, A., &
Jansen, A. (2009). Food liking, food wanting, and sensory-speciic
satiety. Appetite, 52(1), 222-225.
Hill, R. J., & Davies, P. S. W. (2001). The validity of self-reported energy intake as determined using the doubly labelled water technique. British Journal of Nutrition, 85(4), 415-430.
Jaeger, S. R., Bava, C. M., Worch, T., Dawson, J., & Marshall, D. W. (2011). The food choice kaleidoscope: a framework for structured description of product, place and person as sources of variation in food choices. Appetite, 56(2), 412-423.
Johnson, R. K. (2002). Dietary intake: How do we measure what people are really eating? Obesity Research, 10(Suppl. 1), 63S-68S. Jomori, M. M., Proença, R. P. C., & Calvo, M. C. M. (2008).
Determinantes da escolha alimentar [Food choice factors]. Revista de Nutrição, 21(1), 63-73.
Jonsson, I., Gummeson, L., Conner, M., & Svensson, E. (1998). Assessing
food choice in school children: Reliability and construct validity of a method stacking food photographs. Appetite, 30(1), 25-37.
Kumanyika, S., Tell, G. S., Fried, L., Martel, J. K., & Chinchilli, V. M. (1996). Picture-sort method for administering a food frequency questionnaire to older adults. Journal of the American Dietetic Association, 96(2), 137-144.
Kumanyika, S., Tell, G. S., Shemanski, L., Martel, J., & Chinchilli, V. M. (1997). Dietary assessment using a picture-sort approach.
American Journal of Clinical Nutrition, 65(Suppl.), 1123S-1129S.
Laus M. F. (2013). Inluência do padrão de beleza veiculado pela
mídia na satisfação corporal e escolha alimentar de adultos
[Inluence of the standard of beauty transmitted by the media on
body satisfaction and food choice in adults]. Unpublished doctoral
thesis. São Paulo: University of São Paulo.
Lin, W., Hang, C. M., Yang, H. C., & Hung, M. H. (2011). 2005-2008 Nutrition and Health Survey in Taiwan: the nutrition knowledge, attitude and behavior of 19-64 year old adults. Asia Paciic Journal
of Clinical Nutrition, 20(2), 309-318.
Magarey, A., Watson, J., Golley, R. K., Burrows, T., Sutherland, R., McNaughton, S. A., Denney-Wilson, E., Campbell, K., & Collins, C. (2011). Assessing dietary intake in children and adolescents: considerations and recommendations for obesity research. International Journal of Pediatric Obesity, 6(1), 2-11. Marcondelli, P., Costa, T. H. M., & Schmitz, B. A. S. (2008). Nível de
atividade física e hábitos alimentares de universitários do 3º ao 5º semestres da área da saúde [Physical activity level and food intake habits of university students from 3 to 5 semester in the health area]. Revista de Nutrição, 21(1), 39-47.
Masson, L. F., McNeil, G., Tomany, J. O., Simpson, J. A., Peace, H. S., Wei, L., Grubb, D. A., & Bolton-Smith, C. (2003). Statistical approaches for assessing the relative validity of a food-frequency
questionnaire: use of correlation coeficients and the kappa
statistics. Public Health Nutrition, 6(3), 313-321.
Monteiro, J. P., & Chiarello, P. G. (2007). Consumo alimentar:
visualizando porções [Food consumption: Visualizing portions].
Rio de Janeiro: Guanabara Koogan.
Monteiro, M. R. P., Andrade, M. L. O., Zanirati, V. F., & Silva, R. R. (2009). Hábito e consumo alimentar de estudantes do sexo feminino dos cursos de nutrição e de enfermagem de uma universidade pública brasileira [Eating habits and intake of female students of nutrition and nursing in a Brazilian public university].
Revista APS, 12(3), 271-277.
Parmenter, K., & Wardle, J. (2000). Evaluation and design of nutrition knowledge measures. Journal of Nutrition Education, 32(5), 269-277.
Poulain, J., & Proença, R. P. C. (2003). Relexões metodológicas para
o estudo das práticas alimentares [Methodological approaches on the studies of food practices]. Revista de Nutrição, 16(4), 365-386. Raymond, N. C., Peterson, R. E., Bartholome, L. T., Raatz, S. K.,
Jensen, M. D., & Levine, J. A. (2012). Comparisons of energy intake and energy expenditure in overweight and obese women with and without binge eating disorder. Obesity, 20(4), 765-772. Ribeiro, A. C., Sávio, K. E. O., Rodrigues, M. L. C. F., Costa, T. H.
M., & Schmitz, B. A. S. (2006). Validação de um questionário de
frequência de consumo alimentar para população adulta [Validation
of a food frequency questionnaire for the adult population]. Revista de Nutrição, 19(5), 553-562.
Rockett, H. R. H., Berkey, C. S., & Colditz, G. A. (2003). Evaluation of dietary assessment instruments in adolescents. Current Opinion in Clinical Nutrition and Metabolic Care, 6(5), 557-562. Rosner, B. A. (2010). Fundamentals of biostatistics. Belmont: Paciic
Grove.
Salvo, V. L. M. A., & Gimeno, S. G. A. (2002). Reprodutibilidade e
validade do questionário de frequência de consumo de alimentos
[Reproducibility and validity of a food frequency questionnaire].
Revista de Saúde Pública, 36(4), 505-512.
Sapp, S. G., & Jensen, H. H. (1997). Reliability and validity of nutrition knowledge and diet-health awareness tests developed from the 1989-1991 Diet and Health Knowledge Surveys. Journal of Nutrition Education, 29(2), 63-72.
Schoeller, D. A., Ravussin, E., Schutz, Y., Acheson, K. J., Baertschi, P., & Jequier, E. (1986). Energy expenditure by doubly labeled water: Validation in humans and proposed calculation. American Journal of Physiology: Regulatory, Integrative, and Comparative
Physiology, 250(5 Pt 2), R823-R830.
Slater, B., Philippi, S. T., Marchioni, D. M. L., & Fisberg, R. M.
(2003). Validação de Questionários de Frequência Alimentar—
Talmage, H., & Rasher, S. P. (1981). Validity and reliability issues in measurement instrumentation. Journal of Nutrition Education, 13(3), 83-85.
U.S. Department of Agriculture, Agricultural Research Service (2001). National Nutrient Database for Standard Reference: Release 25. [http://ndb.nal.usda.gov/ndb/search/list; accessed May 23, 2013] Watson, L. C., Kwon, J., Nichols, D., & Rew, M. (2009). Evaluation
of the nutrition knowledge, attitudes, and food consumption behaviors of high school students before and after completion of a nutrition course. Family and Consumer Sciences Research Journal, 37(4), 523-534.
Wilson, A. M., Magarey, A. M., & Mastersson, N. (2008). Reliability and relative validity of a child nutrition questionnaire to simultaneously assess dietary patterns associated with positive energy balance and food behaviours, attitudes, knowledge and environments associated with healthy eating. International Journal of Behavioral Nutrition and Physical Activity, 5(1), 5.
Yaroch, A. L., Resnicow, K., Davis, M., Davis, A., Smith, M, &
Khan, L. K. (2000). Development of a modiied picture-sort food