www.atmos-chem-phys.net/16/14825/2016/ doi:10.5194/acp-16-14825-2016
© Author(s) 2016. CC Attribution 3.0 License.
Temporal variability and sources of VOCs in urban areas of the
eastern Mediterranean
Christos Kaltsonoudis1,2, Evangelia Kostenidou1, Kalliopi Florou1,2, Magda Psichoudaki1,2, and Spyros N. Pandis1,2,3
1Institute of Chemical Engineering Sciences, ICE-HT, Patras, 26500, Greece 2Department of Chemical Engineering, University of Patras, Patras, 26504, Greece
3Department of Chemical Engineering, Carnegie Mellon University, Pittsburgh, 15213, USA
Correspondence to:Spyros N. Pandis ([email protected])
Received: 26 April 2016 – Published in Atmos. Chem. Phys. Discuss.: 19 May 2016 Revised: 20 September 2016 – Accepted: 23 October 2016 – Published: 29 November 2016
Abstract.During the summer of 2012 volatile organic com-pounds (VOCs) were monitored by proton transfer reaction mass spectrometry (PTR-MS) in urban sites, in Athens and Patras, two of the largest cities in Greece. Also, during the winter of 2013, PTR-MS measurements were conducted in the center of the city of Athens. Positive matrix factoriza-tion (PMF) was applied to the VOC measurements to gain insights about their sources.
In summer most of the measured VOCs were due to bio-genic and traffic emissions. Isoprene, monoterpenes, and sev-eral oxygenated VOCs (oVOCs) originated mainly from veg-etation either directly or as oxidation products. Isoprene av-erage concentrations in Patras and Athens were 1 and 0.7 ppb respectively, while the monoterpene concentrations were 0.3 and 0.9 ppb respectively. Traffic was the main source of aro-matic compounds during summer. For Patras and Athens the average concentrations of benzene were 0.1 and 0.2 ppb, of toluene 0.3 and 0.8 ppb, and of the xylenes 0.3 and 0.7 ppb respectively.
Winter measurements in Athens revealed that biomass burning used for residential heating was a major VOC source contributing both aromatic VOCs and biogenic compounds such as monoterpenes. Several episodes related to biomass burning were identified and emission ratios (ERs) and emis-sion factors (EFs) were estimated.
1 Introduction
VOCs play an important role in atmospheric chemistry. Their reactions with hydroxyl (OH) radicals, ozone (O3), and ni-trate (NO3)radicals produce secondary gas- and particulate-phase species (Atkinson, 2000; Hallquist et al., 2009). Many of the VOCs present in the atmosphere have adverse effects on human health (Kampa end Castanas, 2008) ,with expo-sure to compounds such as benzene, formaldehyde, and ac-etaldehyde having been related to cancer (Flesca et al., 1999). The European Commission has established an average an-nual limit of 1.5 ppb for benzene.
VOCs may originate from both natural and anthropogenic sources. Vegetation (Kesselmeier and Staudt, 1999; Gold-stein and Galbally, 2007), volcanoes (Tassi et al., 2009, 2013), and marine emissions from the decay of organic mat-ter (Kettle and Adreade, 2000; Meskhidze and Nenes, 2006; Colomb et al., 2008) are some of the natural sources that contribute significantly to the global VOC budget. Anthro-pogenic emissions originate mainly from the use and produc-tion of fossil fuels, industrial processes, and biofuel combus-tion. Biomass burning also contributes substantially both at the regional and global scales (Crutzen and Andreae, 1990; Karl et al., 2007; Koppmann, 2007).
Several campaigns focusing on VOC levels have been con-ducted in the Mediterranean Basin. Holzinger et al. (2005) reported secondary production of methanol and acetone in biomass burning plumes over the eastern Mediterranean dur-ing the MINOS campaign. PTR-MS measurements durdur-ing summer in the background site of Finokalia (Crete, Greece) (Salisbury et al., 2003) indicated methanol, acetone, ace-tonitrile, benzene, and toluene concentrations of 3.3–6.1, 2.9–4.5, 0.15–0.44, 0.13–0.38, and 0.04–0.08 ppb respec-tively. Davison et al. (2009) studied the concentration and fluxes of biogenic VOCs in a Mediterranean ecosystem in western Italy during May–June 2007. Median concentra-tions of 1.6–3.5 ppb for methanol, 0.4–1.3 ppb for acetalde-hyde, 1.0–2.0 ppb for acetone, 0.1–0.14 ppb for isoprene, and 0.2–0.3 ppb for the monoterpenes were reported. Seco et al. (2011) compared the summer and winter VOC concen-trations in a forest site 50 km away from Barcelona. Aro-matic VOCs showed small variations between the two pe-riods, while biogenic VOCs (bVOCs) and oxygenated VOCs (oVOCs) were elevated during summer, mainly due to higher physiological activity and faster photochemistry.
In addition, real-time measurements have been reported for urban or semi-urban environments in the Mediterranean. Filella and Penuelas (2006) studied the sources and varia-tions of VOCs by PTR-MS at a semi-urban site in Barcelona. Aromatic species such as toluene and benzene had diurnal patterns typical of traffic intensity. Their concentrations were higher during December and March. Biogenic species such as isoprene and monoterpenes had variable diurnal profiles during the four measurement periods. The isoprene diur-nal cycle suggested considerable contribution from anthro-pogenic sources. Monoterpenes had higher concentrations at night, decreasing in the morning until midday and increas-ing again in the evenincreas-ing. For some periods a peak also oc-curred during morning hours (06:00–09:00 LT), which was attributed to temperature-dependent emissions. Methanol, acetone, and acetaldehyde levels were influenced by biogenic sources during summer. In a study at two sites in the city of Athens, Rappenglück et al. (1998) monitored VOCs continu-ously over a 30-day late-summer period in 1994 by gas chro-matography (GC). The C4–C12hydrocarbons measured were
strongly related to traffic emissions.
Source apportionment analysis has been applied to VOC datasets in order to quantify the contributions of the differ-ent VOC sources (Millet et al., 2005; Brown et al., 2007; Vlasenko et al., 2009; Yuan et al., 2012). Slowik et al. (2010) performed PMF analysis of a PTR-MS dataset as well as a unified AMS/PTR-MS dataset over a 2-week period in Toronto Canada. PTR-MS data included 10 mass-to-charge ratios (m/z). Factors related to traffic, long-range transport, local oxidation, and other sources were reported. Crippa et al. (2013) also performed PMF analysis on an AMS/PTR-MS unified dataset for the city of Paris during the MEGAPOLI project (summer 2009 and winter 2010 campaigns). The re-sulting common factors associated a large percentage of the
aromatic VOCs with the hydrocarbon-like organic aerosol (HOA) during summer, while isoprene and the monoter-penes were mainly related to the semi-volatile oxygenated organic aerosol (SV-OOA). For the winter period wood burn-ing also contributed to the levels of the above species. Yuan et al. (2012) reported that reactions interfere with the PMF analysis of VOCs, proposing that one source can yield sev-eral factors at different stages of photochemical processing.
Despite the previous efforts, little is known concerning the current VOC sources in urban areas of the eastern Mediter-ranean. Elevated PM concentrations have been detected in many urban areas (Pikridas et al., 2013), but the correspond-ing VOC emission and concentrations have not been quan-tified. Enhanced sunlight intensity, higher temperature, and O3concentrations during summer promote the emissions and
oxidation of several VOCs. The aim of this work is to provide insights about the current VOC composition and origin in ur-ban areas in the eastern Mediterranean during summer and winter. Another objective of the present study is to assess the impact of residential biomass burning for wintertime VOC levels in these urban areas.
2 Experimental 2.1 Sampling sites
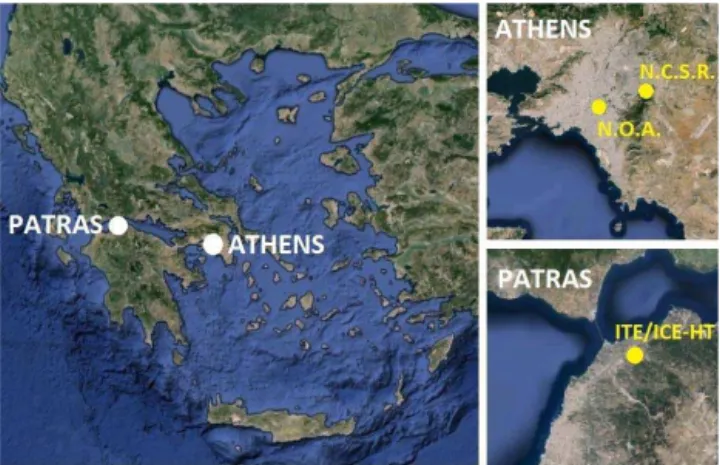
Summer measurements in Patras (population ∼300 000) were conducted during 11–26 June 2012 in the Institute of Chemical Engineering Sciences (ICE-HT), located 8 km northeast of the city center (lat 38.298◦, long 21.809◦, ele-vation 100 m). The area is surrounded by low vegetation and olive tree fields. The Athens (population∼4 million) sum-mer campaign was conducted between 3 and 26 July 2012 at the Demokritos National Center for Scientific Research in Athens (N.C.S.R.), which is located 8 km from the city center (lat 37.995◦, long 23.816◦, elevation 280 m) at the foothills of a mountain covered with pine vegetation. For the Athens winter campaign, the National Observatory of Athens (N.O.A.) (lat 37.973◦, long 23.718◦, elevation 110 m) was se-lected due to its proximity to the city center (<1.5 km). The selected urban site is located on top of a small hill away from major city roads. The Athens winter campaign took place from 9 January to 6 February 2013. The locations of all sam-pling sites are presented in Fig. 1.
2.2 Experimental setup
ni-Figure 1. Maps of Greece, Athens, and Patras together with the locations of the measurement sites used during the three campaigns.
trogen oxides (NOx), O3, and sulfur dioxide (SO2) (API
Teledyne, models T201, 400E, and 100EU respectively). The NOxmonitor uses a molybdenum oxide catalyst and chemi-luminescence and its measurements are known to be sub-ject to interferences by gas-phase nitric acid, alkyl nitrates, etc. (Dunlea et al., 2007). A scanning mobility particle sizer (SMPS) provided the number size distributions (TSI, mod-els 3080 and 3787). Meteorological variables and sunlight intensity were also measured. The sampling was conducted at approximately 15 m above ground. All gas species were sampled through Teflon (PTFE) tubing, while all particulate species were sampled through 3/8 in. copper tubing.
Athens summer campaign. The same instrumentation (PTR-MS and HR-ToF-AMS) was used for the Athens summer campaign. BC concentration was provided by an Aethalometer operating at 880 nm (Magee Scientific, AE31). An SMPS measured the particulate number distributions (model 3022 TSI, custom DMA). A PM2.5 cyclone and
a silica dryer were installed prior to the SMPS and the Aethalometer. The PTR-MS and AMS were measuring from inside the mobile laboratory of the Laboratory of Air Quality Studies (LAQS) parked next the N.C.S.R. station. Sampling for these instruments was conducted at 6 m above ground. For the PTR-MS sampling 1/4 in. PTFE tubing was used. For the AMS 3/8 in. copper tubing was selected. O3 and
NOxconcentrations were measured by the Ministry of Envi-ronment, Energy and Climate Change at an adjacent (300 m away) station.
Athens winter campaign. The instrumentation used was the same as in the Patras summer campaign. Additionally, carbon monoxide (CO) and carbon dioxide (CO2)were
mon-itored (API Teledyne, models 300E and T360 respectively). A Horiba monitor (model APSA 365) was used for the SO2
measurements. Meteorological data were obtained by the Na-tional Observatory of Athens. All sampling inlets were ap-proximately 6 m above ground.
PTR-MS operation. In all three campaigns, H3O+ was
used as the reaction reagent for the PTR-MS. The drift tube was operated at a pressure of 2.2–2.3 mbar and its voltage was 600 V. The inlet flow was 0.5 L min−1and the inlet tube and reaction chamber were heated to 60◦C. The residence time in the sampling lines prior to the PTR-MS was 10 s for the Patras summer campaign, 12 s for the Athens summer campaign, and 16 s for the Athens winter campaign. The cor-responding ratio of the electric field strength to the gas num-ber density was approximately 126 Td (1 Td=10−17V cm2). Blanks were obtained at regular intervals through an acti-vated carbon filter (Supelpure HC, Supelco). A Teflon filter was installed before the sampling inlet. Concentrations were monitored in the multiple ion detection (MID) mode with a total cycle time of 10 s. The dwell times were in the range of 5–500 ms. A 200 ms dwell time was used for most of the re-portedm/zvalues. For some of the higherm/zvalues a dwell time of 500 ms was selected. The dwell times form/z21, 30, 32, and 37 were 200, 5, 5, and 10 ms respectively in all three campaigns.
Calibrations were performed once per week. The sensitivi-ties for the reported compounds for all campaigns were in the range of 4.7 to 24 ncps ppb−1. These values did not change significantly (less than 40 %) during the three deployments. The detection limits for the calibrated compounds based on Karl et al. (2003) were in the range of 34 to 97 ppt. Humid-ity effects on the sensitivities of the individual compounds were not considered during the calibrations. A precision cal-ibrator (Teledyne, model 702) was used for the dilution of the VOC standard with VOC-free air (using a Supelco filter). This calibrator type does not substantially change the RH of the air. The ratio ofm/z37 tom/z19 was 0.039±0.009 during the Patras summer campaign, 0.044±0.012 during the Athens summer campaign, and 0.038±0.008 during the Athens winter campaign. In all campaigns the m/z37 to
m/z19 ratio was always less than 0.06 (typically ranging from 0.025 to 0.05). This ratio is considered low and sta-ble; thus, no corrections were applied for the H3O+(H2O)
ion. The concentrations of all compounds were normalized to the primary hydronium ion signal. For compounds for which calibration was not possible, the corresponding mixing ra-tios were estimated based on Eq. (3) of Taipale et al. (2008). Concentrations are calculated based on
[VOC] =CF RH+/H3O+, (1)
where CF is the calibration factor for each VOC and RH+ and H3O+ are the counts per second for the corresponding
VOC and the primary ion respectively. The concentrations reported for the non calibratedm/z’s are calculated for a re-action rate of
was not included in this dataset due to issues related to the humidity dependence of the measurements and its low pro-ton affinity (DeGouw and Warneke, 2007). Methanol was also excluded due to the difficulty of obtaining methanol-free air for the background measurements with the activated carbon filter. Acetaldehyde (m/z45) was also excluded from the dataset due to negative values, probably resulting from CO2 interferences (DeGouw and Warneke, 2007). Finally,
acrolein (m/z57) andm/z41 were not included due to spikes associated with butanol emissions from the SMPS instru-ments. Details for the rest of the instrumentation used in the campaigns can be found elsewhere (Kostenidou et al., 2015; Florou et al., 2016).
2.3 PMF analysis
The PMF technique (Paatero and Tapper, 1994; Lanz et al., 2007) was used for the deconvolution of the PTR-MS data into factors. The analysis was performed using the PMF eval-uation tool (Ulbrich et al., 2009) with Igor Pro 6.22A (Wave-metrics). The uncertainties were calculated based on Poisson ion-counting statistics (DeGouw et al., 2003) and the mea-sured background concentrations. The overall uncertainty is described by (DeGouw et al., 2003; Slowik et al., 2010)
1(I−Ib)= s
I τ +
Ib
τb, (3)
where I is the signal of the main measurements, Ib is the signal from the background measurements,1(I−Ib)is the overall uncertainty,τis the dwell time of the main sampling, andτbis the dwell time of the background sampling. A total of 29m/z values (Table S1) were used for the PMF anal-ysis. Mixing ratios (ppb) were used as input for the PMF model. Solutions with up to 10 factors were examined with an fpeak ranging from −2.0 to 2.0 with a step of 0.2. The
averaging time used was 5 min. The optimum solution for each measurement period was selected by evaluation of the model residuals, the mass spectra composition, and the cor-relations of the factor time series with other measured pol-lutants. The estimated concentrations by the PMF correlated very well (R2ranged from 0.994 to 0.999, Fig. S47) with the measured values for all three campaigns.
3 VOC concentrations and diurnal profiles 3.1 Patras summer 2012
The overall measurement period can be divided into three sub-periods based on the prevailing meteorology, namely 11– 15, 16–22, and 23–26 June. During the first period SW winds prevailed with an average temperature of 24.4◦C, a wind speed of 3 m s−1, and 58 % relative humidity. The second period was characterized by higher temperatures (28.4◦C) and stronger (5.3 m s−1)E-NE winds. The average relative
humidity was 29 %. The final period had SW winds mainly during the day and E-NE winds during the night. The aver-age temperature was 27.2◦C and the average relative humid-ity was 49 %. Average wind speed decreased during this pe-riod to 2.4 m s−1. There was no precipitation during the cam-paign. Additional information about the meteorological con-ditions and solar radiation can be found in the Supplement (Fig. S1). Back-trajectory FLEXPART (Stohl et al., 2005) and HYSPLIT analysis (Draxler and Rolph, 2013) was per-formed (Kostenidou et al., 2015). The air masses were influ-enced mostly by the marine environment during the first pe-riod and by continental Greece during the second and third period.
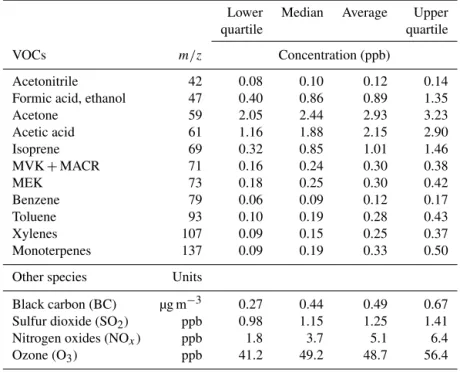
Table 1 summarizes the average, median, and upper and lower quartile of the concentrations for the some of the VOCs along with other gas and particulate species. Acetone was the most abundant VOC with an average concentration of 2.9 ppb. Acetic acid had a mean concentration of 2.2 ppb. Them/z69, reported here as isoprene, had an average con-centration of 1 ppb. Throughout the campaign, the acetoni-trile levels were on average 0.1 ppb with a flat diurnal profile, suggesting that biomass burning was not an important VOC source. Time series for the reported VOCs are presented in the Supplement (Fig. S2). Maximum values for the aromatic compounds were in the range of 1 ppb for toluene and the xylenes, while benzene concentrations of up to 0.4 ppb were measured. Isoprene and the monoterpenes had peak concen-trations up to 3 and 1 ppb respectively at noon.
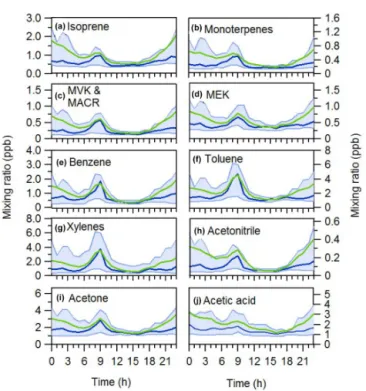
The average diurnal profiles for some of the VOCs mea-sured are shown in Fig. 2. The concentrations of iso-prene, the monoterpenes, methyl vinyl ketone (MVK), and methacrolein (MACR) were low during nighttime (Fig. 2a– c) and increased in the afternoon with a maximum at 15:00– 16:00 LT. Other compounds of mainly biogenic origin such as methyl ethyl ketone (MEK) (Fig. 2d) displayed a similar diurnal pattern, having two additional small peaks at 09:00 and 22:00 LT, something that shows either the influence of anthropogenic sources or the contribution of other molecules to them/z73 signal, reported here as MEK. Most of the bio-genic VOCs had higher concentrations during the second and third period. During these periods the air masses reaching the site passed over continental Greece, where there are moun-tains with forests.
Table 1.Concentrations (5 min averages) of VOCs and other pollutants during the Patras summer campaign.
Lower Median Average Upper
quartile quartile
VOCs m/z Concentration (ppb)
Acetonitrile 42 0.08 0.10 0.12 0.14
Formic acid, ethanol 47 0.40 0.86 0.89 1.35
Acetone 59 2.05 2.44 2.93 3.23
Acetic acid 61 1.16 1.88 2.15 2.90
Isoprene 69 0.32 0.85 1.01 1.46
MVK+MACR 71 0.16 0.24 0.30 0.38
MEK 73 0.18 0.25 0.30 0.42
Benzene 79 0.06 0.09 0.12 0.17
Toluene 93 0.10 0.19 0.28 0.43
Xylenes 107 0.09 0.15 0.25 0.37
Monoterpenes 137 0.09 0.19 0.33 0.50
Other species Units
Black carbon (BC) µg m−3 0.27 0.44 0.49 0.67 Sulfur dioxide (SO2) ppb 0.98 1.15 1.25 1.41 Nitrogen oxides (NOx) ppb 1.8 3.7 5.1 6.4
Ozone (O3) ppb 41.2 49.2 48.7 56.4
Figure 2.Average VOC diurnal profiles during the Patras summer campaign. Green lines present the average values. The median value is shown with blue. The blue area corresponds to the interquartile range.
in the range of 1 or less (for aged air masses) to 4 (associ-ated with fresh emissions measured in tunnels) (Roberts et al., 1984; Salisbury et al., 2003; Kristensson et al., 2004). Assuming no influence from biomass burning sources (the
acetonitrile levels were low), this ratio can be considered as a photochemical clock (Roberts et al., 1984); thus, the sam-pled air during the second period was on average more aged. During this period the air masses sampled were less influ-enced by the city of Patras and the surrounding areas.
Acetone’s concentrations were marginally elevated during daytime from 13:00 to 22:00 LT (Fig. 2i). Several oVOCs had a diurnal pattern similar to the biogenic VOCs. The di-urnal profile of acetic acid (Fig. 2j) peaked at approximately 17:00 LT. Higher values of the oVOCs were observed during the second period (Supplement Sect. S2, Fig. S2), suggesting strong biogenic influence.
NOx and BC concentrations displayed diurnal profiles (Figs. S3 and S4) similar to those of the aromatic species, typical of traffic emissions. Higher values were observed for both species during the first and third periods, while for the second period lower values were measured due to the strong E-NE winds. The average concentration for NOx was 5.1 ppb, while for BC a mean value of 0.5 µg m−3was measured. SO2concentrations were elevated during the day.
A peak during morning rush hour, similar to the aromatic VOCs, was observed but no peak was evident during evening rush hour. This can be explained by the low activity of heavy trucks during these hours (22:00–23:00 LT). A mean value of 1.3 ppb was found for SO2. Ozone concentrations were
elevated during the second period exceeding 60 ppb (8 h av-erage) during the night of 17 to 18 July. These elevated O3
concentration was actually observed a little before the mid-night of 18 June. This was actually the highest ozone level during the measurement period. This was in contrast to the low levels of NOx and BC observed during the same pe-riod. These results shown in Fig. S3 strongly support the conclusion that the high levels of ozone were due to long-range transport. Similar conclusions have been reached by Kouvarakis et al. (2002), reporting measurements performed onboard a cruise ship traveling on a regular basis in the area. They concluded that long-range transport is the main factor contributing to high ozone levels in eastern Greece. During these two days an average value of 55 ppb was measured. Di-urnally averaged O3concentrations for the overall
measure-ment period started to increase at 09:00 LT, with a maximum of 58 ppb during 15:00–16:00 LT. During the night (21:00– 07:00 LT) O3concentrations were in the range of 45 ppb.
3.2 Athens summer 2012
The Athens summer campaign was characterized by a pro-longed heat wave with temperatures reaching up to 40◦C. The average temperature was 29.6◦C and the corresponding relative humidity was 40 %. Local topography dictated the wind patterns, with the wind having mainly an E-SE direc-tion. The wind direction varied especially during the morning hours (08:00–11:00 LT) with wind shifts bringing air masses from the N or E of the site. The average wind speed was 1.7 m s−1with very low values during the night. No precipi-tation occurred throughout the campaign. More information concerning the meteorological conditions is included in the Supplement (Fig. S5).
Acetone was the most abundant VOC with an average value of 4.3 ppb (Table 2), significantly higher than in Pa-tras. Throughout the campaign the acetonitrile concentra-tions were on average 0.2 ppb with a flat diurnal profile, sug-gesting the lack of biomass burning sources. Figure S6 in-cludes all the VOC time series for the Athens summer cam-paign. Toluene and the xylenes peaked during the morning hours at concentrations in the range of 3 ppb, while ben-zene had typical maximum values around 1 ppb during these hours. Isoprene and the monoterpenes peaked at noon with concentrations in the range of 1 and 2 ppb respectively.
The average isoprene concentration was 0.7 ppb with a di-urnal profile (Fig. 3a) similar to Patras. Local sources signif-icantly influenced the monoterpene concentrations (Fig. 3b) with a peak during the morning hours (from 06:30 to 08:30) followed by several hours of elevated levels with a maxi-mum at approximately 15:00–16:00 LT. This behavior is sim-ilar to that reported by Filella and Penuelas (2006) for the Barcelona semi-urban site. Nighttime stagnation conditions followed by morning N or NE winds caused these elevated concentrations by transporting to the site nighttime emissions from the adjacent pine forest. MVK and MACR (Fig. 3c) had a similar diurnal cycle to that of isoprene, while MEK
Figure 3.Average VOC diurnal profiles during the Athens summer campaign. Green lines present the average values. The median value is shown with blue. The blue area corresponds to the interquartile range.
(Fig. 3d) peaked at 11:00–12:00 LT and had one more peak at 22:00, something also seen in the Patras summer campaign.
In Athens, higher aromatic concentrations were observed compared to the Patras summer campaign. These species had similar diurnal cycles (Fig. 3e, f, g) characteristic of traf-fic emissions, with a peak during the morning rush hour at 08:00–09:00 LT and one wide peak during the evening from 19:30 to 01:00 LT. The toluene to benzene ratio for the Athens summer campaign was 3.4, a value similar to that of fresh traffic emissions (Kristensson et al., 2004). Rap-penglück et al. (1998) reported a toluene to benzene ratio of 2.3 for the Demokritos site during August–September 1994. The correlation coefficients between the aromatic species (benzene, toluene, xylenes, C9and C10aromatics) were high
(R2ranging from 0.92 to 0.96), suggesting a single source related to traffic emissions.
The diurnal profiles of most oVOCs suggest anthropogenic influence (Fig. 3i and j). Acetone concentrations were ele-vated during the day with additional peaks during morning rush hour and during night (24:00 LT). Acetic acid concen-trations were lower during the day with a peak at 22:00– 23:00 LT and elevated concentrations during night hours. Morning rush hour had a very small effect on acetic acid’s levels. This compound appears to be associated mainly with regional sources.
sum-Table 2.Concentrations (5 min averages) of VOCs and other pollutants during the Athens summer campaign.
Lower Median Average Upper
quartile quartile
VOCs m/z Concentration (ppb)
Acetonitrile 42 0.16 0.19 0.20 0.23
Formic acid, ethanol 47 1.12 1.51 1.52 1.87
Acetone 59 3.27 4.09 4.28 4.92
Acetic acid 61 1.53 2.04 2.17 2.65
Isoprene 69 0.46 0.72 0.73 0.93
MVK+MACR 71 0.20 0.32 0.35 0.47
MEK 73 0.32 0.45 0.50 0.59
Benzene 79 0.12 0.16 0.22 0.24
Toluene 93 0.48 0.62 0.81 0.82
Xylenes 107 0.35 0.51 0.67 0.77
Monoterpenes 137 0.54 0.88 0.92 1.22
Other species Units
Black carbon (BC) µg m−3 0.43 0.60 0.72 0.89 Nitrogen oxides (NOx) ppb 5.1 5.6 7.3 7.5
Ozone (O3) ppb 49.6 55.5 54.1 59.1
mer measurements from Paris, Beijing, Mexico City, Tokyo, Houston, London, and Mohali (Sinha et al., 2014). Isoprene concentrations though were comparable with the findings from the above cities.
NOx and BC concentrations displayed diurnal profiles similar to those of the aromatic species, typical of traf-fic emissions (Figs. S7 and S8). The average concentration of NOx was 7.3 ppb, while BC had an average value of 0.7 µg m−3. Increased solar radiation along with the
avail-ability of O3 precursors resulted in high O3 exceeding the
EU 60 ppb 8 h limit in 4 days during the 13-day period. The O3average diurnal pattern was similar to that of Patras
dur-ing the summer with a maximum of 60 ppb durdur-ing 15:00– 16:00 LT. During the night concentrations of 50 ppb were measured.
3.3 Athens winter 2013
Due to the recent economic crisis and the increasing prices of heating oil at the time, a significant percentage of the pop-ulation in Greece has been using wood for residential heat-ing durheat-ing the winter. Durheat-ing the winter of 2012–2013, ex-treme episodes of atmospheric pollution occurred in Athens, with hourly PM1 levels reaching values up to 140 µg m−3
(Florou et al., 2016). The average temperature, humidity, and wind speed during the Athens winter campaign were 11.9◦C, 70 %, and 3.4 m s−1respectively. The wind direction patterns favored mainly S-SW winds and occasionally N-NE winds. Minimum night temperatures ranged from 3.3 to 15◦C. Pre-cipitation occurred during 11, 16, 18, 24, 25, and 26 January. Meteorological data are included in the Supplement (Figs. S9 and S10).
Table 3 summarizes the average, median, and lower and upper quartiles of the concentrations for some of the mea-sured VOCs. The substantial difference between the me-dian and average values for most species is due to periods with significant residential wood burning and correspond-ingly high concentrations. Concentrations of acetone and acetic acid reached 15 ppb, while isoprene levels were as high as 9 ppb. Acetone, acetic acid, and toluene had mix-ing ratios with median values in the range of 1.5 ppb. Ace-tone levels were significantly lower compared to the summer campaign. Formic acid/ethanol and acetic acid had concen-trations similar to the summer. The time series of the mea-sured VOCs is shown in Fig. S11 in the Supplement.
Most of the VOCs (Fig. 4) had higher average concentra-tions during the night and during the morning rush hour (peak at 09:00 LT). Evening concentrations started to increase at 19:00 LT. Very high concentration periods were detected for most of the measured VOCs. Aromatics increased during the morning rush hour together with formic acid and acetone. The toluene to benzene ratio for the campaign was 2.1, sug-gesting the importance of other sources in contrast to the summer ratio (3.4) when traffic dominated.
Table 3.Concentrations (5 min averages) of VOCs and other pollutants during the Athens winter campaign. Values are shown for the overall period and for the biomass burning periods.
Overall measurement period Biomass burning periods Lower Median Average Upper Lower Median Average Upper
quartile quartile quartile quartile
VOCs m/z Concentration (ppb)
Acetonitrile 42 0.05 0.08 0.16 0.18 0.34 0.45 0.55 2.70
Formic acid, ethanol 47 0.95 1.33 1.80 2.01 2.31 3.13 3.69 4.57
Acetone 59 1.10 1.52 2.24 2.48 4.05 5.04 5.76 6.74
Acetic acid 61 0.95 1.38 2.11 2.42 2.65 4.02 5.26 6.22
Isoprene 69 0.41 0.60 1.05 1.07 1.92 2.56 3.25 3.91
MVK+MACR 71 0.13 0.21 0.41 0.43 0.79 1.05 1.35 1.58
MEK 73 0.28 0.41 0.59 0.67 1.00 1.29 1.52 1.82
Benzene 79 0.29 0.55 1.00 1.10 1.94 2.58 3.18 3.70
Toluene 93 0.94 1.34 2.34 2.72 4.23 5.49 6.25 7.06
Xylenes 107 0.43 0.83 1.69 1.94 3.32 4.28 5.09 5.68
Monoterpenes 137 0.15 0.23 0.43 0.46 0.87 1.22 1.37 1.71
Other species Units
Black carbon (BC) µg m−3 0.46 1.00 2.02 2.35 5.78 7.63 7.98 9.54
Sulfur dioxide (SO2) ppb 0.7 1.1 1.6 1.9 1.1 1.8 2.3 3.0
Nitrogen oxides (NOx) ppb 5.9 1.3 24.6 26.5 51.8 70.3 79.7 93.1
Ozone (O3) ppb 8.7 25.9 21.6 32.6 1.8 2.7 3.5 4.3
Carbon monoxide (CO) ppm 0 0.1 0.3 0.4 1.0 1.2 1.4 1.7
Carbon dioxide (CO2) ppm 380 388 390 402 420 429 432 441
Figure 4.Average VOC diurnal profiles during the Athens winter campaign. Green lines present the average values. The median value is shown with blue. The blue area corresponds to the interquartile range.
methyl propanal form/z73 during the burning of tropical biofuels. Akagi et al. (2011) and Yokelson et al. (2013) re-ported furan emissions factors higher than isoprene for some biomass fuel types. Based on reported emissions from var-ious biofuel types, furan contributes around 30 % of the
m/z69 in most cases (Stockwell et al., 2015; Sarkar et al., 2016). For the Athens winter campaign isoprene is believed to be the major component ofm/z69. The VOC concentra-tions in Athens during winter are lower than those in Kath-mandu or Karachi (Sarkar et al., 2016) findings. Acetonitrile, acetone, benzene and toluene levels are similar to those mea-sured in London, Paris, and Barcelona, while the isoprene concentration is higher and closer to the Kathmandu and Karachi values.
NOx, BC, and CO had time series and average diurnal profiles (Figs. S12 and S13) that were similar to the ma-jority of the VOCs with peaks at morning rush hour and during the evening (18:00–23:00 LT). Their median values were 11.3 ppb, 1.0 µg m−3, and 100 ppb respectively. SO
2
concentrations were elevated mainly during the morning rush hour. During nighttime, lower SO2 values were observed
with some peaks around 23:00 LT that can be attributed to traffic and residential heating using diesel fuel. A median value of 1.1 ppb was observed. O3levels were reduced during
diurnal pattern had a peak at 15:00 LT and a median value of 25 ppb for the campaign.
Acenonitrile (m/z42) and levoglucosan’s tracer (m/z60 of the AMS) were used as markers in order to identify pe-riods where wood burning had a substantial contribution to the VOC and particulate levels. The concentration of these two species (Sect. S4.1) had a relatively high correlation (R2=0.78). In both cases elevated concentrations were ob-served mainly during the night but also during the morning, having a peak at 09:00 LT. These morning peaks can be at-tributed to residential heating at these hours but can also be a result of vertical mixing of the atmosphere. The acetonitrile’s relative increase is higher than that of the levoglucosan tracer (Fig. 5) during the morning rush hour. Recently, Dunne et al. (2012) reported interferences at PTR-MSm/z42 under the H3O+reaction when measuring in polluted urban
envi-ronments. These interferences were attributed to the13C iso-topologues of C3H+5 and the product ion C3H+6 formed by
reactions with NO+ and O+2 that exist in trace amounts in the reagent gas (H3O+). This leads to the conclusion that
even though an increase due to biomass burning is apparent during the morning hours (increase in levoglucosan’s tracer from the AMS), a fraction of m/z42 concentration is due to species other than acetonitrile. During the morning, traffic appears to contribute significantly to them/z42 increase.
A set of criteria was established in order to select peri-ods during which residential heating dominated the gas and particulate composition of ambient air. These periods (Ta-ble S2) occurred during the nighttime (18:00–06:00 LT) and were associated with acetonitrile concentrations exceeding 0.25 ppb. During these periods NW winds dominated, bring-ing air masses from the northern parts of Athens to the site (Fig. S10b). The average concentrations for these periods are shown in Table 3. Excluding the above biomass burning pe-riods from the campaign dataset resulted in a decrease in the average values of the measured species by 11–34 %. That is, the average values decreased by 26 % for acetonitrile, 11 % for formic acid and ethanol, 17 % for acetone, 16 % for acetic acid, 23 % for isoprene, 25 % for MVK and MACR, 17 % for MEK, 23 % for benzene, 18 % for toluene, 22 % for the xylenes, and 24 % for the monoterpenes.
4 Biomass burning emissions
Emission factors (EFs) were calculated based on EFi= (Ci)plume−(Ci)back
(CO2)plume−(CO2)back
EFCO2, (4)
where (Ci)plume and (Ci)back were the concentrations for
speciesi, during the burning and the reference periods (back-ground) respectively and (CO2)plume and (CO2)back are the
concentrations of CO2 during the biomass burning and the
reference periods. For the CO2 emission factor (EFCO2)a
value of 1600 g kg−1was used. This value was selected based
Figure 5.Time series of(a)AMS levoglucosan tracer (m/z60 of the AMS) and(b) acetonitrile for the Athens winter campaign. Light brown indicates periods where wood burning contributed sub-stantially to the total VOC and particulate levels. Also shown(c) are their average diurnal profiles.
on the typical values reported in the literature for several fuel types. The estimated EFs for the measured species are shown in Table 4.
Emission ratios (Table 5) for the gas and particulate species were calculated as 1[species]/ 1CO (Table 4), where1[species] is the difference in the concentration, of each compound, between the burning period and an adjacent reference period. This reference period was selected based on the lower acetonitrile, CO, and CO2concentrations at
ad-jacent time periods (prior or later) to the period identified as biomass burning. The estimated ratios are given in Table 4. Emission ratios for toluene, xylenes, and C9 and C10
Table 4.Emission factors (g kg−1)for VOCs and other species during biomass burning.
Emission Factors g kg−1of fuel
Species Residential Savanna fires Yucatán Pine-forest Coniferous African grass Alfalfa Black Ponderosa heating (Sinha et al., Mexico understory Canopy (Stockwell (Stockwell spruce pine (This work) 2003) (Yokelson (Yokelson (Yokelson et al., et al., (Stockwell (Stockwell
et al., et al., et al., 2015) 2015) et al., et al.,
2009) 2013) 2013) 2015) 2015)
CO2 1600 1700±60 1641±40 1668±72 1670±128 1565±14 1352±55 1724±35 1594±109
SO2 0.02±0.02 0.43±0.30 3.16±2.02 1.06±0.39 1.06±0.41 0.95±0.28 1.2±0.6 0.93±0.01 0.88±0.27
NOx(as NO) 1.6±0.2 3.3±0.6 4.19±3.33 2.55±0.41 2.40±1.47 2.10 3.41 3.42 2.97
CO 22.2±2.8 68±30 80.2±19.4 72.2±26 85.3±38.3 22.6±4.8 76.5±7.3 46.5±8.7 95.3±27 Acetonitrile 0.01±0.002 0.5 0.13±0.09 0.14±0.06 0.02±0.02 0.67±0.11 0.05±0.02 0.20±0.11 Formic acid 0.05±0.01 0.62±0.18 1.53±1.11 0.09±0.09 0.22±0.18 0.06±0.04 0.14±0.16 0.33±0.17 0.96±0.45
Ethanol 0.16±0.23 0.04±0.02
Acetone 0.14±0.02 1.10 0.35±0.29 0.37±0.2 0.09±0.07 0.82±0.11 0.72±0.78 0.82±0.49 Acetic acid 0.11±0.04 2.4±0.9 4.04±3.13 1.33±1.27 1.19±0.98 0.72±0.47 5.5±6.9 1.6±0.9 5.6±3.5 Isoprene 0.09±0.02 0.04±0.02 0.07±0.06 0.10±0.09 0.02±0.02 0.43±0.03 0.44±0.25 1.5±1.0
Furan 0.20±0.21 0.16±0.07 0.06±0.04 0.22±0.12 0.12±0.04 0.41±0.30
MACR 0.04±0.006 0.05±0.04 0.08±0.07 0.07±0.07 0.30±0.03 0.23±0.12 0.61±0.35
MVK 0.22±0.17 0.30±0.20
MEK 0.04±0.006 0.62 0.12±0.11 0.12±0.06 0.02±0.02 0.29±0.06 0.06±0.04 0.21±0.14 Benzene 0.12±0.01 0.18±0.09 0.76 0.18±0.17 0.62±0.59 0.04±0.03 0.53±0.26 0.59±0.25 1.29±0.90 Toluene 0.26±0.03 0.13±0.10 0.14±0.12 0.25±0.12 0.03±0.02 0.46±0.06 2.4±1.2 3.0±2.1
Xylenes 0.26±0.03 0.17∗ 0.18∗ 0.006±0.005∗ 0.15±0.02∗ 0.19±0.09∗ 0.18±0.08∗
Monoterpenes 0.08±0.02 0.25±0.24 0.62±0.46 0.005±0.004 0.12±0.02 0.10±0.04 0.22±0.16 ∗Sum ofm-,p-,o-xylene, and ethyl benzene.
5 VOC sources
5.1 Patras summer 2012 – PMF
For the Patras PMF analysis of the PTR-MS data a four-factor solution was selected. This choice is further discussed in the Supplement (Sect. S5.1 and S5.2). An fpeak of zero
was chosen based on them/zcomposition of the factors and the correlations of the factors to known external (BC and NOx)and internal (aromatic VOCs, biogenic VOCs) tracers (Supplement, Sect. S5.3). Solutions in thefpeak range from −0.4 to 0.2 have only minor differences. Other solutions de-riving from differentfpeakselections are also presented in the
Supplement. The factors obtained were attributed to biogenic emissions (factor bVOC), traffic emissions (factor TRAF), oxygenated VOCs (factor OVOC), and oxygenated VOCs of biogenic origin (factor b-OVOC).
The bVOC factor included mainly isoprene (m/z69) and the monoterpenes (m/z137) (Fig. 6). There were small con-tributions by m/z values 71, 81, 87, and 101. The factor average diurnal pattern has a peak at 15:00 LT. The factor showed weak correlations with the biogenic oxygenated or-ganic aerosol (b-OOA) and the moderately oxygenated OA (M-OOA) (R2=0.20 and 0.22 respectively) as obtained by the PMF analysis of the AMS data (Kostenidou et al., 2015). This weak correlation is due to the fact that the b-OOA has been at least partially produced away from the mea-surement site. This highlights the challenges of combining gas- and particulate-phase measurements during source ap-portionment applications. Sunlight intensity also had a weak
correlation (R2=0.24) with the bVOC factor. The factor also showed weak correlation (R2=0.29) with ambient tem-perature. These correlations improved to 0.28 and 0.35 re-spectively after shifting the time series of the factor earlier by 2 h. This suggests that some of the biogenic components included in this factor are transported emissions to the site from nearby areas. Wind roses indicate that the higher con-centrations (above the 75th percentile) were coming from E-NE (Fig. S24).
Factor TRAF included the aromatic species (m/z val-ues 79, 93, 107, 121, and 135) as well asm/z values 43, 59, 61, and 69 (Fig. 6). Some contribution bym/z values 71 and 73 was also observed. Its diurnal profile as expected is similar to that of the aromatic species (Fig. 2) with one peak at 09:00 LT and one at 22:00 LT. The toluene to ben-zene ratio of the factor was 2.6, i.e., the same as the ratio for the third period. Correlations between this factor and BC were relatively high (R2=0.66). The two hydrocarbon-like OA factors (HOA-1 and HOA-2) reported by Kostenidou et al. (2015) showedR2 of 0.49 and 0.43 with this factor re-spectively. The PM1 organonitrate calculated for the AMS
Table 5.Emission ratios for biomass burning due to residential heating. Comparison with reported emission ratios from various biomass fuel types.
Emission ratios (1species/ 1CO, ppb ppm−1)
Species Residential SW fuels SE fuels Pine spruce African Alfalfa Black Ponderosa heating (Warneke (Warneke (Warneke grass (Stockwell spruce pine (This work) et al., et al., et al., (Stockwell et al., (Stockwell (Stockwell
2011) 2011) 2011) et al., 2015) et al., et al.,
2015) 2015) 2015)
SO2 0.4±0.5 – – – 18.8±5.4 6.4±3.7 10±2 4.6±1.4
NOx 52.7±9 – – – 88 42 70 32
Acetonitrile 0.32±0.05 0.56 1.03 1.05 0.50±0.39 6.0±0.9 0.73±0.17 1.4±0.6 Formic acid 1.3±0.3 0.77 1.08 1.0 1.65±0.81 1.08±1.29 4.1±1.5 5.9±1.1 Ethanol
Acetone 2.9±0.5 0.84 1.93 1.94 1.19±1.42 5.2±0.5 8.9±11 3.9±1.1 Acetic acid 2.0±1.0 4.84 13.61 8.19 13.2±6.8 31±40 15.6±6.4 25.4±8.1 Isoprene 1.6±0.22 0.53 1.38 1.57 0.33±0.27 2.3±0.1 3.7±1.6 6.2±2.1
Furan 1.1±0.76 1.2±0.6 1.1±0.3 1.6±0.65
MVK+MACR 0.7±0.1 0.43 1.08 1.32 1.11±0.94 1.6±0.3 1.9±0.7 2.5±0.7 MEK 0.7±0.2 0.41 1.28 1.17 0.26±0.22 1.5±0.3 0.5±0.3 1.8±0.5 Benzene 1.8±0.2 0.86 0.83 2.29 0.57±0.3 2.5±1.1 4.5±1.2 4.6±1.8 Toluene 3.3±0.8 0.30 0.48 0.81 0.3±0.2 1.8±0.1 14.8±5.5 9.0±3.5 Xylenes 2.8±0.6 0.19 0.35 0.60 0.07±0.04 0.5±0.04 1.0±0.3 1.0±0.4 Monoterpenes 0.7±0.2 0.16 0.55 1.25 0.004±0.002 0.33±0.03 0.42±0.13 0.46±0.19
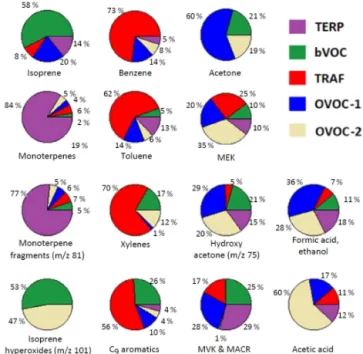
Figure 6.Results of Patras summer campaign PMF analysis. The left side shows the diurnal profiles of the factors. Green lines present the average values. The median value is shown with blue. The blue area is the interquartile range. The right side presents them/z com-position of each factor as a fraction of signal for eachm/z.
located. Other sources, such as cooking emissions and ships, might contribute to this factor to some extent.
The OVOC factor mainly included acetone. Otherm/z val-ues contributing to this factor were 43, 47, and 61 (Fig. 6). A weak correlation between the factor and the AMS’s b-OOA (R2=0.29) was observed. Additionally, low correla-tions were observed with particulate sulfate and nitrate (R2
of 0.23 and 0.18 respectively). The factor’s diurnal pattern (Fig. 6) reveals elevated concentrations during the night and a minimum at 15:00 LT. The factor seems to be affected by mixing height changes and from long-range transport.
The last factor (b-OVOC) included oxygenated molecules (acetic acid, acetone, and formic acid/ethanol). Other
con-Figure 7.Species percentage (%) attributed to the various PMF fac-tors for the Patras summer campaign.
tribute to this factor are either products of the oxidation of biogenic molecules or direct biogenic emissions. Ambient temperature and sunlight intensity had a moderate correlation with the b-OVOC withR2 of 0.35 and 0.32 respectively. A weak correlation (R2=0.27) of this factor was seen with the moderately oxygenated (M-OOA) by the AMS and no corre-lation (R2=0.08) was observed with the b-OOA. As in the bVOC factor, the greater concentrations of the b-OVOC fac-tor are coming from the E-NE (Fig. S24). This supports the explanation that the b-OVOC factor is mostly oxidation prod-ucts of local biogenic VOCs as well as temperature-sensitive emissions.
The contribution of each factor to the various VOC species is presented in Fig. 7. In total, 81 % of isoprene (m/z69) is included in the biogenic factors bVOC and b-OVOC. Monoterpenem/zvalues (137 and 81) were mainly assigned by the PMF to the bVOC factor (73 and 63 % respectively) and at smaller percentages to factor b-OVOC (9 and 6 % re-spectively). Factor TRAF included the majority of the aro-matic species (73–91 %). The rest of the aroaro-matic species are assigned by the PMF to other factors. This is probably due to the combination of the low concentrations of most of the aromatics and the uncertainties in the PMF analysis. These values also provide an estimate of the uncertainty in these re-sults. Patras summer PMF analysis demonstrates the impor-tance of biogenic sources to the VOC budget of urban areas during summer.
Figure 8.Results of Athens summer campaign PMF analysis. The left side shows the diurnal profiles of the factors. Green lines present the average values. The median value is shown with blue. The blue area is the interquartile range. The right side presents them/z com-position of each factor as a fraction of signal for eachm/z.
5.2 Athens summer 2012 – PMF
After the evaluation of various solutions, five factors were selected for this period with an fpeak equal to zero
(Sup-plement, Sect. S6.1, S6.2, S6.3). The factors were attributed to monoterpene species (factor TERP), other biogenic emis-sions (factor bVOC), traffic emisemis-sions (factor TRAF), and two oxygenated VOC factors (factor 1 and OVOC-2).
For the Athens summer campaign, the local monoterpene emissions were separated by the PMF from the rest of the biogenic emissions, creating a new factor named TERP. The
m/z values 137 and 81 were the main components of this factor, and its diurnal profile (Fig. 8) has an early morning peak similar to that of the monoterpenes in this site (Fig. 3). Other m/z values contributing to this factor were 43, 47, 59, 61, 69, 71, 73, 75, 77, and 93 (Fig. 8). No correlations (R2<0.05) were found between this factor and measured particulate species. These monoterpene emissions were due to local pine vegetation and their concentrations were af-fected by local mixing phenomena.
had a weak correlation (R2=0.15) with the very oxygenated OA factor (V-OOA) obtained by the PMF analysis of the AMS data (Kostenidou et al., 2015). No correlation existed with the AMS M-OOA factor.
Factor TRAF included the aromatic species (m/z values 79, 93, 107, 121, and 135). Also,m/zvalues 43, 47, 59, 61, and 73 contributed to this factor (Fig. 8). The diurnal profile is similar to that of the aromatic compounds (Fig. 3) with one peak at 09:00 and one at 22:00 LT. The toluene to benzene ratio of the factor was 3.1, indicating relatively fresh traffic emissions. Factor TRAF had moderate to high correlations with most of the species emitted by transportation sources: NOx(R2=0.69), BC (R2=0.45), AMS nitrate (R2=0.64) and AMS HOA-2 (R2=0.58). The factor’s correlation with AMS HOA-1 was surprisingly weak (R2=0.16). This in-consistency is believed to derive from the inhomogeneity of the source distribution around the sampling site along with the shifting wind directions (Kostenidou et al., 2015). The highest concentrations (upper quartile) of this factor were observed during periods when the wind came from N-NE (Fig. S34). Particulate organonitrates (AMS) showed good correlation with factor TRAF (R2=0.65).
Factor OVOC-1 was dominated by acetone. Other
m/z values contributing to this factor were 43, 47, and 61 (Fig. 8). No correlation (R2<0.08) was found between this factor and other species. Its concentration had a modest after-noon peak. This factor is considered a mix of contributions by long-range transport and various anthropogenic and bio-genic sources.
The OVOC-2 factor included mainly acetone (m/z59) and acetic acid (m/z61). The m/z43 and 47 also contributed (Fig. 8). The factors concentrations were elevated during the night. The factor had correlations with PM1 nitrate (R2=
0.49), HOA-1, and HOA-2 (R2 equal to 0.18 and 0.22 re-spectively), as well as with V-OOA (R2=0.34) and PM1
sulfate (R2=0.32). Due to these correlations and its diurnal profile, this factor is believed to be linked to a mix of urban sources as well as long-range transport.
The fraction of some selected VOC species attributed to each factor is shown in Fig. 9. The majority (58 %) of iso-prene is assigned to factor bVOC and smaller percentages to factors OVOC-1, TERP, and TRAF (14, 20, and 7 % respec-tively). Monoterpenes, m/z values 137 and 81, are almost exclusively included in factor TERP (84 and 76 % respec-tively). The majority (55 to 73 %) of the aromatic species (m/zvalues 79, 93, 121, and 135) are part of factor TRAF. 5.3 Athens winter 2013 – PMF
A five-factor solution and an fpeak equal to zero were
selected for the Athens winter campaign (Supplement, Sect. S7.1, S7.2, and S7.4). One factor was related to emis-sions originating from biomass burning (BBVOC). A factor for traffic emissions (factor TRAF) was identified, as well as one factor that was attributed mainly to industrial sources
Figure 9.Species percentage (%) attributed to the PMF factors for the Athens summer campaign.
(factor IND). Finally, two oxygenated VOC factors (OVOC-1 and OVOC-2) were found. The measurement period that was selected for this PMF analysis did not include the first day of the measurements of the Athens winter campaign. In-cluding the first day in the Athens winter campaign in the PMF analysis resulted in the separation of the biomass burn-ing source into two or more factors for solutions with four or more factors (Supplement, Sect. S7.3). No distinct varia-tion was seen for the favored wind direcvaria-tion between those BBVOC factors. Their time series (Fig. S41), though sim-ilar, showed significant differences for the first day of the campaign (9 and 10 January), when lower temperatures were recorded.
Factor BBVOC correlated strongly with the AMSm/z60 (R2=0.92) linked to levoglucosan and also with acetoni-trile (R2=0.80). It also had a high correlation (R2=0.84) with the AMS BBOA factor (Florou et al., 2016) and with other species emitted by biomass burning sources such as CO (R2=0.59) and BC (R2=0.63). The factor mainly included acetone, isoprene, MVK and MACR, MEK, ben-zene, xylenes, C9 aromatics, and monoterpenes (Fig. 10).
Figure 10.Results of Athens winter campaign PMF analysis. The left side shows the diurnal profiles of the factors. Green lines present the average values. The median value is shown with blue. The blue area is the interquartile range. The right side presents them/z com-position of each factor as a fraction of signal for eachm/z.
Factor TRAF has the same m/z values as in the sum-mer campaigns and is mainly linked to traffic. The aromat-ics are the main VOCs contributing to this factor. Other
m/z values that are present in considerable amounts are 43 and 59 (Fig. 10). The toluene to benzene ratio for this fac-tor is 3.0, similar to the value (3.1) of the same facfac-tor dur-ing the summer campaign in Athens. Its diurnal profile in-cludes one large peak corresponding to the morning rush hour and a smaller peak at approximately 19:00 LT (Fig. 10). The three factors related to traffic (factors named TRAF for the three studied campaigns) had a consistentm/zspectrum withR2values ranging from 0.68 to 0.90.
Factor IND mainly includes toluene and acetone (Fig. 10). Its diurnal pattern is relatively flat with slightly elevated con-centrations during the night. A weak minimum is observed at 09:00 LT. Due to the presence of toluene this factor is consid-ered of anthropogenic origin, probably related to industrial activities far from the site.
Factor OVOC-1 includes mainly formic acid (m/z47) and some isoprene. The factor’s diurnal profile (Fig. 10) was characterized by higher values during the early morning hours, peaking at 08:00 LT. After a significant decline in the morning it slowly increased during the rest of the day. No significant correlations were found between this factor and other measured species. Factor OVOC-1 could not be
asso-Figure 11.Species percentage (%) attributed to the PMF factors for the Athens winter campaign for the five-factor solution.
ciated with any potential source. Wind roses (Fig. S46) in-dicate that the higher concentrations were coming from the N-NE (city center) and that this factor is probably influenced by anthropogenic sources.
The last factor (OVOC-2) includesm/z43 and acetic acid. The diurnal profile had elevated values during the night hours and was slowly decreasing through the day. It is probably associated with background concentrations of several VOCs (Fig. 10).
For this measurement period, over 35 % of benzene, 14 % of the xylenes, 13 % of the C9 aromatics, and 14 % of
the C10 aromatics is estimated to be due to residential
biomass burning (Fig. 11). Additionally, traditionally bio-genic species such as m/z69 and the monoterpenes were originating mainly (46 and 36 % respectively) from residen-tial biomass burning during this winter period. The Athens winter PMF analysis highlights the importance of biomass burning during winter for the VOC budget. Biomass burn-ing and traffic were the major sources for the majority of the VOCs that were measured. However, biogenic sources had a limited contribution to the VOC budget.
5.4 PMF overview
2014; Wang et al., 2014). In the present study the PMF analy-sis did not result in such separations since the VOC portfolio did not include light alkanes, which are usually included in datasets obtained by gas chromatographic (GC) techniques. The vehicular exhaust and LPG sources widely reported in the literature include a large fraction of these species; thus, such a separation was not favored by the PMF analysis.
6 Conclusions
Online measurements of VOCs and other gas and particu-late species were performed in background urban sites of Greece during the summer and winter of 2012 and 2013. For the summer campaigns in Patras and Athens, the isoprene concentration was on average 1.0 and 0.7 ppb respectively. The corresponding values for the monoterpenes were 0.3 and 0.9 ppb with the elevated Athens concentrations originating mainly from local emissions. Typically, the isoprene concen-trations peaked during the day with values up to 2 ppb, while during the night the concentrations were lower (<0.5 ppb). Benzene, toluene, and the xylenes average concentrations were 0.12, 0.28, and 0.25 ppb for Patras and 0.22, 0.81, and 0.67 ppb for Athens respectively. These differences are con-sidered modest if the population difference (one order of magnitude) is taken into account. During the morning rush hour aromatic compounds such as toluene, peaked up to 5 ppb for Athens during the summer and 1 ppb for Patras. Analogous concentrations were seen for the xylenes, while benzene values during rush hour were in the range of 1 ppb for Athens and 0.3 ppb for Patras.
During winter in Athens the average concentrations for isoprene and the monoterpenes were similar to the summer values (1.1 ppb for isoprene and 0.4 ppb for the monoter-penes), indicating the importance of biomass burning sources of these compounds. Benzene, toluene, and the xylenes con-centrations were elevated during winter (1.0, 2.3, and 1.7 ppb respectively) compared to summer, something attributed to the lower mixing height and the presence of additional sources. Concentrations up to 15 ppb for acetic acid, toluene, and the xylenes were measured. For the majority of the mea-sured species, elevated concentrations were observed during night, signifying the importance of biomass burning, which was enhanced by the lower mixing heights.
PMF analysis showed that traffic was the major aromatic VOC source in all three campaigns. A traffic-related factor was identified including more than 60 % of benzene, 60 % of toluene, 70 % of the xylenes, and 70 % of the C9aromatics.
Especially during summer, traffic dominated the above aro-matic budget by contributing 73 % of benzene for Patras and Athens and 80 and 62 % of toluene for Patras and Athens re-spectively. In total, 85 % of the xylenes in Patras and 70 % in Athens were also apportioned to traffic.
The recent economic crisis along with the higher prices of fossil fuels has led to increased use of biomass burning for
residential heating. Biomass burning emission ratios (ERs) and emission factors (EFs) due to residential heating were es-timated. PMF analysis showed that the emissions of the aro-matics by biomass burning were comparable to traffic emis-sions. Approximately 35% of benzene was due to biomass burning during the Athens winter campaign. Additionally, during winter, the “traditional” biogenic species, such as
m/z69, the monoterpenes, MVK, and MACR were origi-nating mainly from biomass burning processes. During sum-mer these biogenic species were almost exclusively linked to emissions from vegetation. During summer several oVOCs such as acetic acid, formic acid, and ethanol were also linked to biogenic emissions either directly or as secondary prod-ucts.
7 Data availability
The VOC measurements in Patras and Athens during the three campaigns are available on request from Spyros Pan-dis ([email protected]).
The Supplement related to this article is available online at doi:10.5194/acp-16-14825-2016-supplement.
Acknowledgements. We thank A. Argyriou (Department of
Physics – University of Patras) for providing the meteorological data, K. Eleftheriadis (N.C.S.R. “Demokritos”) for providing the facilities for the Athens summer campaign, and E. Gerasopoulos (National Observatory of Athens – N.O.A) for providing the facilities for the Athens winter campaign. This research was co-financed by Greece and the European Union through the education and lifelong learning operational program Thales: “Sources and physicochemical properties of fine and ultrafine aerosol particles that affect the regional climate of Greece”. This research was also supported by the European Research Council Project ATMOPACS (Atmospheric Organic Particulate Matter, Air Quality and Climate studies) (grant agreement 267099) in coordination with project PEGASOS.
Edited by: J. Roberts
Reviewed by: two anonymous referees
References
Atkinson, R.: Atmospheric chemistry of VOCs and NOx, Atmos. Environ., 34, 2063–2101, 2000.
Badol, C., Locoge, N., and Galloo, J.: Using a source-receptor ap-proach to characterize VOC behavior in a French urban area in-fluenced by industrial emissions Part II: Source contribution as-sessment using the Chemical Mass Balance (CMB) model, Sci. Total Environ., 389, 429–440, 2008.
Boynard, A., Borbon, A., Leonardis, T., Barletta, B., Meinardi, S., Blake, D., and Locoge, N.: Spatial and seasonal variability of measured anthropogenic nonmethane hydrocarbons in urban at-mospheres: Implication on emission ratios, Atmos. Environ., 82, 258–267, 2014.
Brown, S., Frankel, A., and Hafner, H.: Source apportionment of VOCs in the Los Angeles area using positive matrix factoriza-tion, Atmos. Environ., 41, 227–237, 2007.
Colomb, A., Yassaa, N., Williams, J., Peekend, I., and Lochted, K.: Screening volatile organic compounds (VOCs) emissions from five marine phytoplankton species by head space gas chromatog-raphy/mass spectrometry (HS-GC/MS), J. Environ. Monitor., 10, 325–330, 2008.
Crippa, M., Canonaco, F., Slowik, J. G., El Haddad, I., De-Carlo, P. F., Mohr, C., Heringa, M. F., Chirico, R., Marchand, N., Temime-Roussel, B., Abidi, E., Poulain, L., Wiedensohler, A., Baltensperger, U., and Prévôt, A. S. H.: Primary and sec-ondary organic aerosol origin by combined gas-particle phase source apportionment, Atmos. Chem. Phys., 13, 8411–8426, doi:10.5194/acp-13-8411-2013, 2013.
Crutzen, P. and Andreae, M.: Biomass burning in the tropics: Impact on atmospheric chemistry and biogeochemical cycles, Science, 250, 1669–1678, 1990.
Davison, B., Taipale, R., Langford, B., Misztal, P., Fares, S., Mat-teucci, G., Loreto, F., Cape, J. N., Rinne, J., and Hewitt, C. N.: Concentrations and fluxes of biogenic volatile organic com-pounds above a Mediterranean macchia ecosystem in western Italy, Biogeosciences, 6, 1655–1670, doi:10.5194/bg-6-1655-2009, 2009.
DeGouw, J. and Warneke, C.: Measurements of volatile organic compounds in the earth’s atmosphere using proton-transfer-reaction mass spectrometry, Mass Spectrom. Rev., 26, 223–257, 2007.
DeGouw, J. A., Goldan, P. D., Warneke, C., Kuster, W. C., Roberts, J. M., Marchewka, M., Bertman, S. B., Pszenny, A. A. P., and Keene, W. C.: Validation of proton transfer reaction-mass spec-trometry (PTR-MS) measurements of gas-phase organic com-pounds in the atmosphere during the New England Air Qual-ity Study (NEAQS) in 2002, J. Geophys. Res., 108, 4682, doi:10.1029/2003JD003863, 2003.
Draxler, R. R. and Rolph, G. D.: HYSPLIT (HYbrid Single-Particle Lagrangian Integrated Trajectory) Model access via NOAA al-ready Website. NOAA Air Resources Laboratory, Silver Spring, MD, available at: http://ready.arl.noaa.gov/HYSPLIT.php (last access: November 2016), 2013.
Dunlea, E. J., Herndon, S. C., Nelson, D. D., Volkamer, R. M., San Martini, F., Sheehy, P. M., Zahniser, M. S., Shorter, J. H., Wormhoudt, J. C., Lamb, B. K., Allwine, E. J., Gaffney, J. S., Marley, N. A., Grutter, M., Marquez, C., Blanco, S., Cardenas, B., Retama, A., Ramos Villegas, C. R., Kolb, C. E., Molina, L. T., and Molina, M. J.: Evaluation of nitrogen dioxide chemilumines-cence monitors in a polluted urban environment, Atmos. Chem. Phys., 7, 2691–2704, doi:10.5194/acp-7-2691-2007, 2007.
Dunne, E., Galbally, I., Lawson, S., and Patti, A.: Interference in the PTR-MS measurement of acetonitrile atm/z42 in polluted urban air – A study using switchable reagent ion PTR-MS, Int. J. Mass Spectrom., 319–320, 40–47, 2012.
Farmer, D. K., Matsunaga, A., Docherty, K. S., Surratt, J. D., Sien-feld, J. H., Ziemann, P. J., and Jimenez, J. L.: Response of an aerosol mass spectrometer to organonitrates and organosulfates and implications on atmospheric chemistry, P. Natl. Acad. Sci. USA, 107, 6670–6675, doi:10.1073/pnas.0912340107, 2010. Filella, I. and Penuelas, J.: Daily, weekly, and seasonal time courses
of VOC concentrations in a semi-urban area near Barcelona, At-mos. Environ., 40, 7752–7769, 2006.
Flesca, N. G., Cicolella, A., Bates, M., and Bastin, E.: Pilot study of personal indoor and outdoor exposure to benzene, formaldehyde and acetaldehyde, Environ. Sci. Pollut. R., 6, 95–102, 1999. Florou, K., Papanastasiou, D. K., Pikridas, M., Kaltsonoudis, C.,
Louvaris, E., Gkatzelis, E., Patoulias, D., Mihalopoulos, N., and Pandis, S. N.: The contribution of wood burning and other pol-lution sources to wintertime organic aerosol levels in two Greek cities, Atmos. Chem. Phys. Discuss., doi:10.5194/acp-2016-721, in review, 2016.
Goldstein, A. H. and Galbally, I. E.: Known and unexplored organic constituents in the Earth’s Atmosphere, Environ. Sci. Technol., 41, 1515–1521, 2007.
Goldstein, A. H. and Schade, G. W.: Quantifying biogenic and an-thropogenic contributions to acetone concentrations in a rural en-vironment, Atmos. Environ., 34, 4997–5006, 2000.
Hallquist, M., Wenger, J. C., Baltensperger, U., Rudich, Y., Simp-son, D., Claeys, M., Dommen, J., Donahue, N. M., George, C., Goldstein, A. H., Hamilton, J. F., Herrmann, H., Hoff-mann, T., Iinuma, Y., Jang, M., Jenkin, M. E., Jimenez, J. L., Kiendler-Scharr, A., Maenhaut, W., McFiggans, G., Mentel, Th. F., Monod, A., Prévôt, A. S. H., Seinfeld, J. H., Surratt, J. D., Szmigielski, R., and Wildt, J.: The formation, properties and im-pact of secondary organic aerosol: current and emerging issues, Atmos. Chem. Phys., 9, 5155–5236, doi:10.5194/acp-9-5155-2009, 2009.
Holzinger, R., Williams, J., Salisbury, G., Klüpfel, T., de Reus, M., Traub, M., Crutzen, P. J., and Lelieveld, J.: Oxygenated compounds in aged biomass burning plumes over the East-ern Mediterranean: evidence for strong secondary production of methanol and acetone, Atmos. Chem. Phys., 5, 39-46, doi:10.5194/acp-5-39-2005, 2005.
Kampa, M. and Castanas, E.: Human health effects of air pollution, Environ. Pollut., 151, 362–367, 2008.
Karl, T., Jobson, T., Kuster, W. C., Williams, E., Stutz, J., Shetter, R., Hall, S. R., Goldan, P., Fehsenfeld, F., and Lindinger, W.: Use of proton-transfer-reaction mass spectrometry to character-ize volatile organic compound sources at the La Porte super site during the Texas Air Quality Study 2000, J. Geophys. Res., 108, 4508, doi:10.1029/2002JD003333, 2003.
Kesselmeier, J. and Staudt, M.: Biogenic Volatile Organic Com-pounds (VOC): An Overview on Emission, Physiology and Ecol-ogy, J. Atmos. Chem., 33, 23–88, 1999.
Kettle, A. J. and Andreae, M. O.: Flux of dimethylsulfide from the oceans: A comparison of updated data sets and flux models, J. Geophys. Res., 105, 26793–26808, 2000.
Koppmann, R.: Volatile organic compounds in the atmosphere, Blackwell Publishing Ltd, University of Wuppertal, Germany, 2007.
Kostenidou, E., Florou, K., Kaltsonoudis, C., Tsiflikiotou, M., Vra-tolis, S., Eleftheriadis, K., and Pandis, S. N.: Sources and chem-ical characterization of organic aerosol during the summer in the eastern Mediterranean, Atmos. Chem. Phys., 15, 11355–11371, doi:10.5194/acp-15-11355-2015, 2015.
Kouvarakis, G., Vrekoussis, M., Michalopoulos, N., Kourtidis, K., and Rappenglueck, B.: Spatial and temporal variability of tro-pospheric ozone (O3)in the boundary layer above the Aegean Sea (eastern Mediterranean), J. Geophys. Res., 107, 8137, doi:10.1029/2000JD000081, 2002.
Kristensson, A., Johansson, C., Westerholm, R., Swietlicki, E., Gid-hagen, L., Wideqvist, U., and Vesely, V.: Real-world traffic emis-sion factors of gases and particles measured in a road tunnel in Stockholm, Sweden, Atmos. Environ., 38, 657–673, 2004. Lanz, V. A., Alfarra, M. R., Baltensperger, U., Buchmann, B.,
Hueglin, C., and Prévôt, A. S. H.: Source apportionment of sub-micron organic aerosols at an urban site by factor analytical mod-elling of aerosol mass spectra, Atmos. Chem. Phys., 7, 1503– 1522, doi:10.5194/acp-7-1503-2007, 2007.
Leuchner, M. and Rappenglück, B.: VOC source–receptor relation-ships in Houston during TexAQS-II, Atmos. Environ., 44, 4056– 4067, 2010.
Lindinger, W., Hansel, A., and Jordan, A.: On-line monitoring of volatile organic compounds at pptv levels by means of Proton-Transfer-Reaction Mass Spectrometry (PTR-MS) Medical appli-cations, food control and environmental research, Int. J. Mass Spectrom., 173, 191–241, 1998.
Meskhidze, N. and Nenes, A.: Phytoplankton and cloudiness in the Southern Ocean, Science, 314, 1419–1423, 2006.
Millet, D. B., Donahue, N. M., Pandis, S. N., Polidori, A., Stanier, C. O., Turpin, B. J., and Goldstein, A. H.: Atmospheric volatile organic compound measurements during the Pittsburgh Air Quality Study: Results, interpretation, and quantification of primary and secondary contributions, J. Geophys. Res., 110, D07S07, doi:10.1029/2004JD004601, 2005.
Paatero, P. and Tapper, U.: Positive matrix factorization – a nonneg-ative factor model with optimal utilization of error-estimates of data values, Environmetrics, 5, 111–126, 1994.
Pikridas, M., Tasoglou, A., Florou, K., and Pandis, S. N.: Charac-terization of the origin of fine particulate matter in a medium size urban area in the Mediterranean, Atmos. Environ., 80, 264–274, 2013.
Rappenglück, B., Fabian, P., Kalabokas, P., Viras, L., and Ziomas, I. C.: Quasi-continuous measurements of non-methane hydrocar-bons (NMHC) in the greater Athens area during MEDCAPHOT-TRACE, Atmos. Environ., 32, 2103–2121, 1998.
Roberts, J. M., Fehsenfeld, F. C., Liu, S. C., Bollinger, M. J., Hahn, C., Albritton, D. L., and Sievers, R. E.: Measurements of aro-matic hydrocarbon ratios and NOx concentrations in the rural
troposphere. Observation of air mass photochemical aging and NOxremoval, Atmos. Environ., 18, 2421–2432, 1984.
Salisbury, G., Williams, J., Holzinger, R., Gros, V., Mihalopou-los, N., Vrekoussis, M., Sarda-Estève, R., Berresheim, H., von Kuhlmann, R., Lawrence, M., and Lelieveld, J.: Ground-based PTR-MS measurements of reactive organic compounds dur-ing the MINOS campaign in Crete, July–August 2001, Atmos. Chem. Phys., 3, 925–940, doi:10.5194/acp-3-925-2003, 2003. Sarkar, C., Sinha, V., Kumar, V., Rupakheti, M., Panday, A.,
Ma-hata, K. S., Rupakheti, D., Kathayat, B., and Lawrence, M. G.: Overview of VOC emissions and chemistry from PTR-TOF-MS measurements during the SusKat-ABC campaign: high ac-etaldehyde, isoprene and isocyanic acid in wintertime air of the Kathmandu Valley, Atmos. Chem. Phys., 16, 3979–4003, doi:10.5194/acp-16-3979-2016, 2016.
Seco, R., Peñuelas, J., Filella, I., Llusià, J., Molowny-Horas, R., Schallhart, S., Metzger, A., Müller, M., and Hansel, A.: Contrast-ing winter and summer VOC mixContrast-ing ratios at a forest site in the Western Mediterranean Basin: the effect of local biogenic emis-sions, Atmos. Chem. Phys., 11, 13161–13179, doi:10.5194/acp-11-13161-2011, 2011.
Sinha, P., Hobbs, P. V., Yokelson, R. J., Bertschi, I. T., Blake, D. R., Simpson, I. J., Gao, S., Kirchstetter, T. W., and No-vakov, T.: Emissions of trace gases and particles from sa-vanna fires in southern Africa, J.Geophys. Res., 108, 8487, doi:10.1029/2002JD002325, 2003.
Sinha, V., Kumar, V., and Sarkar, C.: Chemical composition of pre-monsoon air in the Indo-Gangetic Plain measured using a new air quality facility and PTR-MS: high surface ozone and strong influence of biomass burning, Atmos. Chem. Phys., 14, 5921– 5941, doi:10.5194/acp-14-5921-2014, 2014.
Stockwell, C. E., Veres, P. R., Williams, J., and Yokelson, R. J.: Characterization of biomass burning emissions from cooking fires, peat, crop residue, and other fuels with high-resolution proton-transfer-reaction time-of-flight mass spectrometry, At-mos. Chem. Phys., 15, 845–865, doi:10.5194/acp-15-845-2015, 2015.
Stohl, A., Forster, C., Frank, A., Seibert, P., and Wotawa, G.: Technical note: The Lagrangian particle dispersion model FLEXPART version 6.2, Atmos. Chem. Phys., 5, 2461–2474, doi:10.5194/acp-5-2461-2005, 2005.
Slowik, J. G., Vlasenko, A., McGuire, M., Evans, G. J., and Abbatt, J. P. D.: Simultaneous factor analysis of organic particle and gas mass spectra: AMS and PTR-MS measurements at an urban site, Atmos. Chem. Phys., 10, 1969–1988, doi:10.5194/acp-10-1969-2010, 2010.
Taipale, R., Ruuskanen, T. M., Rinne, J., Kajos, M. K., Hakola, H., Pohja, T., and Kulmala, M.: Technical Note: Quantitative long-term measurements of VOC concentrations by PTR-MS – measurement, calibration, and volume mixing ratio calculation methods, Atmos. Chem. Phys., 8, 6681–6698, doi:10.5194/acp-8-6681-2008, 2008.
Tassi, F., Capaccioni, B., Capecchiacci, F., and Vaselli, O.: Non-methane Volatile Organic Compounds (VOCs) at El Chichón vol-cano (Chiapas, México): Geochemical features, origin and be-havior, Geofísica Internacional, 48, 85–95, 2009.
Nisy-ros Island (Dodecanese Archipelago, Greece): Natural versus an-thropogenic sources, Environ. Pollut., 180, 111–121, 2013. Tolga, E., Cetin, B., Cetin, E., Bayram, A., and Odabasi, M.:
Char-acterization of volatile organic compounds (VOCs) and their sources in the air of Izmir, Turkey, Environ. Monit. Assess., 133, 149–160, 2007.
Ulbrich, I. M., Canagaratna, M. R., Zhang, Q., Worsnop, D. R., and Jimenez, J. L.: Interpretation of organic components from Posi-tive Matrix Factorization of aerosol mass spectrometric data, At-mos. Chem. Phys., 9, 2891–2918, doi:10.5194/acp-9-2891-2009, 2009.
Vlasenko, A., Slowik, J. G., Bottenheim, J. W., Brickell, P. C., Chang, R. Y.-W., Macdonald, A. M., Shantz, N. C., Sjost-edt, S. J., Wiebe, H. A., Leaitch, W. R., and Abbatt, J. P. D.: Measurements of VOCs by proton transfer reaction massspectrometry at a rural Ontario site: Sources and correla-tion to aerosol composicorrela-tion, J. Geophys. Res., 114, D21305, doi:10.1029/2009JD012025, 2009.
Wang, M., Shao, M., Chen, W., Yuan, B., Lu, S., Zhang, Q., Zeng, L., and Wang, Q.: A temporally and spatially resolved validation of emission inventories by measurements of ambient volatile or-ganic compounds in Beijing, China, Atmos. Chem. Phys., 14, 5871–5891, doi:10.5194/acp-14-5871-2014, 2014.
Warneke, C., Roberts, J. M., Veres, P., Gilman, J., Kuster, W. C., Burling, I., Yokelson, R., and DeGouw, J. A.: VOC identifica-tion and inter-comparison from laboratory biomass burning using PTR-MS and PIT-MS, Int. J. Mass Spectrom., 303, 6–14, 2011.
Yokelson, R. J., Crounse, J. D., DeCarlo, P. F., Karl, T., Urbanski, S., Atlas, E., Campos, T., Shinozuka, Y., Kapustin, V., Clarke, A. D., Weinheimer, A., Knapp, D. J., Montzka, D. D., Holloway, J., Weibring, P., Flocke, F., Zheng, W., Toohey, D., Wennberg, P. O., Wiedinmyer, C., Mauldin, L., Fried, A., Richter, D., Walega, J., Jimenez, J. L., Adachi, K., Buseck, P. R., Hall, S. R., and Shetter, R.: Emissions from biomass burning in the Yucatan, At-mos. Chem. Phys., 9, 5785–5812, doi:10.5194/acp-9-5785-2009, 2009.
Yokelson, R. J., Burling, I. R., Gilman, J. B., Warneke, C., Stock-well, C. E., de Gouw, J., Akagi, S. K., Urbanski, S. P., Veres, P., Roberts, J. M., Kuster, W. C., Reardon, J., Griffith, D. W. T., Johnson, T. J., Hosseini, S., Miller, J. W., Cocker III, D. R., Jung, H., and Weise, D. R.: Coupling field and laboratory measure-ments to estimate the emission factors of identified and uniden-tified trace gases for prescribed fires, Atmos. Chem. Phys., 13, 89–116, doi:10.5194/acp-13-89-2013, 2013.
Yuan, B., Shao, M,. deGouw, J., Parrish, D. D., Lu, S., Wang, M., Zeng, L., Zhang, Q., Song, Y., Zhang, J., and Hu, M.: Volatile organic compounds (VOCs) in urban air: How chemistry affects the interpretation of positive matrix factorization (PMF) analy-sis, J. Geophys. Res., 117, D24302, doi:10.1029/2012JD018236, 2012.