Submitted18 March 2016 Accepted 23 July 2016 Published23 August 2016
Corresponding author Dan F. DeBlasio, [email protected]
Academic editor Suzanna Lewis
Additional Information and Declarations can be found on page 9
DOI10.7717/peerj.2359
Copyright
2016 DeBlasio and Wisecaver
Distributed under
Creative Commons CC-BY 4.0
OPEN ACCESS
SICLE: a high-throughput tool for
extracting evolutionary relationships
from phylogenetic trees
Dan F. DeBlasio1and Jennifer H. Wisecaver2,3
1Department of Computer Science, University of Arizona, Tucson, AZ, United States 2Department of Biological Sciences, Vanderbilt University, Nashville, TN, United States
3Department of Ecology and Evolutionary Biology, University of Arizona, Tucson, AZ, United States
ABSTRACT
We present the phylogeny analysis softwareSICLE(SisterCladeExtractor), an easy-to-use, high-throughput tool to describe the nearest neighbors to a node of interest in a phylogenetic tree as well as the support value for the relationship. The application is a command line utility that can be embedded into a phylogenetic analysis pipeline or can be used as a subroutine within another C++ program. As a test case, we applied this new tool to the published phylome ofSalinibacter ruber, a species of halophilic Bacteriodetes, identifying 13 unique sister relationships to S. ruber across the 4,589 gene phylogenies.S. ruber grouped with bacteria, most often other Bacteriodetes, in the majority of phylogenies, but 91 phylogenies showed a branch-supported sister association between S. ruber and Archaea, an evolutionarily intriguing relationship indicative of horizontal gene transfer. This test case demonstrates howSICLEmakes it possible to summarize the phylogenetic information produced by automated phyloge-netic pipelines to rapidly identify and quantify the possible evolutionary relationships that merit further investigation.SICLEis available for free for noncommercial use at http://eebweb.arizona.edu/sicle/.
SubjectsBioinformatics, Computational Biology, Genomics, Computational Science
Keywords Phylogeny, Next-generation sequencing, High-throughput
INTRODUCTION
The analysis of phylogenetic trees is a critical component of evolutionary biology. Continued advances in sequencing technologies, computational power, and phylogenetic algorithms have facilitated the development of automated phylogenetic pipelines capable of quickly building hundreds of thousands of gene trees. These phylogenies can be applied to a variety of genomic problems including the functional characterization of unknown proteins (Eisen, 1998), orthology prediction (Gabaldón, 2008), and detection of gene duplication and horizontal transfer (Huerta-Cepas et al., 2010;Peña et al., 2010).
shell programs for processing phylogenetic trees (Junier & Zdobnov, 2010). However, the suite works best when processing species phylogenies; trees must be rooted, although rerooting is possible. This makes it difficult to automate the analysis of gene phylogenies in which the biological root is unknown (e.g., many bacterial trees). Another strategy for the high-throughput parsing of phylogenies is to search for a predefined association of interest; for example, interdomain HGT between co-occurring extremophilic bacteria and archaea (Nesbø et al., 2009) or HGT of cyanobacterial origin into the genomes of green algae (Moustafa & Bhattacharya, 2008). Several programs have implemented similar search processes includingPhyloSort(Moustafa & Bhattacharya, 2008),Pyphy( Sicheritz-Pontén & Andersson, 2001), PhyloGenie (Frickey & Lupas, 2004) and most recently
PhySortR (Stephens et al., 2016). However, in order to identify and summarize multiple evolutionary signals in a set of gene trees (e.g., all putative cases of HGT, even from unanticipated donors), one must manually iterate through such programs to identify all possible sister associations to the target clade of interest. Similar functionality can be found in new tools such as theETEToolkit(Huerta-Cepas, Serra & Bork, 2016) but requires some expertise in python programming to integrate into a given phylogenetic pipeline, and the user must build their own wrapper to automate the detection of sister associations to a clade of interest.
We present the phylogeny analysis software SICLE(SisterCladeExtractor), a tool to identify the nearest neighbors to a node of interest in a phylogenetic tree as well as the support value for the relationship. WithSICLEit is possible to summarize the phylogenetic information produced by automated phylogenetic pipelines for the rapid identification and quantification of possible evolutionary relationships that merit further investigation. The program is a convenient command line utility and is easy to adapt and implement in existing phylogenetic pipelines. In addition, the classes provided bySICLEcan be used as an API to provide a building block for new applications, which is similar to the functionality given to the user in theETEToolkit(Huerta-Cepas, Serra & Bork, 2016) but inC++for those that prefer this programming language. In the next section, we outline our approach and briefly describe the implementation methods. The source code and example forSICLE
are available for download athttp://eebweb.arizona.edu/sicle/free for noncommercial use under a Creative Commons Attribution-NonCommercial-ShareAlike (CC BY-NC-SA) License. We conclude by showing the benefit of SICLEby identifying horizontal gene transfer inSalinibacter ruber previously studied byMongodin et al. (2005)andPeña et al. (2010), not only replicating their result but identifying additional HGT candidates present in the published phylogenies.
METHODS
taxonomic hierarchy (e.g., bacterial phyla) as well as other, custom classification schemes to fit the needs of individual projects. Because each tree is processed independently, the running time should be linear as the number of trees being processed increases (without considering the filesystem constraints). Trees can be processed in parallel as there are no interdependencies between the analysis of different trees in the same experiment.
The process thatSICLEfollows has 3 major steps:
(1) Identify the target subtree. The node at the lowest common ancestor of all target leaves represents a subtree, which could consist of a single leaf. Thetarget leaf orleaves
are identified in one of two ways given the search stringS: (a) by using an exact prefix match (i.e., we assume that the first|S|characters of the leaf match those inS) or (b) by consideringSto be a regular expression (using the –Ecommand line argument) and testing if the leaf label satisfies the given expression. The target subtree is located as follows: given a search stringS, find the nodevin the tree (if one exists) for which every leaf in the subtree is a target leaf. If the target leaves are divided the program attempts to find a new root such thatvexists. If no re-rooting will make the target leaves monophyletic the program halts and alerts the user that a target clade cannot be found. Therefore,SICLEmay be unable to detect horizontally acquired gene copies (i.e., xenologs) if the ancestral gene copy is retained and also present in the phylogeny, because the target may not be monophyletic. In these cases, the user can reanalyze the subset of trees in which the target is non-monophyletic manually and/or by specifying a different target search string. The search string Sas a prefix is flexible and can correspond to a specific group identifier (e.g., Bacteroidetes), a subgroup (e.g., Bacteroidetes-Salinibacter), or even an individual leaf node (e.g., Bacteroidetes-Salinibacter_ruber_Phy001XKJS). This search criteria becomes even more flexible when the labeling is done using a regular expression.
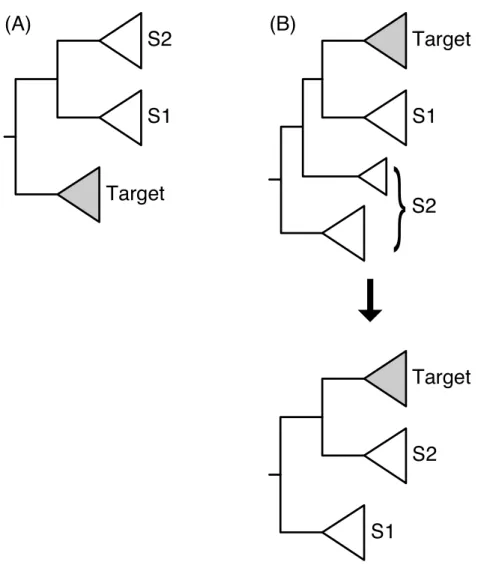
(2) Identify the subtrees of the possible sisters to the target.SICLEassumes that the root is arbitrary and that an outgroup is not necessarily known or available. Therefore,SICLE
returns up to two possible sisters to the target (S1 and S2,Fig. 1). These associations are contingent on two alternative tree rootings and are mutually exclusive.SICLEleaves it up to the user to determine which is the more biologically consistent sister association, if possible. One way to do this is to rank the possible sister associations based on their phylogenetic distance from the target based on the species tree (Wisecaver & Hackett, 2014). Determining the possible sisters falls into two cases: (2a) When the target subtree is a child of the root, the two sisters are the two children of the other child of the root (Fig. 1A). (2b) When the target subtree is not a direct descendant of the root, the other child of the target’s parent is one sister and the rest of the phylogeny is considered the other sister, as if the tree is re-rooted at the parent of the target subtree (Fig. 1B).
Figure 1 Two configurations for the identification of the sister subtrees given the location of the tar-get subtree.In (A) the target subtree is a direct descendant of the root of the tree, and in (B) it is not. Note that in (B) the tree can be rerooted visually even though this is not performed in practice.
kingdoms Plantae, Fungi, and Animalia. Animalia and Fungi could be further categorized as Opisthokonta, and all three are Eukaryota. An example configuration file is available on theSICLEwebsite. The hierarchy must be properly nested; however, it is possible to assess the results from alternative, conflicting hierarchies by rerunningSICLEspecifying different configuration files. When a group configuration file is given,SICLEidentifies the smallest hierarchical class that can summarize the whole sister subtree. If both sisters belong to the same hierarchical group, they are combined to return only a single result. If a sister clade does not fall into a single class in the hierarchy, no result is produced.
CASE STUDY
The utility ofSICLEwas demonstrated using gene trees from the halophilic Bacteroidetes
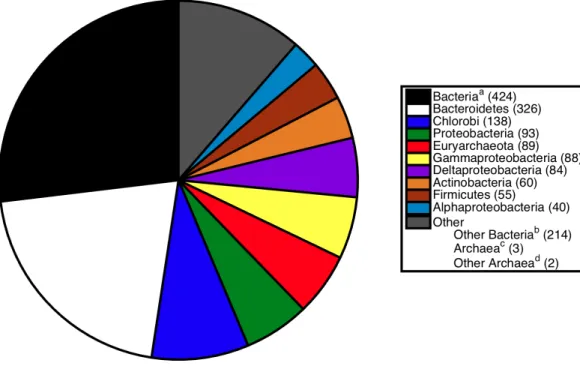
Figure 2 Breakdown of sister relationships to the subtree forS. ruberin 2,315 gene trees generated for strain M8. aBacteria, the sister subtree contained more than one bacterial phyla.bOther Bacteria, the sister
consisted of a single bacterial phyla not already listed above.cArchaea, the sister subtree contained more
than one archaeal phyla.dOther Archaea, the sister consisted of a single archaeal phyla other than
Eur-yarchaeota.
Mongodin et al., 2005). The trees were downloaded fromPhylomeDB, a public database containing complete collections of gene phylogenies for organisms (Huerta-Cepas et al., 2011). ABioPerlscript was used to prepend group identifiers to leaf names. These prefixes corresponded to prokaryotic phyla, except in the case of the proteobacterial leaves, which were prefixed with class identifiers (e.g., Gammaproteobacteria). TheBioPerlscript is available on theSICLEwebsite.
A total of 2,315 and 2,274 gene phylogenies were analyzed fromS. ruberM8 and M13 respectively. Trees were first parsed using the search prefix ‘Bacteroidetes-Salinibacter _ruber’ to identify 1,463 (M8) and 1,457 (M13) trees (from 1,499 orthologous clusters) in which the two strains were monophyletic. Trees in whichS. ruberwas not monophyletic were further parsed using search prefixes corresponding to M8 or M13 alone, and sister(s) to individual strains were identified in 91 (M8) and 72 (M13) additional phylogenies. In testsSICLEis able to analyze just over 3,000 phylogenies per minute on a 2.53 GHz Core 2 Duo laptop computer with 8GB of available RAM (thoughSICLEused less than 1 GB).
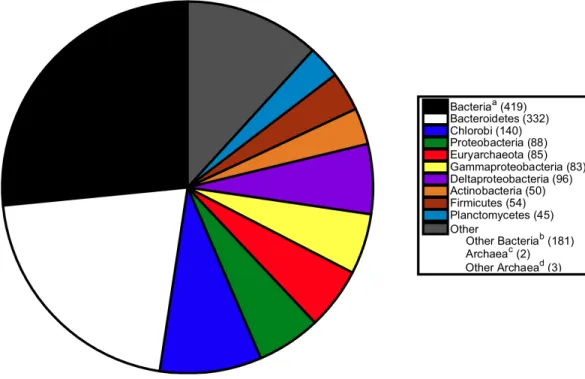
Figure 3 Breakdown of sister relationships to the subtree forS. ruberin 2,274 gene trees generated for strain M13. aBacteria, the sister subtree contained more than one bacterial phyla.bOther Bacteria, the
sister consisted of a single bacterial phyla not already listed above.cArchaea, the sister subtree contained
more than one archaeal phyla.dOther Archaea, the sister consisted of a single archaeal phyla other than
Euryarchaeota.
of the Proteobacteria, Actinobacteria, and Firmicutes (Fig. 2). The previously published association betweenS. ruber and the archaeal group Euryarchaeota was recovered in 89 gene phylogenies. Of those, 74 gene phylogenies showedS. ruber as exclusively sister to Archaea (i.e., the trees could not be rerooted in such a way that S. ruber had a second possible sister association to bacteria or eukaryotes), and of those, 33 gene phylogenies showed high branch support for the association between S. ruber and Euryarchaeota (PhyMLlocal support≥0.90). The proportion of sister associations present in strain M13 were virtually identical to those found in M8 (Fig. 3).
DISCUSSION
inspection, a significant time investment. ThisBLAST-first approach is susceptible to two types of error: (1) genes selected for further analysis based on local similarity may not support the prediction of HGT once a phylogenetic model of evolution is applied to the global alignment (Koski, Morton & Golding, 2001), and (2) genes whose phylogenies would be indicative of HGT may not pass theBLASTsimilarity thresholds (e.g., E-value, percent coverage) and are thus not analyzed (Wisecaver & Hackett, 2014). Without an efficient method for identifying associations suggestive of HGT directly from phylogenies, the alternative to theBLAST-first approach is manual inspection of each gene tree. For example, in a recent study of HGT from fungi in the plant-pathogenic oomycetes, the authors opted to manually inspect all 11,434 phylogenies for cases of gene transfer rather than limit their analysis to oomycete genes with a highBLASThit to fungi (Richards et al., 2011).
Peña et al. (2010)identified genes putatively involved in interdomain HGT between
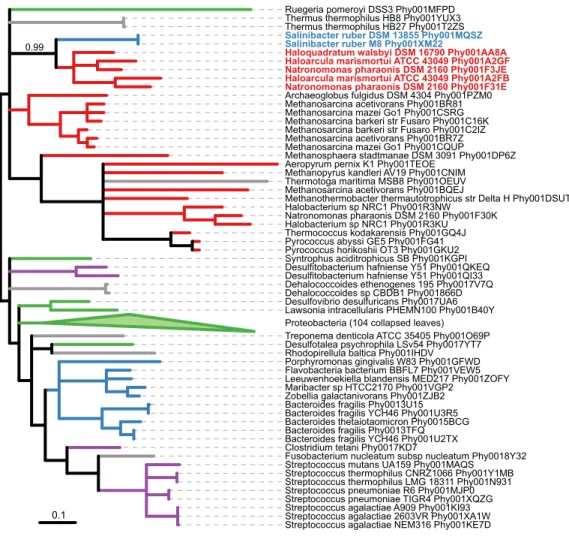
S. ruber and Archaea. In their analysis, genes were first screened for a bestBLASThit to archaeal genes with E-values below E-20 and a minimum query sequence overlap of 85%. Using thisBLAST-first approach, the authors identified 40 candidate genes inS. ruberstrain M8 putatively acquired from Archaea. Further validation of possible gene transfer was then performed using an analysis of oligonucleotide frequencies. Of the 40 candidate genes, 23 had gene phylogenies available onPhylomeDB, and only 8 supported theBLAST-determined association betweenS. ruberand Archaea withPhyMLlocal support≥0.9. WithSICLE, we identified an additional 25 gene phylogenies showing an exclusive association betweenS. ruber and Archaea, information that was parsed directly from the gene phylogenies rather than being first filtered based on local similarity. These 25 gene phylogenies may provide additional examples of HGT between these two groups and warrant further investigation. For example, the gene phylogenyPhy001XM22, a cation transport protein family, shows
S. ruber grouping sister to five species of halophilic Euryarchaeota with strong support (Fig. 4).
It is not our intent to suggest that all the trees identified bySICLEthat groupS. ruber
together with Archaea necessarily demonstrate true cases of HGT. On the contrary, there are many other possible sources of atypical phylogenetic placement, including contamination (Wisecaver et al., 2016), taxon sampling (Rokas et al., 2003), long branch attraction (Brinkmann et al., 2005), incomplete lineage sorting (Ebersberger et al., 2007), and differential gene loss (Qiu et al., 2012). Rather than the endpoint of a phylogenetic analysis, the purpose ofSICLEis to quickly and efficiently summarize the patterns present in large collections of gene phylogenies. Just as putative cases of HGT can be identified viaBLAST(Gladyshev, Meselson & Arkhipova, 2008), stochastic mapping (Cohen & Pupko, 2010), and compositional attributes (Lawrence & Ochman, 1998),SICLEidentifies putative cases of HGT based on tree topology. In addition to identifying potential HGT, SICLE
can be easily adapted to other phylogenetic problems requiring the quantification of evolutionary signals present in gene trees including endosymbiosis, hybridization, and incomplete lineage sorting.
We have presented a new tool for high-throughput phylogenetic analysis,SICLE(Sister
Figure 4 Maximum likelihood phylogenyPhy001XM22fromPhylomeDBshowing possible HGT from Euryarchaeota toS. ruber. The phylogeny has been midpoint rooted and visualized usingiTOL
version 3.0 (Letunic & Bork, 2016). Branches withPhyMLlocal support less than 0.90 were collapsed usingTreeCollapserCLversion 4.0 (Hodcroft, 2015). Branches are colored according to taxonomy: Bacteroidetes, blue; Archaea, red; Proteobacteria, green; Firmicutes, purple; other Bacteria, grey. The two
S. rubersequences are bolded and colored blue, and the five sister Euryarchaeota sequences are bolded and colored red. The local support for the association is indicated above the branch.
using a regular expression and having a tiered sister labeling system allows for very complicated searches to be preformed. WhileSICLEis a powerful analysis tool it is meant as a filtering mechanism for later analysis, i.e., the first step in making an observation about a large number of phylogenies. In the case study, we showed the usefulness ofSICLEfor identifying horizontal gene transfer. We showed that by usingSICLEinstead of a pre-tree
BLAST search, additional putative HGTs are identified while still recovering all of the previously found results.
ACKNOWLEDGEMENTS
ADDITIONAL INFORMATION AND DECLARATIONS
Funding
This work was funded by the NSF IGERT in Genomics at the University of Arizona DGE-0654435. The funders had no role in study design, data collection and analysis, decision to publish, or preparation of the manuscript.
Grant Disclosures
The following grant information was disclosed by the authors: NSF IGERT in Genomics at the University of Arizona: DGE-0654435.
Competing Interests
The authors declare there are no competing interests.
Author Contributions
• Dan F. DeBlasio conceived and designed the experiments, performed the experiments, contributed reagents/materials/analysis tools, wrote the paper, prepared figures and/or tables, reviewed drafts of the paper.
• Jennifer H. Wisecaver conceived and designed the experiments, performed the experiments, analyzed the data, contributed reagents/materials/analysis tools, wrote the paper, prepared figures and/or tables, reviewed drafts of the paper.
Data Availability
The following information was supplied regarding data availability: All source code and data is available athttp://eebweb.arizona.edu/sicle/.
REFERENCES
Brinkmann H, Van Der Giezen M, Zhou Y, Poncelin De Raucourt G, Philippe H. 2005.
An empirical assessment of long-branch attraction artefacts in deep eukaryotic phylogenomics.Systematic Biology 54(5):743–757DOI 10.1080/10635150500234609.
Cohen O, Pupko T. 2010.Inference and characterization of horizontally transferred gene families using stochastic mapping.Molecular Biology and Evolution27(3):703–713 DOI 10.1093/molbev/msp240.
Ebersberger I, Galgoczy P, Taudien S, Taenzer S, Platzer M, Von Haeseler A. 2007.Mapping human genetic ancestry.Molecular Biology and Evolution
24(10):2266–2276DOI 10.1093/molbev/msm156.
Eisen JA. 1998.Phylogenomics: improving functional predictions for uncharacterized genes by evolutionary analysis.Genome Research8(3):163–167
DOI 10.1101/gr.8.3.163.
Frickey T, Lupas AN. 2004.PhyloGenie: automated phylome generation and analysis.
Nucleic Acids Research32(17):5231–5238DOI 10.1093/nar/gkh867.
Gladyshev EA, Meselson M, Arkhipova IR. 2008.Massive horizontal gene transfer in bdelloid rotifers.Science320(5880):1210–1213DOI 10.1126/science.1156407.
Hodcroft E. 2015.TreeCollapserCL. Version 4.0.Available athttp:// emmahodcroft.com/
TreeCollapseCL.html.
Huerta-Cepas J, Capella-Gutierrez S, Pryszcz LP, Denisov I, Kormes D, Marcet-Houben M, Gabaldón T. 2011.PhylomeDBv3.0: an expanding repository of genome-wide collections of trees, alignments and phylogeny-based orthology and paralogy predictions.Nucleic Acids Research39(Database issue):D556–D560 DOI 10.1093/nar/gkq1109.
Huerta-Cepas J, Marcet-Houben M, Pignatelli M, Moya A, Gabaldón T. 2010.The pea aphid phylome: a complete catalogue of evolutionary histories and arthropod or-thology and paralogy relationships for Acyrthosiphon pisum genes.Insect Molecular Biology19(Suppl 2):13–21DOI 10.1111/j.1365-2583.2009.00947.x.
Huerta-Cepas J, Serra F, Bork P. 2016.ETE 3: reconstruction, analysis, and visualization of phylogenomic data.Molecular Biology and Evolution33(6):1635–1638
DOI 10.1093/molbev/msw046.
Junier T, Zdobnov EM. 2010.The newick utilities: high-throughput phylogenetic tree processing in the UNIX shell.Bioinformatics26(13):1669–1670
DOI 10.1093/bioinformatics/btq243.
Koski LB, Morton RA, Golding GB. 2001.Codon bias and base composition are poor indicators of horizontally transferred genes.Molecular Biology and Evolution
18(3):404–412DOI 10.1093/oxfordjournals.molbev.a003816.
Lawrence JG, Ochman H. 1998.Molecular archaeology of theEscherichia coligenome.
Proceedings of the National Academy of Sciences of the United States of America
95(16):9413–9417DOI 10.1073/pnas.95.16.9413.
Letunic I, Bork P. 2016.Interactive tree of life (iTOL) v3: an online tool for the display and annotation of phylogenetic and other trees.Nucleic Acids Research
DOI 10.1093/nar/gkw290.
Maruyama S, Matsuzaki M, Misawa K, Nozaki H. 2009.Cyanobacterial contribution to the genomes of the plastid-lacking protists.BMC Evolutionary Biology9:197 DOI 10.1186/1471-2148-9-197.
Mongodin EF, Nelson KE, Daugherty S, Deboy RT, Wister J, Khouri H, Weidman J, Walsh DA, Papke RT, Sanchez Perez G, Sharma AK, Nesbø CL, MacLeod D, Bapteste E, Doolittle WF, Charlebois RL, Legault B, Rodriguez-Valera F. 2005.The genome ofSalinibacter ruber: convergence and gene exchange among hyperhalophilic bacteria and archaea.Proceedings of the National Academy of Sciences of the United States of America102(50):18147–18152DOI 10.1073/pnas.0509073102.
Moustafa A, Bhattacharya D. 2008.PhyloSort: a user-friendly phylogenetic sorting tool and its application to estimating the cyanobacterial contribution to the nuclear genome of Chlamydomonas.BMC Evolutionary Biology 8:6
DOI 10.1186/1471-2148-8-6.
africanus TCF52B: lateral genetic connections to the Firmicutes and Archaea.Journal of Bacteriology191(6):1974–1978DOI 10.1128/JB.01448-08.
Nowack ECM, Vogel H, Groth M, Grossman AR, Melkonian M, Glöckner G. 2011.
Endosymbiotic gene transfer and transcriptional regulation of transferred genes in Paulinella chromatophora.Molecular Biology and Evolution28(1):407–422 DOI 10.1093/molbev/msq209.
Peña A, Teeling H, Huerta-Cepas J, Santos F, Yarza P, Brito-Echeverría J, Lucio M, Schmitt-Kopplin P, Meseguer I, Schenowitz C, Dossat C, Barbe V, Dopazo J, Rosselló-Mora R, Schüler M, Glöckner FO, Amann R, Gabaldón T, Antón J. 2010.Fine-scale evolution: genomic, phenotypic and ecological differentiation in two coexistingSalinibacter ruber strains.The ISME Journal4(7):882–895 DOI 10.1038/ismej.2010.6.
Qiu H, Yang EC, Bhattacharya D, Yoon HS. 2012.Ancient gene paralogy may mislead inference of plastid phylogeny.Molecular Biology and Evolution29(11):3333–3343 DOI 10.1093/molbev/mss137.
Richards TA, Soanes DM, Jones MDM, Vasieva O, Leonard G, Paszkiewicz K, Foster PG, Hall N, Talbot NJ. 2011.Horizontal gene transfer facilitated the evolution of plant parasitic mechanisms in the oomycetes.Proceedings of the National Academy of Sciences of the United States of America108(37):15258–15263 DOI 10.1073/pnas.1105100108.
Rokas A, King N, Finnerty J, Carroll SB. 2003.Conflicting phylogenetic signals at the base of the metazoan tree.Evolution & Development5(4):346–359
DOI 10.1046/j.1525-142X.2003.03042.x.
Sicheritz-Pontén T, Andersson SGE. 2001.A phylogenomic approach to microbial evolution.Nucleic Acids Research29(2):545–552DOI 10.1093/nar/29.2.545.
Stephens TG, Bhattacharya D, Ragan MA, Chan CX. 2016.PhySortR: a fast, flexible tool for sorting phylogenetic trees in R.PeerJ4:e2038DOI 10.7717/peerj.2038.
Wisecaver JH, Alexander WG, King SB, Todd Hittinger C, Rokas A. 2016.Dynamic evolution of nitric oxide detoxifying flavohemoglobins, a family of single-protein metabolic modules in bacteria and eukaryotes.Molecular Biology and Evolution
33(8):1979–1987DOI 10.1093/molbev/msw073.