Abstract—LTE (Long Term Evolution) is a next generation
standard by 3rd Generation Partnership Project (3GPPP)
consortium. In this paper, the physical layer (PHY) of LTE transceiver is analyzed in downlink and uplink transmissions. Simulations of the physical layer of LTE transceiver are obtained with the use of LTE System Toolbox by Mathworks. Simulation results are presented to show the performance of LTE transceivers in Physical Downlink Shared Channel (PDSCH) and Physical Uplink Shared Channel (PUSCH). Measurements of throughput and Bit Error Rate (BER) are obtained for different simulation configurations.
Index Terms—LTE, PDSCH, PUSCH, PHY, Simulation
I. INTRODUCTION
ong-Term Evolution (LTE) is a new standard specified by 3GPP for fourth generation (4G) wireless communications. LTE provides high spectral efficiency, high peak data rates, short round trip time, and frequency flexibility [1]. It relies on the following technologies; Orthogonal Frequency Division Multiplexing (OFDM) and Multiple-Input and Multiple- Output (MIMO), robust channel coding, scheduling and link adaptation [2]. LTE is interoperable with widely used technologies such as GPRS, WCDMA and HSPA, and this enables mobile operators deploying LTE to provide a seamless service and multi-mode devices for customers [3]. Some companies have already launched commercial LTE networks, e.g., Verizon Wireless in the United States and Vodafone in Europe [4].
The LTE technology has evolved over multiple releases which have led to improved data throughput, lower latencies, and increasingly flexible configurations [1]. Its first release, R8, provided peak rates of 300 Mbit/s downlink and 75Mbit/s uplink, a radio-network delay of less than 5 ms, bandwidth sized in 1.4, 3, 5, 10, 15, or 20MHz blocks to allow for a variety of deployment scenarios a significant increase in spectrum efficiency compared to previous cellular systems (Universal Mobile Telecommunications System -UMTS and High-Speed Packet Access - HSPA) [5]. Release 9 introduced some new service features and network architecture improvements
Manuscript received March 15, 2014; revised March 24, 2014.
T. O. Takpor is with the Electrical and Information Engineering Department, Covenant University, PMB1023 Ota, Nigeria (phone: 234-816-892-2697; e-mail: temitope.takpor@ covenantuniversity.edu.ng).
F. E. Idachaba is with the Electrical and Information Engineering Department, Covenant University, PMB1023 Ota, Nigeria (e-mail: [email protected]).
such as evolved multimedia broadcast and multicast service, location services and dual layer beam forming. Release 10, LTE Advanced, features peak data rate of 3 Gbps in downlink and 1.5 Gbps in uplink, higher order MIMO antenna configurations supporting up to 8×8 downlinks and 4×4 uplinks, and Carrier Aggregation (CA). Release 11 and beyond includes enhancements to Carrier Aggregation, MIMO, and relay nodes, introduction of new frequency bands, and coordinated multipoint transmission and reception [1].
LTE supports time and frequency division duplex schemes (TDD/FDD) in the same frequency bands as those allocated to UMTS: 15 frequency bands (1 to 14 and 17) are FDD and 8 bands (33 to 40) are TDD [6]. LTE also supports three modulation schemes, which are QPSK, 16-QAM and 64-16-QAM. Error Vector Magnitude (EVM) is a parameter used to measure the quality of modulation. The minimum requirements for the EVM are 17:5% for QPSK, 12:5% for 16-QAM and 8% for 64-QAM [7].
LTE downlink transmission scheme is based on Orthogonal Frequency Division Multiple Access (OFDMA), while the uplink transmission is based on Single Carrier Frequency Division Multiple Access (SC-FDMA). The main drawback of OFDMA over SC–FDMA is its high Peak to Average Power Ratio (PAPR) [8]. OFDMA allocates individual users in the time and the frequency domain and its signal generation in the transmitter is based on the Inverse Fast Fourier Transform (IFFT) [6].OFDMA converts the wide-band frequency selective channel into a set of many fading sub-channels, which enables optimum receivers to be implemented with reasonable complexity during MIMO transmission [9]. In the uplink, SC–FDMA is more power efficient than OFDMA due to its low PAPR, which leads to decrease in linearity requirements and enhances the efficiency of the power amplifiers of the User Equipment (UE) [7]. SC-FDMA is based on discrete Fourier transform (DFT)-precoded OFDMA [5]. Concerning uplink, LTE output power limits vary depending on the frequency band. The maximum TX power is 23 dBm [6].
Analysis and Simulation of LTE Downlink and
Uplink Transceiver
Temitope O. Takpor and Francis E. Idachaba, Members, IAENG
LTE Radio Access Network (RAN) is comprised of the following protocol entities: Packet Data Convergence Protocol (PDCP), Radio Link Control (RLC), Medium Access Control (MAC) and The Physical layer (PHY) [1]. The PHY transfers information to and from the MAC layer using transport blocks that convey data for at most two sub-frames [10]. This paper focuses only on the physical layer. Simulations with the LTE System toolbox are carried out in the Physical Downlink Shared Channel (PDSCH) and Physical Uplink Shared Channel (PUSCH). The PHY handles coding and decoding, modulation and demodulation, and antenna mapping. The LTE PHY is a highly efficient means of conveying both data and control information between an enhanced base station (eNodeB) and mobile User Equipment (UE) [11].
This paper is organized as follows: In Section II and III, the PDSCH downlink transmission and PUSCH transmission are analyzed respectively. The simulation results are shown in Section IV. Finally, conclusions are given in Section V.
II. LTEDOWNLINK TRANSCEIVER
LTE downlink (from tower to device) transmission is based on OFDMA. The LTE downlink physical resources can be represented by a time-frequency resource grid [9]. Resource elements are grouped into Resource Blocks (RBs) and each RB consists of 12 subcarriers with a spacing of 15 kHz in the frequency domain and 7 consecutive OFDM symbols in the time domain. The number of available RBs in the frequency domain varies depending on the channel bandwidth [12], and channel bandwidths may vary between 1.4 MHz and 20 MHz.
A. PDSCH Transceiver
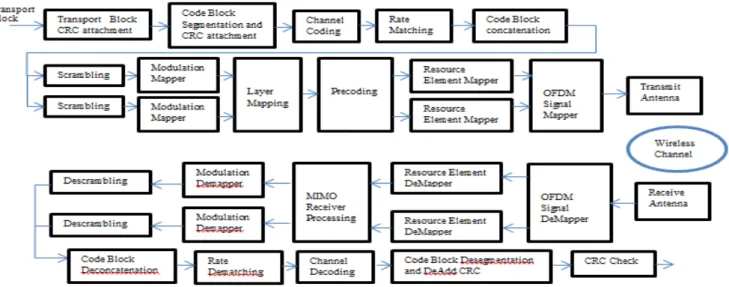
The transmitter and receiver structure of PDSCH is shown in Fig 1. The transmitter in the physical layer starts with the grouped resource data which are in the form of transport blocks. PDSCH is used to transmit the Downlink Shared Channel (DL-SCH). The DL-SCH is the transport channel used for transmitting downlink data (a transport block). One or two coded transport blocks (codewords) can
be transmitted simultaneously on the PDSCH depending on the precoding scheme used. According to [1] the processing steps of transmitting downlink data in PDSCH are given below.
--Transport block CRC attachment: A cyclic redundancy check (CRC) is used for error detection in transport blocks. The entire transport block is used to calculate the CRC parity bits and these parity bits are then appended to the end of transport block.
--Code block segmentation and CRC attachment: In LTE, a minimum and maximum code block size is specified so the block sizes are compatible with the block sizes supported by the turbo interleaver. Minimum code block size is 40 bits and maximum code block size is 6144 bits. The input block is segmented when the input block is greater than the maximum code block size.
--Channel coding: The channel coding scheme for PDSCH adopts Turbo coding, which is a robust channel coding [2]. The coding rate of turbo encoder is 1/3[9].The code blocks undergo turbo coding which is a form of forward error correction that improves the channel capacity by adding redundant information. The turbo encoder scheme uses a Parallel Concatenated Convolutional Code (PCCC) with two recursive convolutional coders and a contention-free Quadratic Permutation Polynomial (QPP) interleaver.
--Rate Matching: The main task of the rate matching block is to create an output bit stream to be transmitted with a desired code rate. As the number of bits available for transmission depends on the available resources the rate matching algorithm is capable of producing. The three bit streams from the turbo encoder are interleaved followed by bit collection to create a circular buffer. Bits are selected and pruned from the buffer to create an output bit stream with the desired code rate. The Hybrid Automatic Repeat Request (HARQ) error correction scheme is incorporated into the rate-matching algorithm of LTE.
--Code Block Concatenation: In this stage, the rate matched code blocks are concatenated back together. This task is done by sequentially concatenating the rate-matched blocks together to create the output of the channel coding.
--Scrambling: The codewords are bit-wise multiplied with an orthogonal sequence and a UE-specific scrambling
Fig. 1. PDSCH Transmitter and Receiver Structure
sequence to create the following sequence of symbols for each codeword.
--Modulation: The scrambled codewords undergo modulation using one of the PDSCH modulation schemes QPSK, 16 QAM, 64 QAM, resulting in a block of modulation symbols [9].
--Layer Mapping: The modulation symbols are mapped to one, two, or four layers depending on the number of transmit antennas used. There are mainly two kinds of layer mapping, one for transmit diversity and the other for spatial multiplexing. If transmit diversity is used, the input symbols are mapped to layers based on the number of layers. In the case of spatial multiplexing, the number of layers used is always less or equal to the number of antenna ports used for transmission of the physical channel.
--Precoding: Symbols on each layer will be pre-coded for transmission on the antenna ports according to different modes of transmission, which are spatial multiplexing, transmit diversity, and single antenna port transmission.
--Mapping to Resource Elements: For each of the antenna ports used for transmission of the PDSCH, the block of complex valued symbols, are mapped in sequence to resource elements not occupied by the other physical downlink channels except PDSCH, or synchronization and reference signals. The number of resource elements mapped to is controlled by the number of resource blocks allocated to the PDSCH. The symbols are mapped by increasing the subcarrier index and mapping all available REs within allocated resource blocks for each OFDM symbol.
--OFDM Modulation: Data stream are modulated to much orthogonal sub-carriers in parallel. A carrier will reduce each code element rate of the sub-carrier, increase the code element symbols cycle, and improve the system of anti-interference ability. OFDM modulation is mainly for Inverse Fast Fourier Transform (FFT) [9].
III. LTEUPLINK TRANSCEIVER
LTE uplink (from device to tower) transmission is based on SC-FDMA. Uplink transmission is organized in a frame structure with the frame duration of 10 ms [6]. SC–FDMA increases the capacity of the users by means of using several
frequencies for carrying the data of a single user and augments the BER [4].
A. PUSCH Transceiver
The transmitter and receiver structure of the LTE Uplink is shown in Figure 2. PUSCH channel can be divided into bit level, symbol level and sample level [7]. The physical uplink shared channel is used to transmit the uplink shared channel (UL-SCH) and control information (L1 and L2). UL-SCH is the transport channel used for transmitting uplink data (a transport block) which undergoes transport block coding. The encoding process includes type-24A CRC calculation, code block segmentation and type-24B CRC attachment, rate matching with and code block concatenation. The PUSCH transmission processing steps for the PUSCH as described in [1], includes:
--Transport block CRC attachment
--Code block segmentation and CRC attachment --Channel coding
--Rate Matching
--Code Block Concatenation
--Data and Control Multiplexing: The transport data and control multiplexing is performed such that HARQ-ACK information is present in both slots and is mapped to resources around the demodulation reference signals. The mapping is important, as it assumes the channel estimation are of better quality.
--Channel Interleaver: The channel interleaver implements a first time mapping of modulation symbols onto the transmit waveform while ensuring that HARQ information is present on both slots.
--Scrambling --Modulation
--Precoding: The PUSCH precoding is not the same as the downlink (multi-antenna) precoding. The block of complex valued symbols, is divided into sets. Each set corresponds to one SC-FDMA symbol. A Discrete Fourier Transform is then applied to each set, essentially precoding part of the SC-FDMA modulation.
--Mapping to Resource Elements.: The final stage in the PUSCH processing is to map the symbols to the allocated physical resource elements. The allocation sizes are limited
to values whose prime factors are 2, 3 and 5. The symbols are mapped in increasing order beginning with subcarriers, then SC-FDMA symbols.
--SC-FDMA modulation: is based on the OFDM approach, however, a Discrete Fourier Transform (DFT) precoding of the signal is employed. This operation spreads individual subcarriers which are known from the OFDM system over the assigned bandwidth and convert it to a single-carrier transmission, thus effectively reducing the PAPR [13], and improving the cell edge coverage and User Equipment (UE) battery life [14].
IV. SIMULATION RESULTS AND ANALYSIS
In the development and standardization of LTE, as well as the implementation process of equipment, simulations are necessary for testing and analysis [15]. In this paper, the simulations are performed using the Mathworks LTE System Toolbox. Throughput and Bit Error Rate (BER) performance results are analysed for PDSCH transceiver and PUSCH transceiver.
A. PDSCH Transmit Diversity Throughput Simulation LTE System Toolbox functions are used to show the PDSCH throughput of a transmit/receive chain. Channel noise is added to the received waveform which is then OFDM demodulated, resulting in a received resource grid for each receive antenna. Channel estimation is performed to determine the channel between each transmit/receive antenna pair. PDSCH data is then extracted and decoded from this recovered resource grid [1].
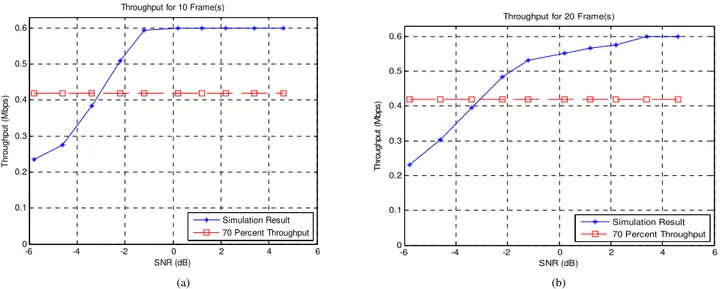
The PDSCH Transmit Diversity throughput simulation configuration is shown in Table 1. The simulation results in Fig. 3 show the throughput for 10 frames (a) and for 20 frames (b). For 10 frames, the throughput is above 70% when SNR is -2.2dB and above. Also, the throughput is steady when SNR is -1.2dB and above. For 20 frames, the throughput is above 70% when SNR is -1.2dB and above. Then the throughput increases and becomes steady when SNR is 3.4dB and above.
B. PUSCH Throughput Simulation
LTE System Toolbox functions is used to show the PUSCH throughput of a transmit/receive chain. Channel noise is added to the received waveform which is then SC-FDMA demodulated, resulting in a received resource grid for each receive antenna. Channel estimation is performed to determine the channel between each transmit/receive antenna pair. PUSCH data is then extracted and decoded from this recovered resource grid [1].
The PUSCH throughput simulation configuration is shown in Table 2. The simulation results in Fig. 4 show the throughput for 10 frames (a) and for 20 frames (b). For 10 frames, the throughput is above 70% when SNR is -2.2dB and above. Also, the throughput is steady when SNR is -1.2dB and above. For 20 frames, the throughput is above 70% when SNR is -2.2dB and above. Then the throughput increases and becomes steady when SNR is 3.4dB and
above.
In Fig. 5 and Fig. 6, the total throughput percentage against the SNR range for both PDSCH and PUSCH is shown. It can be seen that the throughput performance is similar in both PDSCH and PUSCH.
TABLEI
PDSCHTRANSMIT DIVERSITY THROUGHPUT SIMULATION CONFIGURATION
TABLE2
PUSCHTHROUGHPUT SIMULATION CONFIGURATION
C. PDSCH Bit Error Rate (BER) Simulation
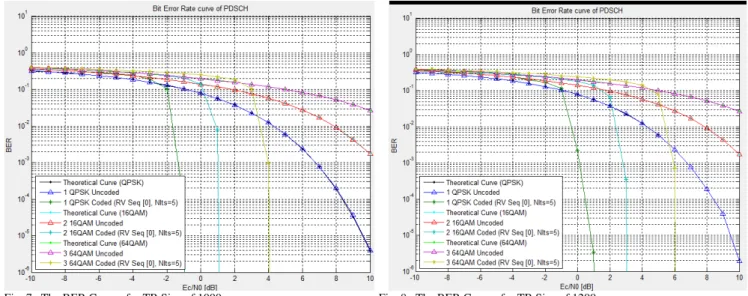
The LTE System Toolbox is used to create PDSCH BER curves under Additive White Gaussian Noise (AWGN) in a simple Graphical User Interface (GUI). Different BER curves are plotted for SNR range values (-10 to 10), transport block Size (1000, 1200), and modulation schemes: QPSK, 16QAM, 64QAM.
The BER curves in Fig. 7 and Fig. 8 show that the BER curves drop rapidly with increasing SNR for the coded modulation schemes. It also shows that when the transport block size increases the BER curves increases. Also, the BER curves increases with the coded modulation schemes (QPSK, 16QAM, 64QAM) respectively.
Codeword Single Transmission Scheme Transmit Diversity Number of Transmitters 4
Number of Receivers 2 Multi-antenna Correlation Medium
Propagation Channel Extended Pedestrian A (EPA 5)
HARQ 8 HARQ retransmission
processes Reference Measurement
Channel (RMC).
R.12
Number of Frames 10 (first simulation) and 20 (second simulation)
Signal to Noise Ratio (SNR) Range
[-5.8, -4.6, -3.4, -2.2, -1.2, 0.2, 1.2, 2.2, 3.4, 4.6]
Codeword Single Number of Receivers 2
Multi-antenna Correlation Low
Propagation Channel Extended Pedestrian A (EPA 5)
HARQ 8 HARQ retransmission
processes Fixed Reference Channel
(FRC).
A3-2
Number of Frames 10 (first simulation) and 20 (second simulation)
Signal to Noise Ratio (SNR) Range
[-5.8, -4.6, -3.4, -2.2, -1.2, 0.2, 1.2, 2.2, 3.4, 4.6]
-6 -4 -2 0 2 4 50
100 150 200 250 300 350 400
Throughput for 10 frame(s)
SNRdB
T
hr
oug
hpu
t (
k
bp
s
)
Simulation Result 70 Percent Throughput
-6 -4 -2 0 2 4
50 100 150 200 250 300 350 400
Throughput for 20 frame(s)
SNRdB
T
hr
ou
ghpu
t (
k
bps
)
Simulation Result 70 Percent Throughput
(a) (b)
Fig. 3. The PDSCH Throughput against the range of SNRs for 10 Frames (a) and 20 Frames (b) .
-6 -4 -2 0 2 4
10 20 30 40 50 60 70 80 90 100 110
Throughput for 10 frame(s)
SNRdB
T
hr
oug
hpu
t (
%
)
Simulation Result 70 Percent Throughput
-6 -4 -2 0 2 4 6
0 10 20 30 40 50 60 70 80 90 100
Throughput for 10 Frame(s)
SNR (dB)
T
hr
oug
hpu
t (
%
)
Simulation Result 70 Percent Throughput
Fig. 5. The PDSCH Throughput Percentage for 10 Frames Fig. 6. The PUSCH Throughput Percentage for 10 Frames
-6 -4 -2 0 2 4 6
0 0.1 0.2 0.3 0.4 0.5 0.6
Throughput for 10 Frame(s)
SNR (dB)
T
h
ro
ugh
pu
t (
M
bp
s
)
Simulation Result 70 Percent Throughput
-6 -4 -2 0 2 4 6
0 0.1 0.2 0.3 0.4 0.5 0.6
Throughput for 20 Frame(s)
SNR (dB)
T
hr
oughput
(
M
bps
)
Simulation Result 70 Percent Throughput
(a) (b)
V. CONCLUSION
This paper has analysed LTE transceiver in downlink (PDSCH) and uplink (PUSCH) transmissions. The simulation results obtained from the LTE System Toolbox further analysed the performance of the LTE transceiver by the measured throughput and BER graphs shown above. These results show clearly the throughput and BER that can be expected for different SNR values. Further work can be done by carrying out various downlink and uplink end to end simulations, and modeling with the LTE System Toolbox.
ACKNOWLEDGMENT
To GOD alone be appreciated for the wisdom given to write this paper.
REFERENCES
[1] Mathworks Documentation Manual of R2013b LTE System Toolbox: Getting Started with LTE System Toolbox, Examples, Downlink and Uplink Channels, The Mathworks Inc., 2013.
[2] Xuan Guo, Pengtao Song, “Simulink Based LTE System Simulator,” M.S. thesis, Dept. Signals and Systems, Chalmers Univ. Technology, Goteborg, Sweden, 2010.
[3] Ke Zhou, Jianyi Zhou, Zhiming Xu, “Design of a High Performance RF Transceiver for TDD-LTE System,” presented at the 2012 IEEE Int. Microwave Symposium Digest (MTT-S), Montreal, QC, Canada, pp. 1-3, Jun. 17-22, 2012.
[4] M.V.S. Lima, C.M.G. Gussen, B.N. Espindola, T.N. Ferreira, W.A. Martins, P.S.R. Diniz, “Open-Source Physical Layer Simulator for LTE Systems,” presented at the IEEE Int. Conf. on Acoustics, Speech and Signal Processing (ICASSP), Kyoto, Japan, pp. 2781-2784, Mar. 25-30, 2012.
[5] D. Astely, E. Dahlman, A. Furuskar, Y. Jading, M. Lindstrom, S. Parkvall, “LTE: The Evolution of Mobile Broadband,” IEEE Communications Magazine, vol. 47, no. 4, pp. 44-51, April 2009. [6] M. Suarez, O. Zlydareva, “LTE Transceiver Performance Analysis in
Uplink under various Environmental Conditions,” in Proc. IEEE 4th International Congress on Ultra Modern Telecommunications and Control Systems (ICUMT), St. Petersburg, Russia, pp. 84-88, October 2012.
[7] Na Hou, Kai Niu, Zhiqiang He, Shaohui Sun, “Test and Performance Analysis of PUSCH Channel of LTE System,” presented at the 2013 IEEE 5th International Symposium on Microwave, Antenna, Propagation and EMC Technologies for Wireless Communications (MAPE), Chengdu, pp. 110-114, Oct. 29-31, 2013.
[8] G. Indumathi, D. Allin Joe, “Design of Optimum Physical Layer Architecture for a High Data Rate LTE Uplink Transceiver,” in Proc.
IEEE Int. Conf. on Green High Performance Computing (ICGHPC),
India, March 2013.
[9] Jing Zhu, Haitao Li, “On the Performance of LTE Physical Downlink Shared Channel,” in Proc. IEEE Int. Conf. on Computer Science and Network Technology (ICCSNT), Harbin Normal University, Harbin, vol.2, pp. 983-986, December 2011.
[10] F. Rezaei, M. Hempel, H. Sharif, “A Comprehensive Performance Analysis of LTE and Mobile WiMAX,” presented at the 8th IEEE International Wireless Communications and Mobile Computing Conference (IWCMC), Limassol, CYPRUS, pp. 939-944, August 2012.
[11] Freescale Semiconductor White Paper: Overview of the 3GPP Long Term Evolution Physical Layer, Freescale Semiconductor Inc., 2007. [12] S.S.A. Abbas, P.A.J. Sheeba, S.J. Thiruvengadam, “Design of
Downlink PDSCH Architecture for LTE Using FPGA,” presented at the 2011 IEEE Int. Conf. on Recent Trends in Information Technology (ICRTIT), Chennai, Tamil Nadu, pp.947-952, June 2011. [13] J. Blumenstein, J.C. Ikuno, J. Prokopec, M. Rupp, “Simulating the
Long Term Evolution Uplink Physical Layer,” in Proc. IEEE ELMAR,
Zadar, pp.141-144, September 2011.
[14] A.D. Dabbagh, R. Rapeepat, G. Amitava, “On UMTS-LTE Physical Uplink Shared and Control Channels,” presented at the 68th IEEE Vehicular Technology Conference, Calgary, Canada, pp.1524-1528, September 2008.
[15] J.C. Ikuno, M. Wrulich, M. Rupp, “System Level Simulation of LTE Networks,” presented at the IEEE 71st Vehicular Technology Conference (VTC), Taipei, pp. 1-5, May 2010.