American Journal of Engineering Research (AJER)
e-ISSN: 2320-0847 p-ISSN : 2320-0936
Volume-6, Issue-1, pp-357-364
www.ajer.org
Research Paper Open Access
w w w . a j e r . o r g
Page 357
Fracture Energy Density of Mastics Determined Using the Binder
Fracture Energy (BFE) Test
Vivian Silveira dos Santos Bardini
1, Luis Miguel Gutiérrez Klinsky
2, José
Leomar Fernandes Júnior
3, Reynaldo Roque
41
(Environmental Engineering, Universidade Estadual Paulista, São José dos Campos, Brazil) 2
(Centro de Pesquisas Rodoviárias - CCR, Santa Isabel, Brazil) 3
(Universidade de São Paulo, São Carlos, Brazil) 4
(University of Florida, Gainesville, United States)
ABSTRACT:
The asphaltic mastic influences significantly the behavior of hot mix asphalt (HMA). Mineral fillers are not only inert fines in the asphalt binder, the physical-chemical interactions between the asphalt binder and the fillers affect the pavement performance, thus, the filler/asphalt binder ratio of the Superpave Specification by itself is not enough to evaluate the interactions and all filler influences on HMA properties. The study of mastic behavior is important to evaluate the effects of the mineral filler on the asphalt mixture mechanical properties. This research aims to contribute to a better understanding of the mineral filler effects on the fracture energy density, using the “Dog Bone Direct Tension Test”, which is based on nonlinear 3-D Finite Element Analysis (FEA) to determine the stress-strain relationship on the fracture plane. The addition of filler to the asphalt binder decrease the fracture energy value, compared to the pure asphalt binder, and as the filler amount increases, the fracture energy value decrease even more. Aging decreases the fracture energy of pure asphalt binder, however, increases the fracture energy of mastics. The Analysis of Variance shows that the type and amount of filler influence the fracture energy.Keywords:
Crack propagation, Direct Tension Test, Mastic Asphalt, Mineral filler, Fatigue Cracking,I.
INTRODUCTION
There is no lack of evidence that mineral filler plays an important role in the mechanical behavior of asphalt mixtures. The mineral filler fills the voids between the larger aggregate particles of the hot mix asphalt, and modifies the asphalt binder properties, because it acts like an active portion in the mastic (combination of asphalt binder, mineral filler and air). The mastic quality influences overall mechanical properties of asphalt mixtures, as well as their workability. The fatigue performance is highly related to the asphalt binder characteristics, to the mineral filler properties, and the physical-chemical interaction between both, which is affected, mainly, by the mineral filler surface characteristics and fineness.
The asphalt mastic stiffness affects the development of stresses and the fatigue strength at intermediate temperatures, the rutting susceptibility of asphalt mixtures at high temperatures and the development of stresses and the cracking strength at low temperatures. Fatigue damage, one of main distresses in asphalt mixtures, initiates with cohesive and/or adhesive microcracking and propagates as the microcracks grow and coalesce. Since crack phenomena (cohesive and adhesive fracture) is governed substantially by the mastic properties, mixture performance can be improved if the mastic is designed to resist fracture and fatigue.
Several researchers including Bahia et al. [1] and Smith and Hesp [2] have performed fatigue studies on binders and mastics. The general findings from these studies are that fatigue damage is strongly related to binder characteristics, filler properties, filler-bitumen interaction, and the phenomena that affect the microcrack development and growth in the mastic, such as crack pinning [3].
Most of researches perform traditional testing methods, like the Dynamic Shear Rheometer (DSR), the Bending Beam Rheometer (BBR), Elastic Recovery, Ductility etc., and analyzing traditional parameters such as complex shear modulus G* and phase angle δ, or some parameters derived from these tests such as yield energy and strain at maximum stress [4].
w w w . a j e r . o r g
Page 358
According to previous research, fracture energy analysis based in the Direct Tension Test (DTT) can predict cracking performance at intermediate temperatures better compared to other binder tests. However, according to Roque et al. [6], the DTT has some crucial deficiencies in terms of obtaining fracture energy accurately. A new binder fracture energy test was developed by Roque et al [6] based on nonlinear 3-D Finite Element Analysis (FEA) to determine the stress-strain relationship on the fracture plane, to accurately obtain the fracture energy.
Fracture energy is defined as the energy required to initiate the fracture in a mixture and it is recognized to strongly influence the cracking performance of asphalt pavements. Determining fracture energy in laboratory specimens demands the accurate determination of strain through fracture, at the instant of fracture, in the fracture plane. Fracture energy is believed to be one of the most important failure limits for describing and modeling the fracture behavior of asphalt mixtures. Previous studies have determined that fracture energy is a reliable indicator of the crack resistance of a mixture when other conditions such as pavement structure and traffic are similar [7].
The fracture energy determination from the properties of its components (that is, aggregate and asphalt binder properties) can be used in pavement design. Based on the binder fracture energy, the asphalt mixture fracture resistance could be predicted too. The determination of the accumulated energy until the fracture in binder tests can improve the ability to predict the cracking performance at intermediate temperatures. Thus, a test able to determine the binder fracture energy can provide better parameters related to the binder fatigue resistance.
II.
MATERIALS AND TEST PROCEDURE
Two asphalt binders, with penetration of 5.0 - 7.0 mm (50/70 PEN) and penetration of 8.5 - 10.0 mm (85/100 PEN), and three fillers, Portland cement, limestone and hydrated lime were selected for this study. The characteristics of the binders and the fillers are presented in Table 1 and 2, respectively.
Table 1: Physical Properties of the Asphalt Binder
Test ASTM Specification Result Unit
50/70 PEN 85/100 PEN 50/70 PEN 85/100 PEN 0.1 mm
Penetration D5 50 to 70 85 to 100 50 102 Degree C
Softening Point D36 Min 46 Min 43 48.6 43.5 cP
Brookfield Viscosity 135GC
D4402 Min 274 Min 214 377 252.5 cP
Brookfield Viscosity 150GC
D4403 Min 112 Min 97 187 130 cP
Brookfield Viscosity 177GC
D4404 57 to 285 28 to 114 69 52.5 cP
Table 2: Mineral Fillers Properties
Mineral Filler Specific gravity (kg/m3) Specific Surface (m2/kg)
limestone 2749 280 – 350
hydrated lime 2350 500 - 1500
Portland cement 3030 220 – 275
The fracture energy was determined in asphalt binders and mastics samples, unaged and aged in laboratory. Due to the lack of information and researches about which is the more suitable aging method for mastics, the aging was performed using two procedures: (1) the standard procedure (ASTM D 6521), applying 100 °C for 20 hours and; (2) a modified procedure, applying 60°C for 100 hours, stirring the sample every 20 hours.
w w w . a j e r . o r g
Page 359
Figure 1: Specimen final geometry configurationAfter the specimen reaches the test temperature, the loading rate should be determined. This selection depends on the type of material to be tested. Roque et al. [6] (2012) performed the test in unmodified and modified binder, with polymer (SBS), and the initial loading rate was 500 mm/min. The tests with asphalt mastics showed that the most appropriate initial loading rate was 100 mm/min. The final configuration after the fracture test is shown in the Figure 2 a.
Fig. 2 (a) and (b) show examples of appropriate fracture and premature fracture of the fracture energy test. The premature fracture is considered not suitable for calculating the fracture energy. The identification of premature fracture is based on the true stress-true strain curve, as an incomplete true stress-true strain curve. The Roque et al. [6] (2012) research indicates the stress-strain curve characteristics for each kind of asphalt binder tested.
(a) (b)
Figure 2: Specimen Fracture in the Dog Bone Direct Tension: (a) appropriate fracture; (b) premature fracture
The test is performed at different levels of loading rates and for each level, two specimens must be tested. The fracture energy density is calculated as the area under the stress-strain curve. The average fracture energy density of the two tests should not have an error higher than 15%. Specimens that show premature fracture should initiate the tests at lower loading rates, until an appropriate fracture is obtained. If premature fracture still occurs, then the temperature must be increased.
The test data analysis was developed by Roque et al. [6] (2012). Further details of the calculation steps of the fracture energy using this procedure can be found at Bardini [9]. Figure 3 shows the point where cracking initiate. The fracture energy is calculated considering the area under the stress-strain curve, from the beginning of the test until this point. The energy beyond is associated to crack developing and not to crack initiation, which is the purpose of the test.
Figure 3. Stress-Strain Curve calculated following recommendations of Roque et al. [6]
w w w . a j e r . o r g
Page 360
Fracture energy was performed first in pure asphalt binders, 50/70 PEN and 85/100 PEN. Roque et al. [6] indicate that the fracture energy is loading rate and temperature independent and recommend the initial test at 15 °C. However, the binders tested here showed a ductile fracture at this temperature, that is, a large elongation in the middle cross section, leading to an improper determination of the fracture energy. For this reason the tests were performed at 10 °C. The PAV binder samples were tested at the temperature of 15 °C. The mastic samples where tested at 15 and 20°C, in the unaged and aged conditions. Two temperatures were used to extend the conclusions of Roque et al. (2012) to asphalt mastics, since they analyzed asphalt binders.
Fig. 4 shows the results of the fracture energy density average of mastics composed by 50/70 PEN and Portland cement, limestone and hydrated lime. It is noted that adding filler to the asphalt binder decreases the energy fracture value, compared to the pure asphalt binder, and as the filler amount increases, the fracture energy density decreases even more, except for the Portland cement filler.
Figure 4: Fracture Energy of unaged 50/70 PEN mastics
Fig. 5 shows the results of the fracture energy density of 50/70 PEN mastics composed by Portland cement, limestone and hydrated lime, at the unaged condition and at the aged condition using the two PAV procedures described before. The results indicate that aged binder samples had lower fracture energy density than unaged binder samples. However, asphalt mastic showed an opposite behavior, but the mastic with limestone at f/a 1.2. Results also show that both PAV procedures decrease the fracture energy values of the pure asphalt binder. The modified PAV procedure causes a lower fracture energy decrease than the standard PAV procedure.
Figure 5: Fracture Energy Density of 50/70 PEN mastics, unaged and aged using standard PAV and modified PAV
w w w . a j e r . o r g
Page 361
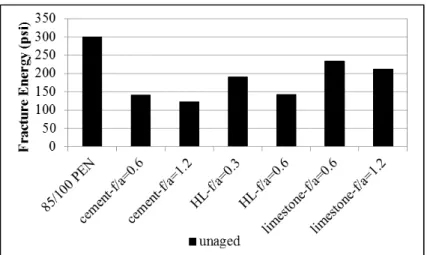
the unaged sample. Fig. 6 shows the results of the fracture energy density of mastics composed by 85/100 PEN and Portland cement, limestone and hydrated lime. As observed in the mastics composed by the 50/70 PEN, the addition of filler to the asphalt binder decrease the energy fracture value and as the filler amount increases, the fracture energy density decreases even more, including the Portland cement filler.
Figure 6: Fracture Energy of unaged 85/100 PEN mastics
Fig. 9 shows the fracture energy density of mastics composed by 85/100 PEN and Portland cement, limestone and hydrated lime, at unaged and aged conditions. Again, aging reduces the fracture energy density of the pure binder and increases the fracture energy density of the mastics, except for the mastic with limestone at ratio of 1.2 and with hydrated lime at ratio of 0.6. Both PAV procedures decrease the fracture energy density of the pure asphalt binder, but the modified PAV procedure causes a lower decrease. The modified PAV procedure increases the mastics fracture energy, but the one composed by the hydrated lime at ratio of 0.6.
Figure 7: Fracture Energy of 85/100 PEN mastics, unaged and aged using both PAV procedures
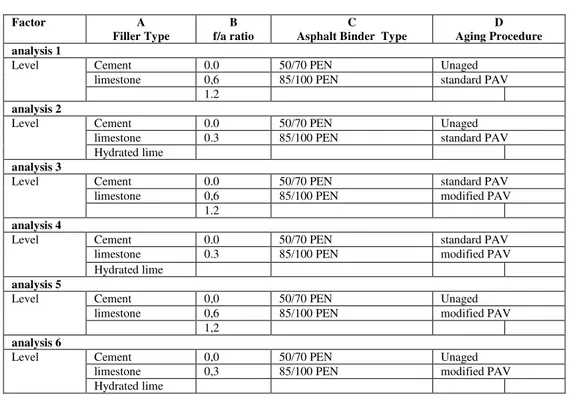
3.1 Analysis of Variance (ANOVA)
A factorial analysis was performed to investigate the effect of the type and amount of filler, and type of binder on the fracture energy. The experiment was divided, because the mastics composed by the Portland cement and limestone fillers were tested at 0.6 and 1.2 ratios; and the hydrated lime filler was tested at 0.3 and 0.6 ratio. It was also evaluated if aging has a statistical influence in the fracture energy, and if both procedures used here lead to different behavior. Table 3 shows the different factors levels combination of the analysis.
w w w . a j e r . o r g
Page 362
Factor A
Filler Type
B f/a ratio
C Asphalt Binder Type
D Aging Procedure analysis 1
Level Cement 0.0 50/70 PEN Unaged
limestone 0,6 85/100 PEN standard PAV
1.2
analysis 2
Level Cement 0.0 50/70 PEN Unaged
limestone 0.3 85/100 PEN standard PAV
Hydrated lime
analysis 3
Level Cement 0.0 50/70 PEN standard PAV
limestone 0,6 85/100 PEN modified PAV
1.2
analysis 4
Level Cement 0.0 50/70 PEN standard PAV
limestone 0.3 85/100 PEN modified PAV
Hydrated lime
analysis 5
Level Cement 0,0 50/70 PEN Unaged
limestone 0,6 85/100 PEN modified PAV
1,2
analysis 6
Level Cement 0,0 50/70 PEN Unaged
limestone 0,3 85/100 PEN modified PAV
Hydrated lime
The fracture energy density ANOVA results are summarized in Tables 4 to 6, showing the f0 (α = 0.10) values and the factors and interactions influence. Analysis (1) and (2), showed in Table 4, compared the unaged mastics to the aged mastics using standard PAV. Analysis (3) and (4), showed in Table 5, compared the two PAV procedures used in this study. Finally, Analysis (5) and (6), in Table 6, compared the unaged samples to the samples aged using the modified PAV.
Table 4: Fracture Energy ANOVA summary data, f0 values, factors and interaction influence, of analysis (1) and (2)
Factor analysis (1) analysis (2)
F0 f0 influence F0 f0 influence
A (filler type) 9.83 8.53 yes 84.93 9.00 yes
B (filler amount) 56.80 9.00 yes 388.02 8.53 yes
C (asphalt binder type) 0.03 8.53 no 8.63 8.53 yes
D (aging procedure) 0.08 8.53 no 0.05 8.53 no
AB 4.44 9.00 no 84.93 9.00 yes
AC 0.99 8.53 no 1.38 9.00 no
AD 9.17 8.53 yes 13.00 8.53 yes
BC 1.29 9.00 no 0.23 8.53 no
BD 16.08 9.00 yes 121.74 8.53 yes
CD 1.42 8.53 no 4.72 8.53 no
ABC 0.39 9.00 no 1.38 9.00 no
ABD 2.29 9.00 no 13.00 9.00 yes
ACD 0.30 8.53 no 1.00 9.00 no
w w w . a j e r . o r g
Page 363
Table 5: Fracture Energy ANOVA summary data, f0 values, factors and interaction influence, to analysis (3)and (4)
Factor analysis (3) analysis (4)
F0 f0 influence F0 f0 influence
A (filler type) 14.43 8.53 yes 104.40 9.00 yes
B (filler amount) 322.04 9.00 yes 68.17 8.53 yes
C (asphalt binder type) 0.18 8.53 no 4.10 8.53 no
D (aging procedure) 40.34 8.53 yes 8.57 8.53 yes
AB 7.15 9.00 no 79.16 9.00 yes
AC 0.78 8.53 no 0.53 9.00 no
AD 12.51 8.53 yes 1.36 8.53 no
BC 7.24 9.00 no 3.18 8.53 no
BD 1.48 9.00 no 0.92 8.53 no
CD 14.29 8.53 yes 1.91 8.53 no
ABC 0.39 9.00 no 0.73 9.00 no
ABD 5.32 9.00 no 0.39 9.00 no
ACD 0.05 8.53 no 0.35 9.00 no
BCD 6.11 9.00 no 0.04 8.53 no
Table 6: Fracture Energy ANOVA summary data, f0 values, factors and interaction influence, to analysis (5) and (6)
Factor analysis (5) analysis (6)
F0 f0 influence F0 f0 influence
A (filler type) 51.67 8.53 yes 29.33 9.00 yes
B (filler amount) 139.15 9.00 yes 113.26 8.53 yes
C (asphalt binder type) 4.60 8.53 no 5.46 8.53 no
D (aging procedure) 20.46 8.53 yes 2.74 8.53 no
AB 14.48 9.00 yes 22.09 9.00 yes
AC 2.02 8.53 no 0.65 9.00 no
AD 6.10 8.53 no 4.58 8.53 no
BC 0.06 9.00 no 0.02 8.53 no
BD 30.65 9.00 yes 25.54 8.53 yes
CD 0.32 8.53 no 0.07 8.53 no
ABC 2.01 9.00 no 0.00 9.00 no
ABD 2.51 9.00 no 2.18 9.00 no
ACD 0.98 8.53 no 0.03 9.00 no
w w w . a j e r . o r g
Page 364
IV.
CONCLUSIONS
The fracture energy density showed that adding filler to the asphalt binder decreases this property, compared to the pure asphalt binder. As the filler amount increases in the mastic, the fracture energy density decreases even more, except for the Portland cement filler. The aging decreases the fracture energy of pure asphalt binder, however, increases the fracture energy of the mastics, except for the one composed by the limestone filler at ratio of 1.2. These increase is more notorious in asphalt mastics with Portland cement and hydrated lime at low ratios.
Both PAV procedures decrease the fracture energy values of the pure asphalt binder, and the modified PAV procedure cause a lower fracture energy decrease than the standard PAV procedure. The aging increases the fracture energy of mastics with low filler concentration; however, the type of aging does not influences the fracture energy values.
The ANOVA showed that the fracture energy density is mainly influenced by the type and amount of filler in the asphalt mastic. The type of filler is the factor that influences the most, when hydrated lime mastics are included in the analysis. The asphalt binder had no statistical significance, but again, when hydrated lime mastics are included in the analysis, the asphalt binder becomes significant. The standard PAV had not statistical significance, but the modified PAV did.
Finally it is concluded that the binder fracture energy (BFE) test, using the dog bone configuration, can be satisfactorily be used to test and analyze asphalt mastics, at unaged and aged conditions.
ACKNOWLEDGEMENTS
The autors (Process number 0341/11-8, ex-bolsista do Programa de Doutorando no Brasil com Estágio no Exterior - PDEE,
REFERENCES
[1]. BAHIA, H.U.; ZHAI, H., KOSE, S.; BONNETTI, K. (1999). “Non-linear viscoelastic and fatigue properties of asphalt binders.”
Journal of the Association of Asphalt Paving Technologists, 68, 1–34
[2]. SMITH, B.J.; HESP, S.A.M. (2000) Crack Pinning in Asphalt Mastic and Concrete: Effect of Rest Periods and Polymer Modifiers on the Fatigue Life. 2nd Eurasphalt and Eurobitume Congress. Barcelona.
[3]. KIM, Y.R.; LITTLE, D.N.; SONG, I. (2003) “Effect of mineral fillers on fatigue resistance and fundamental material characteristics
–mechanic evaluation”. Transportation Research Record, Washington, n.1832, p1-8.
[4]. BAHIA, H., WEN, H.; JOHNSON, C.M. “Developments in intermediate temperature binder specifications”. Transportation
Research Circular, E-C147, December, 25-33, 2010.
[5]. ROQUE, R., LOPP, G., LI, W., NIU, T. (2009) “Evaluation Of Hybrid Binder Use In Surface Mixtures In Florida” Final report for
FDOT BD-545 Contract, University of Florida, Gainesville, FL.
[6]. ROQUE, R.; NIU, T.; LOOP, G. (2012) Development Of A Binder Fracture Test To Determine Fracture Energy Final report for
FDOT BDK-75-977-27 Contract, University of Florida, Gainesville, FL.
[7]. SEDWICK, S. C. (1998) “Effect of Asphalt Mixture Properties and Characteristics on Surface-Initiated Longitudinal Wheel Path
Cracking”. Thesis (master) Department of Civil and Coastal Engineering, University of Florida, Gainesville.
[8]. AASHTO T 314-02: Standard method of test for determining the fracture properties of asphalt binder in direct tension (DT). American Association of State Highway and Transportation Officials, AASHTO, Washington DC, 1 Jan 2007.
[9]. BARDINI, V.S.S. (2013) “Influência do Fíler Mineral nas Propriedades de Misturas Asfálticas Densas” 337 p. Tese (Doutorado).

![Figure 3. Stress-Strain Curve calculated following recommendations of Roque et al. [6]](https://thumb-eu.123doks.com/thumbv2/123dok_br/18153968.327927/3.892.150.746.845.1078/figure-stress-strain-curve-calculated-following-recommendations-roque.webp)